
Executive Summary
Chapter 1: 3C Transportation Planning in the Boston Region
Chapter 2: The TIP Process
Chapter 3: Highway and Transit Programming
Chapter 4: Performance Analysis
Chapter 5: Determination of Air Quality Conformity
Chapter 6: Community Transportation Access Performance Report
Prepared by
The Central Transportation Planning Staff:
Staff to the Boston Region Metropolitan Planning Organization
Directed by the Boston Region Metropolitan Planning Organization,
which is composed of the
Massachusetts Department of Transportation
Metropolitan Area Planning Council
Massachusetts Bay Transportation Authority
MBTA Advisory Board
Massachusetts Port Authority
Regional Transportation Advisory Council
City of Boston
City of Beverly
City of Everett
City of Framingham
City of Newton
City of Somerville
Town of Arlington
Town of Acton
Town of Brookline
Town of Burlington
Town of Hull
Town of Norwood
Town of Wrentham
Federal Highway Administration (nonvoting)
Federal Transit Administration (nonvoting)
This document was funded in part through grants from the US Department of Transportation. Its contents do not necessarily reflect the official views or policies of the US Department of Transportation.

CIVIL RIGHTS NOTICE TO THE PUBLIC
Welcome. Bem Vinda. Bienvenido. Akeyi. 欢迎. 歡迎

You are invited to participate in our transportation planning process, free from discrimination. The Boston Region Metropolitan Planning Organization (MPO) is committed to nondiscrimination in all activities and complies with Title VI of the Civil Rights Act of 1964, which prohibits discrimination on the basis of race, color, or national origin (including limited English proficiency). Related federal and state nondiscrimination laws prohibit discrimination on the basis of age, sex, disability, and additional protected characteristics.
For additional information or to file a civil rights complaint, visit www.bostonmpo.org/mpo_non_discrimination.
To request this information in a different language or format, please contact:
Boston Region MPO Title VI Specialist
10 Park Plaza, Suite 2150
Boston, MA 02116
Phone: 857.702.3700
Email: civilrights@ctps.org
For people with hearing or speaking difficulties, connect through the state MassRelay service, www.mass.gov/massrelay. Please allow at least five business days for your request to be fulfilled.
Boston Region MPO
MPO Activities Group, Central Transportation Planning Staff
10 Park Plaza, Suite 2150
Boston, MA 02116
857.702.3700 (voice)
For people with hearing or speaking difficulties, connect through the state MassRelay service:
Relay Using TTY or Hearing Carry-over: 800.439.2370
Relay Using Voice Carry-over: 866.887.6619
Relay Using Text to Speech: 866.645.9870
For more information, including numbers for Spanish speakers, visit
https://www.mass.gov/massrelay
tip@ctps.org
[Certification letter]-coming soon
The Federal Fiscal Years (FFYs) 2026–30 Transportation Improvement Program (TIP) is the Boston Region Metropolitan Planning Organization’s (MPO) five-year capital investment plan for the Boston region’s transportation system.
Guided by the Boston Region MPO’s vision, goals, and objectives, the TIP prioritizes investments that preserve the current transportation system in a state of good repair, provide safe and reliable transportation for all modes, enhance livability, support clean air and healthy communities, promote equity, resiliency, and sustainability, and improve mobility throughout the region. These investments fund arterial roadway and intersection improvements, maintenance and expansion of the public transit system, shared-use path construction, first-and-last-mile improvements for users of active transportation, and major highway reconstruction.
The Boston Region MPO is guided by a 23-member board with representatives of state agencies, regional organizations, and municipalities. Its jurisdiction extends roughly from Boston north to Ipswich, south to Marshfield, and west to municipalities along Interstate 495. Each year, the MPO conducts a process to decide how to spend federal transportation funds for capital projects. The Central Transportation Planning Staff (CTPS), which is the staff to the MPO, manages the TIP development process.
MPO staff coordinates the evaluation of project funding requests, proposes programming of current and new projects based on anticipated funding levels, supports the MPO board in developing a draft TIP document, and facilitates a public review of the draft before the MPO board endorses the final document.
The complete TIP project list is available in Chapter 3 of this document and online at bostonmpo.org/tip. The TIP tables provide details of how funding is allocated to each programmed project and capital investment program. These tables are organized by federal fiscal year and are grouped by highway and transit programs.
The Highway Program of the TIP funds the priority transportation projects advanced by the Massachusetts Department of Transportation (MassDOT) and the cities and towns within the Boston region. The program is devoted primarily to preserving and modernizing the existing roadway network by reconstructing arterial roadways, resurfacing highways, and replacing bridges.
In Massachusetts, Federal-Aid Highway Program funding is apportioned by MassDOT, which allocates funding to Grant Anticipation Notes (GANs) payments, various statewide programs, and Regional Targets for the state’s MPOs. In the FFYs 2026–30 TIP, roadway, bridge, and bicycle and pedestrian programs account for more than $2.56 billion in funding to the Boston region. The Regional Target funding provided to the MPOs may be programmed for projects at the discretion of each MPO, whereas MassDOT has discretion to propose its recommended projects for statewide programs such as those related to bridge repairs and interstate highway maintenance.
The Transit Program of the TIP provides funding for projects and programs that address the capital needs prioritized by the three transit authorities in the region: the Massachusetts Bay Transportation Authority (MBTA), the Cape Ann Transportation Authority (CATA), and the MetroWest Regional Transit Authority (MWRTA). The Transit Program is predominantly dedicated to achieving and maintaining a state of good repair for all assets throughout the transit system.
The FFYs 2026–30 TIP includes $7.75 billion in transit investments by the transit authorities that will support state of good repair, modernize transit systems, and increase access to transit.
During FFYs 2026–30, the Boston Region MPO plans to fund 58 projects with its Regional Target funding. In total, 18 new projects were added to the MPO’s Regional Target Program during this TIP cycle. These 18 projects included seven in the Community Connections program and three in the Transit Transformation program. Ten roadway projects were newly funded in the FFYs 2026–30 TIP Regional Target program, including five design projects, one project previously listed under MassDOT’s Statewide Highway Program, and four construction projects new to the TIP. Details on these projects are available in Table ES-1.
Table ES-1
New Regional Target Projects Funded in the FFYs 2026–30 TIP
| Project Name |
Proponent |
MPO Investment Program |
FFYs of Funding |
Regional Target Dollars Programmed in FFYs 2026–30 |
|||
|---|---|---|---|---|---|---|---|
Acton- Reconstruction of Route 2A/119 (Great Road), from Davis Road to Harris Street (Design Only) |
Acton |
Complete Streets |
2026 |
$860,000 |
|||
Boston- Bluebikes Station Replacement, 20 Stations |
Boston |
Community Connections |
2026 |
$783,860 |
|||
Brookline- Bluebikes Expansion, 3 Stations, 20 eBikes |
Brookline |
Community Connections |
2026 |
$238,846 |
|||
Cambridge- Bluebikes Station Replacement, 7 Stations |
Cambridge |
Community Connections |
2026 |
$223,715 |
|||
Cambridge- New Bridge and Shared-Use Path Connection over Fitchburg Line at Danehy Park Connector (Design Only) |
Cambridge |
Bicycle and Pedestrian |
2026 |
$2,000,000 |
|||
Chelsea- Bluebikes Expansion, 3 Stations, 28 Classic Bikes, 5 eBikes |
Chelsea |
Community Connections |
2026 |
$86,228 |
|||
CTPS- Procurement and Installation of Six Air Quality Sensors for GHG Monitoring (Performance Based Planning Program) |
Regionwide |
Administrative |
2026 |
$43,000 |
|||
Hudson- Bike Path Construction of Mass Central Rail Trail, from Felton Street to Priest Street (Design Only) |
Hudson |
Bicycle and Pedestrian |
2026 |
$909,700 |
|||
Lynnfield- Rail Trail Construction, from Ford Avenue to Nichols Lane (Phase 1) |
Lynnfield |
Bicycle and Pedestrian |
2026 |
$6,062,695 |
|||
Malden- Design of Improvements on Route 60 (Phase 1 and 2), Franklin Street to Lynn Street |
Malden |
Complete Streets |
2026 |
$800,000 |
|||
Marblehead- Installation of 22 Bike Racks |
Marblehead |
Community Connections |
2026 |
$6,250 |
|||
MBTA- Better Bus Project- Operational Safety Improvements at Bus Stops |
Regionwide |
Transit Transformation |
2026 |
$3,216,897 |
|||
MBTA- Bus Priority and Accessibility Improvements |
Regionwide |
Transit Transformation |
2026 |
$6,000,000 |
|||
MBTA- Operational Enhancement of Bus Routes 714 and 716 |
Boston, Canton, Hingham, Hull, Milton |
Transit Transformation |
2026 |
$1,875,000 |
|||
Newton- Installation of 67 Bike Racks, 2 Shelters, 12 RRFBs |
Newton |
Community Connections |
2026 |
$473,132 |
|||
Salem- Broad Street and Dalton Parkway Corridor Project (Design Only) |
Salem |
Complete Streets |
2026 |
$1,068,780 |
|||
Somerville- Bluebikes Station Replacement, 5 Stations |
Somerville |
Community Connections |
2026 |
$107,417 |
|||
CTPS- Project Design Set-Aside |
Regionwide |
Administrative |
2027–30 |
$11,000,000 |
|||
Melrose- Lebanon Street Improvement Project (Lynde Street to Malden City Line) |
Melrose |
Complete Streets |
2030 |
$10,528,000 |
|||
Total |
N/A |
N/A |
N/A |
$44,071,696 |
|
||
Note: Funding amounts in this table include both federal and non-federal funds, including matching funds.
CTPS = Central Transportation Planning Staff. FFY = federal fiscal year. GHG = greenhouse gas. MassDOT = Massachusetts Department of Transportation. MBTA = Massachusetts Bay Transportation Authority. MPO = metropolitan planning organization. N/A = not applicable. RRFB = rectangular rapid flashing beacon. TIP = Transportation Improvement Program.
Source: Boston Region MPO.
The signing of the Bipartisan Infrastructure Law (BIL), on November 15, 2021, increased the amount of Regional Target funding available to the Boston Region MPO in the FFYs 2024–28 TIP cycle by approximately nine percent from the funding levels in the FFYs 2023–27 TIP. This funding level was sustained in the development of the FFYs 2025–29 and FFYs 2026–30 TIPs.
During the development of the FFYs 2026–30 TIP, the MPO had significant amounts of funding available to program in FFYs 2026 and 2030. However, there were significant shortfalls of funding in FFYs 2027, 2028, and 2029 as a result of delayed programming of nine projects and substantial cost increases.
Another three projects programmed for FFY 2025 were delayed until FFY 2026 as part of both the development of the FFYs 2026–30 TIP and an accompanying Amendment 10 to the FFYs 2025–29 TIP. The unprogrammed balance in FFY 2025 was addressed through Amendment 10 by adding the following nine transit projects that originally had applied to MPO staff for FFY 2026 funding:
For FFY 2026, no programmed projects could be accelerated to utilize the balance; so, the MPO worked with former proponents from the FFY 2025 Project Design Pilot, regional transit authorities, the MBTA and MassDOT to identify projects that could be funded. The MPO selected 15 projects for funding in FFYs 2026.
Five of these projects were selected for design funding:
Seven projects were funded through the Community Connections program:
Three projects were selected through the Transit Transformation program:
Lastly, the MPO funded the initial phase of the construction of the Lynnfield Rail Trail from Ford Avenue to Nichols Lane in FFY 2026 for $6,062,695. This project was previously programmed in the FFY 2029 Statewide Highway Program, with phasing of the project enabling acceleration of one component to FFY 2026.
Unlike in prior TIPs, where projects were often identified later in the project evaluation life cycle and could not be scored in time for programming scenarios, MPO staff worked closely with project proponents to ensure that the majority of these projects were evaluated using the MPO’s scoring criteria. While a small number of these projects could not be scored in time, a qualitative assessment showed that they align well with MPO goals, including enhancing connectivity between regional trails and improving the state of good repair for the regional transit system.
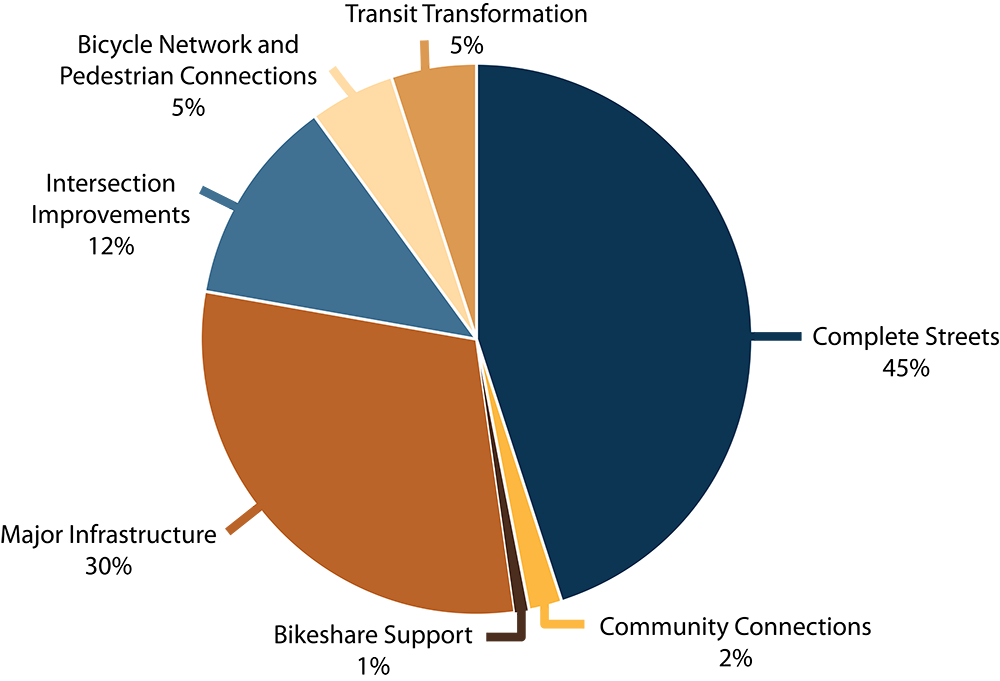
Figure ES-1 shows how the Regional Target funding for FFYs 2026–30 is distributed across the MPO’s investment programs. As the chart shows, the Boston Region MPO’s Regional Target Program is devoted primarily to enhancing mobility and safety for all travel modes through significant investments in Complete Streets projects. A large portion of the MPO’s funding also supports the modernization of key regional roadways and transit infrastructure through investments in Major Infrastructure and Transit Transformation projects. The MPO also elected to leave approximately $44.82 million unprogrammed.
Figure ES-1
FFYs 2026–30 TIP Regional Target Funding by MPO Investment Program
.png "Pie Chart.")
FFY = federal fiscal year. MPO = metropolitan planning organization. TIP = Transportation Improvement Program.
Source: Boston Region MPO.
As noted in Figure ES-1, the MPO has programmed more than 94 percent of its available funding over five years. Table ES-2 further details the number of projects and the allocation of funds across each program in the FFYs 2026–30 TIP. More details about every project funded through the MPO’s Regional Target Program are available in Chapter 3.
Table ES-2
FFYs 2026–30 Boston Region MPO Regional Target Investment Summary
MPO Investment Program |
Number of Projects |
Regional Target Dollars Programmed |
Bicycle Network and Pedestrian Connections |
8 |
$80,376,280 |
Community Connections (allocated to projects) |
9 |
$2,995,833 |
Community Connections (not yet allocated to projects)* |
2 |
$17,036,193 |
Complete Streets |
23 |
$328,605,870 |
Intersection Improvements |
3 |
$12,550,882 |
Major Infrastructure—Roadway |
5 |
$226,071,909 |
Transit Transformation (allocated to projects) |
5 |
$12,591,897 |
Transit Transformation (not yet allocated to projects) |
1 |
$19,500,000 |
Administrative |
2 |
$11,043,000 |
Unprogrammed |
N/A |
$43,376,331 |
Total |
58 |
$754,169,752 |
Note: Funding amounts in this table include both federal and non-federal funds, including matching funds.
* This figure includes $8 million in BikeShare Support funding.
FFY = federal fiscal year. MPO = metropolitan planning organization. N/A = not applicable.
Source: Boston Region MPO.
When making decisions about which projects to fund, the MPO considers how the allocation of funds to each investment program compares to the funding goals outlined in the MPO’s current Long-Range Transportation Plan (LRTP), Destination 2050. The funding goals for investment programs set forth in the LRTP reflect the types and mix of projects the MPO seeks to fund to help it achieve its goals and objectives for the region, from enhancing safety for all users to promoting mobility and accessibility across the region. More information on the MPO’s goals and objectives is available in Chapter 1, and a comparison between LRTP investment program goals and program funding levels in the FFYs 2026–30 TIP is shown in Figure ES-2.
Figure ES-2
FFYs 2026–30 TIP: Regional Target Funding Levels Relative to LRTP Investment Program Goals

FFY = federal fiscal year. LRTP = Long-Range Transportation Plan. TIP = Transportation Improvement Program.
Source: Boston Region MPO.
The investments made in the FFYs 2026–30 TIP will be implemented in 36 cities and towns throughout the Boston region. Figure ES-3 illustrates the distribution of Regional Target funding among the eight subregions within the Boston Region MPO’s jurisdiction, as defined by the Metropolitan Area Planning Council (MAPC). This figure also shows how the distribution of funds compares to key metrics for measuring the need for funding by subregion, including the percent of regional population, employment, and Federal-Aid roadway miles within each subregion.
Figure ES-3
FFYs 2026–30 TIP: Regional Target Funding Levels Relative to Key Indicators

Note: Unprogrammed funds and funds held for the MPO’s Transit Transformation and Community Connections programs are not included in this figure.
FFY = federal fiscal year. MAGIC = Minuteman Advisory Group on Interlocal Coordination. MAPC = Metropolitan Area Planning Council. MetroWest = MetroWest Regional Collaborative. NSPC = North Suburban Planning Council. NSTF = North Shore Task Force. SSC = South Shore Coalition. SWAP = South West Advisory Committee. TIP = Transportation Improvement Program. TRIC = Three Rivers Interlocal Council.
Source: Boston Region MPO.
Additional information on the geographic distribution of Regional Target funding across the region, including a breakdown of funding by municipality, is included in Appendix D.
The TIP Highway Program was developed with the assumption that funding for Massachusetts from the Federal-Aid Highway Program would range between $858 million and $918 million annually over the next five years. These figures do not include matching funds provided for projects by the state or local entities. With the addition of matching funds, approximately $1.07 billion to $1.15 billion was available statewide for projects in FFYs 2026–30.
The process of determining the MPO’s share of this federal funding for the Boston region follows several steps. First, MassDOT reserves funding for GANs debt service payments for the Accelerated Bridge Program; these payments are expected to conclude in FFY 2026. Then, the remaining Federal-Aid Highway Program funds are budgeted to support state and regional (i.e., MPO) priorities. The funding for regional priorities is referred to as Regional Target funds.
The remaining Federal-Aid Highway Program funds are budgeted to support state and regional (i.e., MPO) priorities. MassDOT customarily provides the local match (which can also be provided by other entities). Projects are typically funded with 80 percent federal dollars and 20 percent state dollars, but the share may vary depending on the funding program. Costs for project design are often borne by the proponent of the project, though the Boston Region MPO has allocated Regional Target funds for design support in the FFYs 2025–29 and FFYs 2026–30 TIPs.
Next, MassDOT allocates funding across the following funding categories:
Finally, MassDOT allocates the remaining funding among the state’s 13 MPOs for programming. This discretionary funding for MPOs is suballocated by formula to determine the Regional Target amounts. The Boston Region MPO receives the largest portion of MPO funding in the state, with approximately 43 percent of Massachusetts’ Regional Target funds allocated to the region. MassDOT develops these targets in consultation with the Massachusetts Association of Regional Planning Agencies (MARPA). This TIP was programmed with the assumption that the Boston Region MPO will have between $125 million and $161 million annually for Regional Target amounts, which consist of federal funding and state funding for the local match.
Each MPO may decide how to prioritize its Regional Target funding. Given that the Regional Target funding is a subset of the Highway Program, the MPO typically programs the majority of funding for roadway projects; however, the MPO has flexed portions of its highway funding to the Transit Program for transit expansion projects and through its Transit Transformation and Community Connections programs. The TIP Highway Program details the projects that will receive Regional Target funding from the Boston Region MPO and statewide infrastructure projects within the Boston region. Details on these investments are outlined in Chapter 3.
The Federal Transit Administration (FTA) allocates the funds programmed in the TIP Transit Program according to formula. The three regional transit authorities in the Boston Region MPO area that are recipients of these funds are the MBTA, CATA, and MWRTA. The MBTA, with its extensive transit program and infrastructure, is the recipient of the preponderance of the region’s federal transit funds.
The current federal transportation legislation, the BIL, allocates funding to transit projects through the following formula programs:
When determining which projects to fund through the Regional Target funding process, MPO members collaborate with municipalities, state agencies, members of the public, advocacy groups, and other stakeholders. The MPO board uses evaluation criteria in its project selection process to help identify and prioritize projects that advance progress across the MPO’s six goal areas:
More information on the MPO’s goal areas can be found on the Destination 2050 web page:bostonmpo.org/lrtp.
As shown in Figure ES-1 and Table ES-2, the MPO has established investment programs designed to direct Regional Target funding towards MPO priority areas during the next 20 years.:
Projects that the MPO selects to receive Regional Target funding through the TIP development process are included in one of the six investment programs listed above. More information about the MPO’s investment programs are available in Chapter 2.
The MPO incorporates performance-based planning and programming (PBPP) practices into its TIP development and other processes. These practices are designed to help direct MPO funds towards achieving specific and measurable outcomes for the transportation system. MPO investments directly relate to the PBPP framework and further the MPO’s goals and performance targets. With the development of the FFYs 2026-30 TIP, the MPO leveraged funding availability across all fiscal years to program new projects to address transit system reliability, traffic safety for all users, NHS bridge condition, and other priorities. The MPO will continue to closely link its performance targets, investment decisions, and monitoring and evaluation activities. More information on PBPP is available in Chapter 4 and Appendix A (Table A-2).
The outreach process begins early in the federal fiscal year. Cities and towns designate TIP contacts and begin developing a list of priority projects to be considered for federal funding, and the MPO staff asks the staff of cities and towns in the region to identify their priority projects. MPO staff compiles the project funding requests into a Universe of Projects, which is a list of all projects identified as potential candidates to receive funding through the TIP.
Priority projects from regional transit authorities and the MBTA are typically identified as part of the authorities’ annual program development process. The MPO staff accepts applications for Transit Transformation funding in the fall. Projects that MPO staff receive applications for, that are not funded through the TIP or the Capital Investment Plan, may be added to the Universe of Projects.
The Universe includes projects at varying levels of readiness, from those with significant engineering and design work complete to those still early in the conceptual or planning stage. MPO staff collects data on each project in the Universe so that the projects may be evaluated.
MPO staff evaluates projects based on how well they address the MPO’s goals. For MPO staff to conduct a complete project evaluation, projects eligible for Bicycle Network and Pedestrian Connections, Complete Streets, Intersection Improvements, and Major Infrastructure program funding must have a functional design report or the project plans must include the level of detail defined in a functional design report, a threshold typically reached when a project nears the 25 percent design stage. To complete an evaluation for projects under consideration through the MPO’s Community Connections program, project proponents must submit a completed application to MPO staff.
In response to significant cost increases in recent TIP cycles for projects already programmed for funding, the MPO board created a committee in the wake of the FFYs 2022–26 TIP cycle to further explore the causes of project cost increases and devise MPO policy changes to support more reliable project delivery. The TIP Project Cost Ad Hoc Committee began its work in June 2021 and advanced a set of policy recommendations to the full MPO board in September 2021. These changes were formally adopted by the MPO on November 4, 2021, and were in effect for the development of the FFYs 2026–30 TIP.
Among other changes, the MPO elected to codify its policy of requiring that project proponents submit 25 percent designs and obtain an updated cost estimate for their projects prior to being programmed in the TIP. Given persistent project readiness issues witnessed across multiple TIP development cycles, the MPO formed a new committee, the TIP Process, Engagement, and Readiness Committee, which recommended full enforcement during the development of the FFYs 2027–31 TIP. This committee will review additional or revised policies to complement the new policy.
The evaluation results for all projects are presented to the MPO board members for their consideration for programming in the TIP. Draft scores are shared directly with project proponents, at which point proponents are encouraged to review the scores and provide feedback so that MPO staff may make any warranted adjustments to arrive at appropriate final results. Once the review process is complete, final scoring results are posted on the MPO’s website where MPO members, municipal officials, and members of the public may review them.
An important step toward TIP programming takes place midway through the TIP development cycle at a meeting—referred to as TIP Readiness Day—that both MassDOT and MPO staff attend. At this meeting, MassDOT project managers provide updates about cost and schedule changes related to currently programmed projects. These cost and schedule changes must be taken into account as MPO staff helps the MPO board consider updates to the already programmed years of the TIP and the addition of new projects in the outermost year of the TIP.
Among the other new policies advanced by the TIP Project Cost Ad Hoc Committee, the MPO board adopted a policy requiring proponents of projects that experienced a cost increase of 25 percent or more (for projects costing less than $10 million) or $2.5 million or more (for projects costing more than $10 million) to present to the MPO board on the reasons for these cost increases. The MPO would then compare these projects—at the new costs—to other projects and consider this cost-effectiveness evaluation when deciding whether or not to fund the projects at the higher costs. These cost changes are most often revealed through conversations between MassDOT staff and MPO staff during TIP Readiness Day, making this new policy especially relevant at this stage of TIP development.
Using the evaluation results and information about project readiness (i.e., the extent to which a project is fully designed and ready for construction), MPO staff prepares a recommendation or a series of programming scenarios for how to program the Regional Target funding in the TIP. Other considerations, such as whether a project was included in the LRTP, addresses an identified transportation need, or promotes the distribution of transportation investments across the region, are also incorporated into these programming scenarios. The staff recommendation is always financially constrained—meaning, subject to available funding. There was approximately $754 million of Regional Target funding available to the Boston Region MPO for FFYs 2026–30. In this TIP cycle, the MPO board members discussed several scenarios for the Regional Target Program and selected a preferred program in April 2025.
In addition to prioritizing the Regional Target funding, the MPO board reviews and endorses the statewide highway program that MassDOT recommends for programming. The board also reviews and endorses programming of funds for the MBTA’s, CATA’s, and MWRTA’s transit capital programs.
After selecting a preferred programming scenario, usually in April, the MPO board votes to release the draft TIP for a 30-day public review period. The comment period typically begins in late April, and during this time the MPO invites members of the public, municipal officials, and other stakeholders in the Boston region to review the proposed program and submit feedback. During the public review period, MPO staff hosts public meetings to discuss the draft TIP document and elicit additional comments.
After the public review period ends, the MPO board reviews all municipal and public comments and may change elements of the document or its programming. The MPO board then endorses the TIP and submits it to the Federal Highway Administration (FHWA) and the Federal Transit Administration (FTA) for approval. MassDOT incorporates the MPO-endorsed TIP into the State Transportation Improvement Program (STIP). The FHWA, FTA, and United States Environmental Protection Agency review the STIP for certification by September 30, the close of the federal fiscal year.
Even after the TIP has been finalized, administrative modifications, amendments, and adjustments often must be introduced because of changes in project schedules, project costs, funding sources, or available revenues. This may necessitate reprogramming a project in a different funding year or programming additional funds for a project.
Notices of administrative modifications and amendments are posted on the MPO’s website. If an amendment is necessary, the MPO notifies affected municipalities, stakeholders, and members of the public via email. The MPO typically holds a 21-day public review period before taking final action on an amendment. In extraordinary circumstances, the MPO may vote to shorten the public comment period to a minimum of 15 days. Administrative modifications and adjustments are minor and usually do not warrant a public review period.
Public engagement is an important aspect of the transportation planning process. Please visit bostonmpo.org for more information about the MPO, to view the entire TIP, and to submit your comments. You also may wish to sign up for email news updates and notices by visiting bostonmpo.org/subscribe and submitting your contact information. To request a copy of the TIP in accessible formats, please contact the MPO staff by any of the following means:
Mail: Boston Region MPO c/o CTPS MPO Activities Group, 10 Park Plaza, Suite 2150, Boston, MA 02116-3968
Telephone: 857.702.3700 (voice)
For people with hearing or speaking difficulties, connect through the state MassRelay service:
Email: publicinfo@ctps.org
Translations of the Executive Summary of the FFYs 2026–30 TIP are also available:
Metropolitan Planning Organizations (MPO) were first given the authority to approve the use of federal funds for transportation planning and capital projects in a region through 1970s federal legislation. MPOs are established based on an agreement between the governor of a state and at least 75 percent of the local representation in a metropolitan area (typically representation through local elected officials) to provide a forum that engages state, regional, and local stakeholders in the transportation planning process. Each metropolitan area in the United States with a population of 50,000 or more is required by federal legislation to have an MPO.
MPOs establish regional transportation visions that are the overarching framework for the decision-making about how to allocate federal transportation funds in a metropolitan area. This vision is based on the input and needs of the full range of stakeholders in a region, including elected officials, municipal planners and engineers, transportation advocates, and residents.
The Boston Region MPO is the designated MPO for the 97 municipalities in eastern Massachusetts that comprise the MPO’s planning area. The Boston Region MPO develops plans for funding transportation projects and programs; maintains transportation models and data resources to support studies, system performance monitoring, and air quality determinations; and conducts an ongoing public engagement process.
The federal government regulates the funding, planning, and operation of the surface transportation system through the federal transportation program, which was enacted into law through Titles 23 and 49 of the United States Code Section 134 of Title 23 of the Federal Aid Highway Act, as amended, and Section 5303 of Title 49 of the Federal Transit Act, as amended.
The most recent reauthorization of the federal surface transportation law is the Bipartisan Infrastructure Law (BIL). The BIL sets policies related to metropolitan transportation planning and requires that all MPOs carry out a continuing, comprehensive, and cooperative (3C) transportation planning process. This process must result in plans and programs that support metropolitan community development and social goals and lead to the development and operation of an integrated, intermodal transportation system that facilitates the efficient, economic movement of people and goods.
The Boston Region MPO, which is responsible for carrying out the 3C planning process in the Boston region, has established the following objectives for the process:
More information about the federal, state, and regional guidance governing the transportation planning process, and about the regulatory framework in which the MPO operates can be found in Appendix E.
The Boston Region MPO’s planning area extends across 97 cities and towns from Boston north to Ipswich, south to Marshfield, and west to Interstate 495.
Figure 1-1 shows the map of the Boston Region MPO’s member municipalities.
Figure 1-1
Municipalities in the Boston Region

MPO decision-making is carried out by a board comprising 23 voting members, supported by staff work. Several state agencies, regional organizations, and the City of Boston are permanent voting members, while 12 municipalities are elected as voting members for three-year terms. Eight municipal members represent each of the eight subregions of the Boston region, and there are four at-large municipal seats. The Federal Highway Administration (FHWA) and Federal Transit Administration (FTA) participate on the MPO board as advisory (nonvoting) members. More details about the MPO’s permanent members can be found in Appendix F.
Figure 1-2 shows Boston Region MPO membership.
Figure 1-2
Boston Region MPO Membership
.png)
The Boston Region MPO staff is comprised of transportation planners, data analysts, data scientists, engagement and communications experts, graphic designers, editors, and administrative support staff. The MPO also employs part-time data collectors to support its planning work. These staff are organized into a number of teams that reflect the type of planning work that the agency does.
Figure 1-3 shows the organization of the Central Transportation Planning Staff, which serves as staff to the Boston Region MPO.
Figure 1-3
Boston Region MPO Organizational Chart
.png)
The following paragraph is the MPO’s vision statement, as adopted in Destination 2050, the MPO’s current Long-Range Transportation Plan (LRTP), which was adopted in July 2023:
The Boston Region Metropolitan Planning Organization envisions an equitable, pollution-free, and modern regional transportation system that gets people to their destinations safely, easily, and reliably, and that supports an inclusive, resilient, healthy, and economically vibrant Boston Region.
When developing this vision statement, the MPO members considered the significant public input received during the drafting of the Needs Assessment for Destination 2050.
More information on the MPO’s vision, goals, and objectives for the transportation system resulting from the long-range plan development process is available in Figure 1-4.
Figure 1-4
LRTP Goals and Objective
| GOALS | OBJECTIVES |
| EQUITY | blank |
| Facilitate an inclusive and transparent transportation-planning process and make investments that eliminate transportation-related disparities borne by people in disadvantaged communities. | • Facilitate an inclusive and transparent engagement process with a focus on involving people in disadvantaged communities.* • Ensure that people have meaningful opportunities to share needs and priorities in a way that influences MPO decisions. • Eliminate harmful environmental, health, and safety effects of the transportation system on people in disadvantaged communities. • Invest in high-quality transportation options in disadvantaged communities to fully meet residents’ transportation needs. * Disadvantaged communities are those in which a significant portion of the population identifies as an MPO equity population—people who identify as minority, have limited English proficiency, are 75 years old or older or 17 years old or younger, or have a disability—or has low income. |
| SAFETY | blank |
| Achieve zero transportation-related fatalities and serious injuries and improve safety for all users of the transportation system. | • Eliminate fatalities, injuries, and safety incidents experienced by people who walk, bike, roll, use assistive mobility devices, travel by car, or take transit. • Prioritize investments that improve safety for the most vulnerable roadway users: people who walk, bike, roll, or use assistive mobility devices. • Prioritize investments that eliminate disparities in safety outcomes for people in disadvantaged communities. |
| MOBILITY AND RELIABILITY | blank |
| Support easy and reliable movement of people and freight. | • Enable people and goods to travel reliably on the region’s transit and roadway networks. • Prioritize investments that address disparities in transit reliability and frequency for people in disadvantaged communities. • Reduce delay on the region’s roadway network, emphasizing solutions that reduce single-occupancy-vehicle trips, such as travel demand management. • Prioritize investments that reduce delay on the region’s transit network. • Support reliable, safe travel by keeping roadways, bridges, transit assets, and other infrastructure in a state of good repair, and prioritize these investments in disadvantaged communities. • Modernize transit systems and roadway facilities, including by incorporating new technology that supports the MPO’s goals, such as electric-vehicle technologies. |
| ACCESS AND CONNECTIVITY | blank |
| Provide transportation options and improve access to key destinations to support economic vitality and high quality of life. | • Improve multimodal access to jobs, affordable housing, essential services, education, logistics sites, open space, and other key destinations. • Prioritizing transportation investments that support the region’s and the Commonwealth’s goals for housing production, land use, and economic growth. • Increase people’s access to transit, biking, walking, and other non-single-occupancy-vehicle transportation options to expand their travel choices and opportunities. • Prioritize investments that improve access to high quality, frequent transportation options that enable people in disadvantaged communities to easily get where they want to go. • Close gaps in walking, biking, and transit networks and support interorganizational coordination for seamless travel. • Remove barriers to make it easy for people of all abilities to use the transportation system, regardless of whether they walk, bike, roll, use assistive mobility devices, or take transit. |
| RESILIENCY | blank |
| Provide transportation that supports sustainable environments and enables people to respond and adapt to climate change and other changing conditions. | • Prioritize investments to make the region’s roadway and transit infrastructure more resilient and responsive to current and future climate hazards, particularly within areas vulnerable to increased heat and precipitation, extreme storms, winter weather, and sea level rise. • Prioritize resiliency investments in disadvantaged communities and in areas that bear disproportionate climate and environmental burdens. • Prioritize investments in transportation resiliency that improve emergency access and protect evacuation routes. • Prioritize investments that include nature-based strategies such as low-impact design, pavement reduction, and landscape buffers to reduce runoff and negative impacts to water resources, open space, and environmentally sensitive areas. |
| CLEAN AIR AND HEALTHY COMMUNITIES | blank |
| Provide transportation free of greenhouse gas emissions and air pollutants and that supports good health. | • Reduce transportation-related greenhouse gases, other air pollutants, and growth in vehicle-miles traveled by encouraging people and goods to move by non-single-occupancy-vehicle modes. • Support transit vehicle electrification and use of electric vehicles throughout the transportation system to reduce greenhouse gases and other air pollutants. • Prioritize investments that address air pollution and environmental burdens experienced by disadvantaged and vulnerable communities. • Support public health through investments in transit and active transportation options and by improving access to outdoor space and healthcare. |
Source: Boston Region Metropolitan Planning Organization.
As part of its 3C process, the Boston Region MPO produces the Transportation Improvement Program (TIP) and the Unified Planning Work Program (UPWP) annually, and the LRTP every four years. These documents, referred to as certification documents, are required for the federal government to certify the MPO’s planning process. This federal certification is a prerequisite for the MPO to receive federal transportation funds. A robust public engagement process accompanies the development of each certification document.
The LRTP guides decision-making on investments that will be made in the Boston region’s transportation system over the next two decades. It defines an overarching vision of the future of transportation in the region, establishes goals and objectives that will lead to achieving that vision, and allocates projected revenue to transportation projects and programs consistent with the established goals and objectives.
Destination 2050, the current LRTP, was endorsed by the MPO board in July 2023 and took effect on October 1, 2023.
The TIP is a multimodal program of transportation improvements, consistent with the LRTP, that describes and prioritizes transportation projects that are expected to be implemented during a five-year period. The types of transportation projects funded include major highway reconstruction and maintenance, arterial and intersection improvements, public transit expansion and maintenance, paths and other facilities designated for people walking, biking, and rolling, and first- and last-mile connections to transit or other key destinations.
The TIP contains a financial plan that shows the current or proposed revenue sources for each project.
An MPO-endorsed TIP is incorporated into the State Transportation Improvement Program (STIP) for submission to the FHWA, FTA, United States Environmental Protection Agency, and the Massachusetts Department of Environmental Protection for approval. Investments programmed in the TIP and STIP are also reflected in Massachusetts Department of Transportation’s (MassDOT) Capital Investment Plan, which shows capital expenditures in the state over a five-year period.
The UPWP describes the transportation planning work that will be conducted by MPO staff during the course of a federal fiscal year, which runs from October 1 through September 30. The document includes ongoing planning work as it will be advanced in the federal fiscal year, supportive planning activities undertaken by MPO staff to enable that work, such as information technology management, and discrete, single-year initiatives all as approved by the MPO Board. The UPWP also describes work undertaken by MPO staff with partner agencies or to carry out grant-funded activities.
The UPWP documents the collaborative metropolitan transportation planning process by describing all regionally significant, federally funded transportation planning work in the region. This information, incorporated into the appendix of the document, includes work carried out by Metropolitan Area Planning Council (MAPC), Massachusetts Department of Transportation (MassDOT), Massachusetts Bay Transportation Authority (MBTA), MetroWest Regional Transit Authority (MWRTA), Cape Ann Transportation Authority (CATA), and municipalities and other partners in the Boston Region.
The three certification documents are intrinsically interconnected. The Long-Range Plan sets the vision, goals, and objectives framework to guide the ongoing work of the MPO captured in the UPWP and the investment decisions programmed in the TIP. Much of the planning work included in the UPWP is a means to study transportation issues and alternatives before advancing to further design, construction, and possible future programming through the TIP. Finally, performance-based planning processes ensure that the MPO’s planning and capital investments are resulting in progress towards the MPO’s goals.
Figure 1-5 depicts the relationship between the three certification documents and the MPO’s performance-based planning and programming process.
Figure 1-5
Relationship between the LRTP, TIP, UPWP, and
Performance-Based Planning Process

Transportation improvements are part of the solution to many critical regional, state, national, and even global problems, such as traffic congestion, air quality, fatalities and injuries on roadways, and environmental degradation. Therefore, one of the most important decisions a metropolitan planning organization (MPO) faces is deciding how to allocate limited funds for transportation projects and programs. Because there is insufficient funding available for all projects that would address these problems, an MPO’s investment choices must be guided by policies that help identify the most viable and effective solutions.
The Boston Region MPO is guided by the policies in its Long-Range Transportation Plan (LRTP) and the MPO develops a Transportation Improvement Program (TIP) to prioritize the expenditure of federal funds on transportation projects. The MPO staff manages the development of both plans.
During the annual development process for the TIP, the MPO staff supports the MPO board by evaluating project funding requests from municipalities and state transportation agencies. The staff proposes a range of alternative scenarios for the programming of new and ongoing projects based on anticipated yearly funding levels, and staff works with the board to create a draft TIP document. The staff also facilitates a public engagement process that affords the public an opportunity to comment on proposed projects and review the draft TIP before the MPO board endorses the final document.
The first step in allocating federal transportation funds is the passage by the United States Congress of a multiyear act that establishes a maximum level of federal transportation funding per federal fiscal year (FFY). The establishment of this level of funding is referred to as an authorization. The most recent authorization act, the Bipartisan Infrastructure Law (BIL), was signed into law on November 15, 2021. The BIL governed the development of the FFYs 2026–30 TIP by establishing new formula funding levels, reauthorizing existing discretionary grant programs and creating new ones, and setting policy priorities. (More information on the impacts of the BIL on the development of the FFYs 2026–30 TIP is available throughout this report. Specific guidance on new BIL Planning Emphasis Areas is available in Appendix E.)
After the authorization level has been established, the United States Department of Transportation annually allocates funding among the states according to various federal formulas. This allocation is referred to as an apportionment. The annual apportionment rarely represents the actual amount of federal funds that are ultimately committed to a state because of federally imposed limitations on spending in a given fiscal year, referred to as the obligation authority. In Massachusetts, TIPs are developed based on the estimated obligation authority.
The TIP Highway Program was developed with the assumption that funding for Massachusetts from the Federal-Aid Highway Program would range between $858 million and $918 million annually over the next five years. These figures do not include matching funds provided for projects by the state or local entities. Projects are typically funded with 80 percent federal dollars and 20 percent state dollars, but the share may vary depending on the funding program. Costs for project design are often borne by the proponent of the project. With the addition of matching funds, approximately $1.07 billion to $1.15 billion was available statewide for projects in FFYs 2026–30.
The process of determining the MPO’s share of this federal funding for the Boston region followed several steps. First, the Massachusetts Department of Transportation (MassDOT) reserved funding for Grant Anticipation Notes (GANs) debt service payments for the Accelerated Bridge Program; these payments are expected to conclude in FFY 2026. Then, the remaining Federal-Aid Highway Program funds were budgeted to support state and regional (i.e., MPO) priorities. The funding for regional priorities is referred to as Regional Target funds.
The Regional Targetsare discretionary funds for MPOs, suballocated by formula to each metropolitan planning region. The Boston Region MPO receives about 43 percent of the total funds available statewide for Regional Targets. MassDOT developed the target formula for determining this distribution of funds in consultation with the Massachusetts Association of Regional Planning Agencies (MARPA).
Each MPO in the state can decide how to prioritize its Regional Target funding. The Boston Region MPO does this by engaging its 97 cities and towns in an annual TIP development process. Given that the Regional Target funding originates from the Federal-Aid Highway Program, the Boston Region MPO board typically programs the majority of its target funding on roadway projects; however, the MPO board has flexed portions of its TIP Highway Program funding to the TIP’s Transit Program, most notably when the MPO board provided funding in support of the Green Line Extension transit expansion project.
In addition, this FFYs 2026–30 TIP includes an annual allotment of funding to the MPO’s Transit Transformation program. This commitment to flex Federal-Aid Highway funds to transit projects on a yearly basis is an affirmation of the MPO’s goals to meaningfully support multimodal transportation options. More information on the MPO’s investment strategy is discussed later in this chapter.
During the next five years, the Boston Region MPO’s total Regional Target funding will be approximately $754.2 million, an average of $150.83 million per year. The MPO’s Regional Target funds increased 3.6 percent per year in the FFYs 2026–30 TIP relative to the levels planned for in the development of the FFYs 2025–29 TIP. The continued absence of GANs funding in FFY 2030 drove this increase. Funding levels in FFYs 2026 through 2030 remain largely the same from the previous TIP outside of small adjustments made as a result of population changes for the MARPA formula.
The Federal-Aid Highway Program dollars discussed in this chapter are delivered through several Federal Highway Administration (FHWA) funding programs, each of which has unique requirements. Table 2-1 lists the programs in the BIL that fund projects in the FFYs 2026–30 TIP.
Table 2-1
Federal Highway Administration Programs Applicable to the FFYs 2026–30 Transportation Improvement Program
Bipartisan Infrastructure Law Program |
Eligible Uses |
Bridge Formula Program (BFP) |
Efforts to replace, rehabilitate, preserve, protect, and construct highway bridges |
Carbon Reduction Program (CARBON) |
Projects that reduce transportation emissions or develop carbon reduction strategies. |
Congestion Mitigation and Air Quality Improvement (CMAQ) |
A wide range of projects to reduce congestion and improve air quality in nonattainment and maintenance areas for ozone, carbon monoxide, and particulate matter |
Highway Safety Improvement Program (HSIP) |
Implementation of infrastructure-related highway safety improvements |
Metropolitan Planning |
Facilities that contribute to an intermodal transportation system, including intercity bus, pedestrian, and bicycle facilities |
National Electric Vehicle Infrastructure (NEVI) Program |
Projects that support the strategic deployment of electric vehicle (EV) charging infrastructure and establish an interconnected EV network to facilitate data collection, access, and reliability |
National Highway Freight Program (NHFP) |
Projects that improve the efficient movement of freight on the National Highway Freight Network |
National Highway Performance Program (NHPP) |
Improvements to interstate routes, major urban and rural arterials, connectors to major intermodal facilities, and the national defense network; replacement or rehabilitation of any public bridge; and resurfacing, restoring, and rehabilitating routes on the Interstate Highway System |
Promoting Resilient Operations for Transformative, Efficient, and Cost-saving Transportation Program (PROTECT) |
Resiliency improvements, including improvements to community resilience and evacuation routes, and at risk coastal infrastructure. Highway, transit, and port projects are also eligible. |
Surface Transportation Block Grant Program (STBGP) |
A broad range of surface transportation capital needs, including roads; transit, sea, and airport access; and vanpool, bicycle, and pedestrian facilities |
Transportation Alternatives Program (TAP) |
A set-aside from the STBGP that funds the construction of infrastructure-related projects (for example, sidewalk, crossing, and on-road bicycle facility improvements) |
Source: Federal Highway Administration.
Federal aid for public transit authorities is allocated by formula to urbanized areas (UZAs). MassDOT is the recipient of this federal aid in the Boston MA-NH-RI UZA. In UZAs with populations greater than 200,000, such as the Boston MA-NH-RI UZA, the distribution formula factors in passenger-miles traveled, population density, and other factors associated with each transit provider. The three regional transit authorities (RTAs) in the Boston Region MPO area are the Massachusetts Bay Transportation Authority (MBTA), MetroWest Regional Transit Authority (MWRTA), and Cape Ann Transportation Authority (CATA). The MBTA, with its extensive transit program and infrastructure, is the recipient of the preponderance of federal transit funds in the region.
The Federal Transit Administration (FTA) distributes funding to transit agencies through several different programs. As previously noted, the MPO converts some of its FHWA funding to FTA to support transit investments. Table 2-2 shows FTA programs in the BIL that support transit investments in the FFYs 2026–30 TIP.
Table 2-2
Federal Transit Administration Programs Applicable to the FFYs 2026–30 Transportation Improvement Program
Bipartisan Infrastructure Law Program |
Eligible Uses |
Urbanized Area Formula Grants (Section 5307) |
Transit capital and operating assistance in urbanized areas |
Fixed Guideway/Bus (Section 5337) |
Replacement, rehabilitation, and other state-of-good-repair capital projects |
Bus and Bus Facilities (Section 5339) |
Capital projects to replace, rehabilitate, and purchase buses and related equipment, and to construct bus-related facilities |
Enhanced Mobility of Seniors and Individuals with Disabilities (Section 5310) |
Capital expenses that support transportation to meet the special needs of older adults and persons with disabilities |
Fixed-Guideway Capital Investment Grants (Section 5309) |
Grants for new and expanded rail, bus rapid transit, and ferry systems that reflect local priorities to improve transportation options in key corridors |
Source: Federal Transit Administration.
Each MPO in the state prioritizes the Regional Target funding it receives through the processes established by FHWA and MassDOT. The Boston Region MPO’s LRTP defines the investment framework that informs the specific investment decisions made in the TIP by establishing
The MPO’s goals and objectives provide the foundation for the evaluation criteria that the MPO board uses when selecting transportation projects to be funded with Regional Target dollars. MPO staff compares candidate projects’ characteristics to these criteria to evaluate whether individual projects can help the MPO advance its various goals. The criteria used to select projects for this TIP are based on the MPO’s goals and objectives, adopted as part of Destination 2050, which is the LRTP the MPO endorsed in July 2023. Chapter 1 lists these goals and objectives.
In Destination 2050 and the prior LRTP, Destination 2040, the MPO strengthened the link between its spending and improvements to transportation performance by revising its investment programs to include a broader range of prospective projects. These investment programs focus on specific types of projects that the MPO expects will help achieve its goals and objectives for the transportation system. The MPO created these programs to give municipalities the confidence that if they design these types of projects, the MPO will be willing to fund them through the TIP:
The MPO has taken a clear stance that investing in transit is central to improving the region’s broader transportation system. The MPO established the Transit Modernization program in Destination 2040, which became the Transit Transformation program in Destination 2050. The Transit Transformation program represents a significant shift in the MPO’s investment strategy as funding will be allocated to transit projects on an annual basis. In prior years, the MPO only funded transit projects on a one-off basis when funding was requested for specific projects in the region. By creating the programming infrastructure to reallocate Regional Target highway funds to transit projects annually, the Boston Region MPO has established itself as a leader among MPOs nationally by crafting an investment strategy that is truly multimodal.
The MPO continued to fund multiple Transit Transformation projects in FFY 2026 to make use of funding surpluses. The MPO has also continued to reserve funding for allocation in future TIP years. The MPO will continue to work with municipalities and transit providers in the region to identify transit needs and determine the most effective use of this funding; the FFYs 2026–30 TIP invested in five projects from regional transit authorities. More transit projects were added to the FFYs 2026–30 timeframe as a result of Amendment 10 to the FFYs 2025–29 TIP, which the MPO approved to address project delays.
In this FFYs 2026–30 TIP, the MPO funded seven Community Connections projects in addition to the 44 projects funded in the previous five TIP cycles. Funding for the Community Connections, Transit Transformation, and Bikeshare Support Programs continues to be reserved in FFYs 2027–30 for allocation in future TIP cycles.
In FFY 2025 of the FFYs 2025–29 TIP, the MPO selected six projects to fund in a Project Design Pilot, where the MPO would allocate federal funding to design projects that would eventually seek construction funding on the TIP. Projects selected for design funding are categorized within existing MPO investment programs, typically Complete Streets, Intersection Improvements, Bicycle Network and Pedestrian Connections, and Major Infrastructure.
The objective of the Project Design Pilot was two-fold: to increase resources for municipalities to advance high-scoring TIP projects and increase project application volumes, and to ensure that access to a steady source of design funding would lead to fewer delays and cost increases. In the FFYs 2026–30 TIP, the MPO selected another five projects for FFY 2026 design funds, including two projects listed in the MPO’s LRTP: the Route 4/225 Hartwell Avenue Interchange at Route 128 in Lexington and the Route 126/135 Grade Crossing in Framingham. The MPO also set-aside $2 million in FFY 2027 and $3 million in FFY 2028 and beyond for allocation to future applications.
More information on the projects selected for funding in each of the MPO’s investment programs can be found in Chapter 3.
The MPO classifies Major Infrastructure projects as follows:
This definition is intended to focus the Major Infrastructure investment program on those projects that are of significant scale or that are truly important for the broader region.
When developing the LRTP, the MPO sets funding allocation goals for each of its investment programs to ensure limited Regional Target funding is programmed in ways that best achieve the goals for transportation in the region. Because the MPO considers the five-year distribution of TIP funds across its investment programs relative to the goals set forth in the LRTP (as shown in Figure 2-1), properly categorizing projects is a critical component of the MPO’s decision-making process.
Figure 2-1
Destination 2050 Funding Goals by MPO Investment Program
Source: Boston Region MPO.
The MPO strongly prefers that project proponents submit 25 percent designs and obtain an updated cost estimate for their projects before the projects are programmed in the TIP. This standard was set by the MPO as part of a multi-pronged effort to reduce the prevalence of cost increases and delays for projects that have already been selected for funding in the TIP. The MPO also prefers that project proponents continue to demonstrate steady and consistent design progress after their projects are programmed on the TIP by regularly conveying design milestones and statuses to the MPO board via MPO staff.
MassDOT and the MBTA each update their rolling five-year Capital Investment Plans (CIPs) on an annual basis. MassDOT’s CIP identifies priority roadway, bridge, and statewide infrastructure projects for the five MassDOT divisions and includes funding for specific transit projects such as the South Coast Rail. The MBTA’s CIP outlines the agency’s five-year investment strategy for transit projects in its service area. Both CIP processes use a similar framework that prioritizes funding according to statewide strategic goals for the transportation system. Reliability is the top priority for MassDOT and the MBTA, followed by modernization and then expansion. Both agencies have created investment programs for their respective CIPs that relate to these strategic goals and allocate funding to these programs in ways that emphasize their priority. These goals and investment programs are as follows:
The MPO applies its investment framework when developing the TIP. The MPO board’s process for selecting projects to receive Regional Target funding relies on evaluation criteria to help identify and prioritize projects that advance the MPO’s goals. The criteria are based on the MPO’s goals and objectives outlined in the LRTP. All projects are required to show consistency with the LRTP and other statewide and regional plans. Other considerations include the readiness of a project for construction and municipal support for the project. Background information about the TIP project evaluation process is presented in Appendix A.
The MPO updates its LRTP every four years. With each LRTP update, the MPO reviews and updates the region’s goals, objectives, and investment programs. Following the adoption of Destination 2050 in July 2023, the MPO revised the TIP evaluation criteria to better align with the updated goals, objectives, and investment programs, including a new resilience goal area. The final criteria were informed by robust public engagement conducted during the development of Destination 2050, and developed through an update process that engaged MPO members, staff, and external stakeholders. The most significant update to the criteria for the FFYs 2025–29 TIP was the development of new and broader resilience evaluation metrics to align with the resilience goal area in Destination 2050 and elevate resilience to equal consideration in project prioritization alongside other goal-focused TIP criteria. To develop these metrics, staff held a stakeholder workshop that engaged advocates, community-based organizations, municipalities, and environmental agencies, and also distributed a survey and held one-on-one meetings with stakeholders. The outcomes of this process are discussed further in the Project Evaluation section on the following pages. These new criteria were employed during the project selection process for the FFYs 2026–30 TIP.
More information on these criteria is available in the Project Evaluation section of this chapter, as well as in Appendix A.
The TIP development process begins early in the federal fiscal year when cities and towns in the region designate staff as TIP contacts and begin developing a list of priority projects to be considered for federal funding. Each fall, the MPO staff asks these TIP contacts to identify their city or town’s priority projects and then MPO staff elicits input from interested parties and members of the general public.
These discussions about municipalities’ priority projects mark the start of a robust dialogue between MPO staff and project proponents that continues through the duration of the TIP cycle. The outreach for this TIP cycle began in November of 2024 when MPO staff held two virtual workshops for municipalities in the region to develop an understanding of the TIP process. In January 2025, MPO staff held inaugural Subregional Readiness Days—three meetings for municipalities to provide status updates on their projects to MPO staff. MPO staff also regularly hosted one-on-one virtual office hours throughout the year for proponents to ask more detailed questions about advancing specific projects for funding.
Once project proponents have decided to pursue TIP funding, they must begin the formal project initiation process. All new Bicycle Network and Pedestrian Connections, Complete Streets, Intersection Improvements, and Major Infrastructure projects must be initiated with the MassDOT Highway Division before they can be considered for programming in the TIP. These include projects seeking design funding as well as construction funds. MassDOT details this process on its project initiation web page, mass.gov/info-details/massdot-highway-initiating-a-project. To be considered for programming, proponents of Community Connections, Bikeshare Support, and Transit Transformation projects must apply for funding directly to MPO staff, as these projects do not require initiation with MassDOT. Municipalities seeking to advance Transit Transformation projects must apply for funding via their transit provider.
The MPO staff compiles project funding requests for projects into a Universe of Projects list, which consists of all identified projects being advanced for possible funding in a future TIP cycle. The Universe includes projects that are at advanced stages of project design, those that are undergoing preliminary engineering and design, and projects still in the conceptual planning stage. Applications for projects that are active municipal priorities and are feasibly ready to be programmed in the current TIP cycle continue forward into the MPO’s project evaluation process. Projects that are not ready for programming remain in the Universe for consideration in future TIP cycles.
The MPO staff uses project evaluation criteria to logically and transparently evaluate and select projects for programming in the TIP that advance the MPO’s vision for transportation in the region. This process favors projects that support the following goals:
As noted previously, the MPO undertook a process of revising the TIP evaluation criteria prior to the launch of the FFYs 2025–29 TIP to enhance the alignment between the TIP project selection process and the MPO’s updated goals, objectives, and investment programs outlined in Destination 2050. In terms of the overall structure of the criteria, this process resulted in the following outcomes:
In addition to these broader structural changes, several updates were made to individual criteria to better accomplish the MPO’s goals in the LRTP:
Several other changes were made to the project evaluation criteria, which are detailed in Appendix A. The point distributions by MPO investment program and LRTP goal area are also available in Figure 2-3. Some of the projects in the FFYs 2026–30 TIP were scored prior to the criteria revisions in each of these six investment programs, so both sets of criteria are referenced throughout this document.
During the FFYs 2025–29 TIP cycle, the MPO also undertook a parallel process to update its evaluation criteria for the smaller-scale, first-and-last-mile projects considered for funding through the Community Connections program. These adjustments were based on the lessons learned from the past four years of administering the program. In these revisions, MPO staff created a more focused set of criteria that better aligned with the types of projects pursuing funding through this program.
Revisions to the Community Connections criteria addressed the discrepancies between projects that serve a limited set of locations, such as small-scale purchases of bicycle racks or transit signal priority installations versus projects that serve larger areas, such as on-demand microtransit. The original criteria favored projects that had broad service areas. The new criteria are specific to each project type: Bicycle Lanes, Bicycle Racks, Bikeshare (Expansion and Replacement), Microtransit Pilots, and Wayfinding Signage.2 These adjustments result in more balanced scores to better reflect the goals of the program. More information on the scoring areas for these criteria is provided in Figure 2-4.
Figure 2-2
TIP Project Evaluation Criteria: Point Distributions by Project Type
(All Investment Programs except Community Connections)
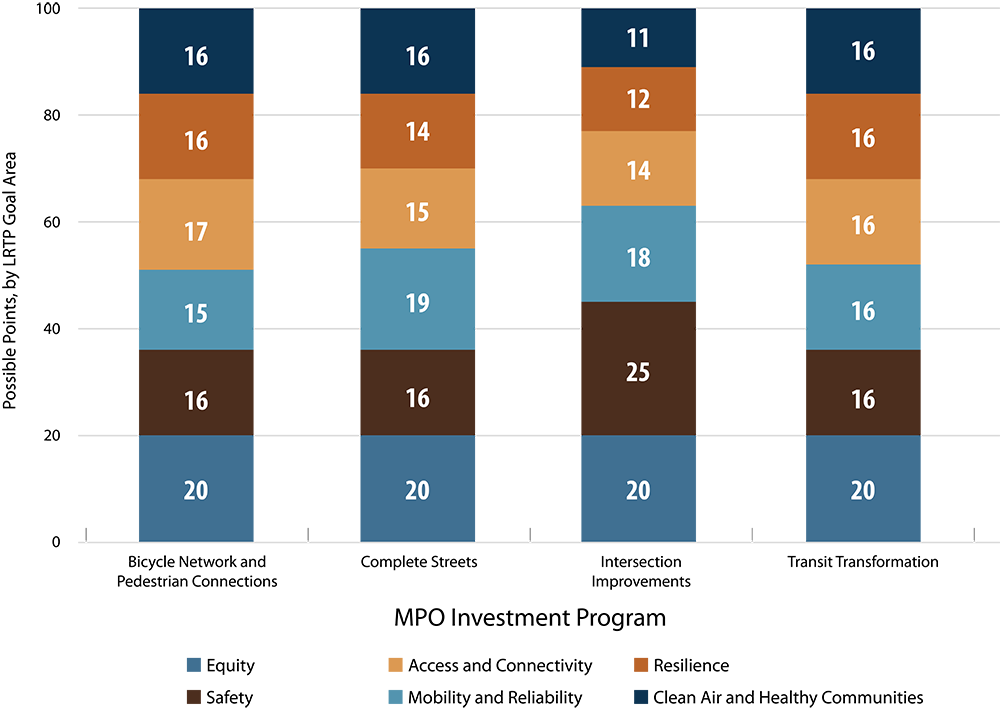
LRTP = Long-Range Transportation Plan.
Source: Boston Region MPO.
Figure 2-3
TIP Project Evaluation Criteria: Point Distributions by Community Connections Project Type
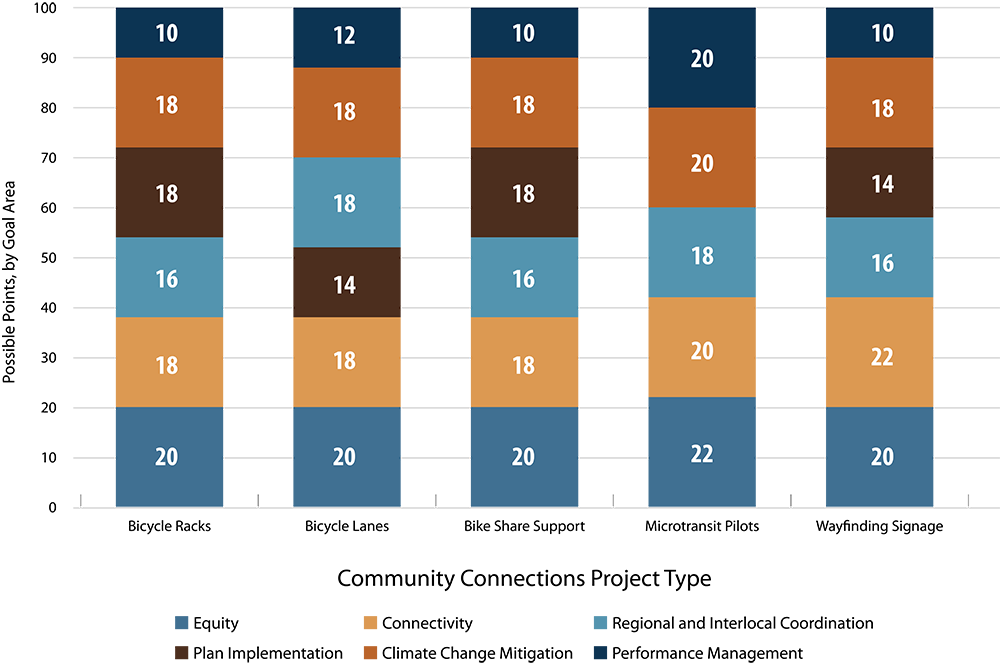
Source: Boston Region MPO.
In order for the MPO staff to conduct a complete project evaluation, each project proponent must provide enough information so that staff can meaningfully apply the evaluation criteria. Proponents of projects that are candidates for Bicycle Network and Pedestrian Connections, Complete Streets, Intersection Improvements, and Major Infrastructure funding must have submitted 25 percent design plans to MassDOT, or the plans must include the level of detail defined in a functional design report.3
Proponents of projects seeking design funding are required to provide a written scope or vision for development consistent with the information provided in a MassDOT Project Initiation Form. For Community Connections projects, proponents must submit a complete application to the MPO, including required supporting documentation such as budget sheets, letters of support from partner entities, and work estimates. Transit Transformation project applicants must submit an application with all relevant forms, budget sheets, and designs based on the scope of work proposed.
After MPO staff has completed an initial round of project scoring, draft scores are distributed to project proponents for their review. The MPO’s goal is to assess all projects fairly and accurately, making this review a critical component of the TIP process. Proponents are encouraged to submit feedback to MPO staff on their projects’ scores if they feel any criteria have been applied inaccurately. Proponents are also encouraged to submit additional supporting documentation on their projects if doing so would help clarify or correct any elements of the draft scoring. MPO staff takes all proponent feedback into consideration and makes any necessary adjustments to project scores before considering the evaluation process final and preparing the scores for presentation to the MPO.
For more details about the criteria used to score projects and project evaluation results for projects considered for programming in this TIP, see Appendix A.
On TIP Readiness Day, MPO staff meets with members of the MassDOT Highway Division and Office of Transportation Planning to review cost and schedule changes related to currently programmed projects, which are undergoing design review, permitting, and right-of-way acquisition. The MPO board then considers these updated project construction costs and changes to the expected dates for construction advertisement when making decisions about changes to TIP programming. These changes have an impact on the ability of the MPO to program its Regional Target funds for new projects in the five-year TIP.
Between the development of the FFYs 2021–25 TIP and the FFYs 2022–26 TIP, more than half of the projects programmed by the MPO experienced cost increases, many of which represented significant increases in percentage terms or in absolute cost. These changes placed severe limitations on the MPO’s ability to consider new projects for funding during the FFYs 2022–26 TIP cycle. As a partner to MassDOT’s Highway Division and Office of Transportation Planning, the MPO recognizes its role in supporting the on-time and on-budget delivery of projects by proponents. For this reason, the MPO board created a committee in the wake of the FFYs 2022–26 TIP cycle to further explore the causes of project cost increases and devise MPO policy changes to support more reliable project delivery by all parties.
The TIP Project Cost Ad Hoc Committee began its work in June 2021 and advanced a set of policy recommendations to the full MPO board in September 2021. These changes were formally adopted by the MPO on November 4, 2021, and went into effect for the development of the FFYs 2023–27 TIP. In addition to the requirement that project proponents submit 25 percent design plans and obtain an updated cost estimate for their project prior to obtaining funding in the TIP, the committee’s work resulted in several other policy changes. Most notably, the MPO board adopted a policy that proponents of any projects that experienced a cost increase of 25 percent or greater (for projects less than $10 million in cost) or of greater than $2.5 million (for projects more than $10 million in cost) would be required to present to the MPO board on the reasons for these cost increases. The MPO would then compare this project—at its new cost—to other projects based on a cost-effectiveness evaluation before deciding whether or not to fund the project at its higher cost. These cost changes are most often revealed through conversations between MassDOT staff and MPO staff during TIP Readiness Day, making this policy especially relevant at this stage of TIP development.
More information on the work of the TIP Project Cost Ad Hoc Committee is available in Chapter 3.
Using the evaluation scores and information gathered about project readiness (when a project likely would be fully designed and ready for advertisement) and cost, staff prepares possible TIP project programming scenarios for the MPO’s consideration. When developing these scenarios, MPO staff also considers whether a project was programmed in the LRTP, LRTP-based guidelines for allocating funds to different programs or project types, the distribution of investments across the region, and availability of sufficient funding. The MPO staff gathers feedback from board members, project proponents, and the public to inform a final staff recommendation. The recommendation is then presented to the MPO for approval before it is included in the draft TIP for public review.
In the FFYs 2026–30 TIP, the MPO selected and funded 13 new projects for implementation during this TIP cycle, including the following:
In addition to these projects, the MPO also selected five new projects to be funded for design work, with construction anticipated in future TIP development cycles:
In total, the MPO allocated more than $44 million in this TIP cycle to projects not previously funded in the Regional Target program. More information on the projects funded in the FFYs 2026–30 TIP is available in Chapter 3.
As discussed above, the selection of transit, bridge, and statewide infrastructure projects for programming in the TIP draws primarily from the CIPs produced by MassDOT and the MBTA. These agencies evaluate projects for inclusion in CIP programs using criteria established by the independent Project Selection Advisory Council (PSAC). The following criteria are from the PSAC process guide project evaluation:
Projects that receive the highest priority are those that meet each agency’s goals for maintaining and improving the overall condition and reliability of the system; modernizing the system to make it safer and more accessible and to accommodate growth; and expanding and diversifying transportation options for communities. These project-prioritization processes may also reflect other planning initiatives, such as Focus40, the MBTA’s 25-year investment plan, or MassDOT’s modal plans. More information on regulatory and planning guidance governing TIP project prioritization is available in Appendix E.
Once project prioritization is complete, programming decisions are made based on these evaluations and information regarding project readiness, program sizing, and existing asset management plans.
As discussed previously, the transit element of the TIP also includes the Federal-Aid Programs of the other two RTAs in the region, CATA and MWRTA. Once selection processes are complete for all four agencies, these agencies submit their lists of bridge and roadway projects, bicycle and pedestrian improvements, statewide infrastructure items, and transit capital projects to the MPO for review.
The MPO board considers the project evaluation results and staff recommendation when prioritizing projects for Regional Target funding. The board also considers public comments, the regional importance of projects, and other factors. In addition to prioritizing the Regional Target funding, the MPO board reviews MassDOT’s proposed statewide highway programming and the proposed capital programs for the MBTA, CATA, and MWRTA before voting to release a draft TIP for public review.
The MPO board votes to release the draft document for public review and invites members of the public, municipal and elected officials, and other stakeholders in the Boston region to review the proposed TIP. The MPO staff hosts outreach events during the public review period to elicit comments on the draft document. (See Appendix C for a full list of public comments submitted on this draft TIP.)
After the public review period ends, the MPO staff and board review all public comments, and the board may change the programming or the document as appropriate before endorsing the TIP. MassDOT staff incorporates the MPO-endorsed TIP into the State Transportation Improvement Program (STIP) and submits it to the FHWA and FTA for approval. The FHWA, FTA, and US Environmental Protection Agency review the STIP and certify it by September 30, the end of the federal fiscal year.
The TIP is a dynamic program that may be amended and adjusted throughout the year. Administrative modifications and amendments are often introduced because of changes in project status (advertisement readiness), project cost, project design scope, or available revenue. An amendment is a revision that requires public review and a demonstration of fiscal constraint.
Consistent with federal guidelines, the Boston Region MPO must release an amendment if there is (1) a change in project cost of $500,000 or more for projects valued at $5 million or less, or (2) a change of 10 percent or more of the project cost for projects valued greater than $5 million. TIP amendments are also released if there is a proposal to add or remove a project from the TIP or if the programming year of a project is changed. Cost changes that are less than the above threshold amounts may be considered in the form of administrative modifications or adjustments, which must still undergo MPO board action for approval. Administrative modifications or adjustments are also undertaken in the event that a project’s funding source changes. Although a public review period is not required for administrative modifications or adjustments, one may be offered at the MPO board’s discretion.
Regardless of the nature of an amendment, all proposed TIP amendments are presented in a public setting at an MPO meeting, and details are posted on the MPO’s website, bostonmpo.org. Public notices are distributed through the MPO’s email contact list, which members of the public may join by signing up on the MPO’s website. Municipal staff who are TIP contacts at the affected municipalities and the public are notified of pending amendments at the start of an amendment’s public review period.
A history of TIP Amendments can be found at https://www.ctps.org/tip.
Notices of draft TIP amendments include a summary of the amendment’s contents, dates of the public review period, contact information for submitting a comment to the MPO, and the date, time, and location that the MPO will vote on that amendment. Municipal representatives and members of the public are invited to submit written or oral testimony at the MPO meetings at which amendments are discussed or voted upon.
The MPO typically holds a 21-day public review period before taking final action on an amendment. In extraordinary circumstances, the MPO may vote to shorten the public review period to a minimum of 15 days. These circumstances are detailed in the MPO’s Public Engagement Plan.
The MPO’s website is the best place to find current information about the TIP. All changes to the draft TIP and changes to the endorsed TIP, such as amendments and modifications that have been approved by the MPO, are available on the TIP web page, bostonmpo.org/tip.
Comments or questions about the draft TIP materials may be submitted directly to the MPO staff via the website, email, or US mail, or voiced at MPO meetings and other public MPO events.
1 More information on the Multi-Family Zoning Requirement for MBTA Communities (Section 3A of MGL c. 40A) can be found at https://www.mass.gov/info-details/multi-family-zoning-requirement-for-mbta-communities.
2 Transit signal priority and bus lane projects were incorporated under the Transit Transformation scoring criteria. They were previously under the Community Connections criteria.
3 See MassDOT’s Project Development and Design Guide for information about the contents of a functional design report. This guide is available at mass.gov/lists/design-guides-and-manuals.
The Transportation Improvement Program (TIP) tables included in this chapter present a listing of all the projects and programs funded with federal highway and transit aid in the Boston region during federal fiscal years (FFYs) 2025–29. These funding tables are also included as part of the State Transportation Improvement Program (STIP).
Table 3-1 presents a summary of the Boston Region Metropolitan Planning Organization’s (MPO) share of Regional Target funds from the Federal-Aid Highway Program. The allocation of these funds is constrained by projections of available federal aid. As shown in Table 3-1, the MPO has programmed much of the available discretionary funds within the limits of projected funding for highway funding programs. As such, the FFYs 2025–29 TIP Regional Target Program complies with financial constraint requirements.
Table 3-1
Boston Region MPO Regional Target Program
|
FFY 2026 |
FFY 2027 |
FFY 2028 |
FFY 2029 |
FFY 2030 |
Total |
Regional Target Obligation Authority |
$125,285,687 |
$152,627,429 |
$158,700,879 |
$157,518,346 |
$160,037,411 |
$754,169,752 |
Regional Target Funds Programmed |
$122,615,097 |
$151,147,420 |
$156,604,600 |
$155,699,104 |
$124,727,200 |
$43,376,331 |
Regional Target Funds Unprogrammed |
$2,670,590 |
$1,480,009 |
$2,096,279 |
$1,819,242 |
$35,310,211 |
$43,376,331 |
Source: Boston Region MPO.
As discussed in Chapter 2, the signing of the Bipartisan Infrastructure Law (BIL), on November 15, 2021, increased the amount of Regional Target funding available to the Boston Region MPO in the previous FFYs 2024–28 TIP cycle by approximately nine percent from the funding levels in the FFYs 2023–27 TIP. This funding level was sustained in the development of this FFYs 2025–29 TIP. The projects selected by the MPO for funding for the first time in the FFYs 2025–29 TIP are listed in Table 3-2.
During the development of the FFYs 2025–29 TIP, the MPO had significant amounts of funding available to program in FFYs 2025, 2026, and 2029. However, there were significant shortfalls of funding in 2027 and 2028 as a result of delayed programming of 14 projects.
Projects already programmed in the TIP to receive Regional Target funds could not be accelerated, so the MPO worked with the Massachusetts Department of Transportation (MassDOT), the Massachusetts Bay Transportation Authority (MBTA), MetroWest Regional Transit Authority (MWRTA), and Cape Ann Transportation Authority (CATA) to identify other projects that could be funded in FFYs 2025 and 2026. Jointly, these agencies presented more than 13 projects to the MPO for consideration, from which the MPO selected 11 projects for funding in the Transit Transformation program in FFYs 2025 and 2026:
The MPO also voted to fund two projects in FFY 2025 that were previously incorporated into MassDOT’s Statewide Highway Program:
Because many of these projects were identified later in the project evaluation life cycle—that is, months after the regular cycle of project submissions—scoring information is included in the TIP with some delay compared to other project line items. While these projects were identified too late in the TIP cycle to be quantitatively evaluated using the MPO’s scoring criteria, these projects align well qualitatively with many of the MPO’s goals, including enhancing bicycle and pedestrian safety and access, and expanding the accessibility of and maintaining a state of good repair for the region’s transit system. These projects may be scored using the MPO’s scoring criteria in a later TIP cycle.
Table 3-2
New Regional Target Projects Funded in the FFYs 2025–29 TIP
| Project Name |
Proponent |
MPO Investment Program |
FFYs of Funding |
Regional Target Dollars Programmed in FFYs 2026–30 |
|||
|---|---|---|---|---|---|---|---|
Acton- Reconstruction of Route 2A/119 (Great Road), from Davis Road to Harris Street (Design Only) |
Acton |
Complete Streets |
2026 |
$860,000 |
|||
Boston- Bluebikes Station Replacement, 20 Stations |
Boston |
Community Connections |
2026 |
$783,860 |
|||
Brookline- Bluebikes Expansion, 3 Stations, 20 eBikes |
Brookline |
Community Connections |
2026 |
$238,846 |
|||
Cambridge- Bluebikes Station Replacement, 7 Stations |
Cambridge |
Community Connections |
2026 |
$223,715 |
|||
Cambridge- New Bridge and Shared-Use Path Connection over Fitchburg Line at Danehy Park Connector (Design Only) |
Cambridge |
Bicycle and Pedestrian |
2026 |
$2,000,000 |
|||
Chelsea- Bluebikes Expansion, 3 Stations, 28 Classic Bikes, 5 eBikes |
Chelsea |
Community Connections |
2026 |
$86,228 |
|||
CTPS- Procurement and Installation of Six Air Quality Sensors for GHG Monitoring (Performance Based Planning Program) |
Regionwide |
Administrative |
2026 |
$43,000 |
|||
Hudson- Bike Path Construction of Mass Central Rail Trail, from Felton Street to Priest Street (Design Only) |
Hudson |
Bicycle and Pedestrian |
2026 |
$909,700 |
|||
Lynnfield- Rail Trail Construction, from Ford Avenue to Nichols Lane (Phase 1) |
Lynnfield |
Bicycle and Pedestrian |
2026 |
$6,062,695 |
|||
Malden- Design of Improvements on Route 60 (Phase 1 and 2), Franklin Street to Lynn Street |
Malden |
Complete Streets |
2026 |
$800,000 |
|||
Marblehead- Installation of 22 Bike Racks |
Marblehead |
Community Connections |
2026 |
$6,250 |
|||
MBTA- Better Bus Project- Operational Safety Improvements at Bus Stops |
Regionwide |
Transit Transformation |
2026 |
$3,216,897 |
|||
MBTA- Bus Priority and Accessibility Improvements |
Regionwide |
Transit Transformation |
2026 |
$6,000,000 |
|||
MBTA- Operational Enhancement of Bus Routes 714 and 716 |
Boston, Canton, Hingham, Hull, and Milton |
Transit Transformation |
2026 |
$1,875,000 |
|||
Newton- Installation of 67 Bike Racks, 2 Shelters, 12 RRFBs |
Newton |
Community Connections |
2026 |
$473,132 |
|||
Salem- Broad Street and Dalton Parkway Corridor Project (Design Only) |
Salem |
Complete Streets |
2026 |
$1,068,780 |
|||
Somerville- Bluebikes Station Replacement, 5 Stations |
Somerville |
Community Connections |
2026 |
$107,417 |
|||
CTPS- Project Design Set-Aside |
Regionwide |
Administrative |
2027-30 |
$11,000,000 |
|||
Melrose- Lebanon Street Improvement Project (Lynde Street to Malden City Line) |
Melrose |
Complete Streets |
2030 |
$10,528,000 |
|||
Total |
N/A |
N/A |
N/A |
$44,071,696 |
|
||
Note: Funding amounts in this table include both federal and non-federal funds, including matching funds.
* These projects are funded starting in FFY 2029 of the TIP, with further funding expected to be programmed in FFY 2030 of the FFYs 2026–30 TIP.
ADA = Americans with Disabilities Act. CATA = Cape Ann Transportation Authority. FFY = federal fiscal year. MassDOT = Massachusetts Department of Transportation. MBTA = Massachusetts Bay Transportation Authority. MWRTA = MetroWest Regional Transit Authority. N/A = not applicable. NB = northbound. TIP = Transportation Improvement Program.
Source: Boston Region MPO.
In addition to the project selection, several other key decisions were made by the MPO in the drafting of the FFYs 2025–29 Regional Target Program:
In order to address funding constraints in FFY 2027, the MPO voted to delay Project 610662, Woburn–Roadway and Intersection Improvements at Woburn Common, Route 38 (Main Street), Winn Street, Pleasant Street and Montvale Avenue, to FFY 2029 given a lack of significant design progress on the project since the FFYs 2021–25 TIP cycle.
Additional details of the specific projects programmed with Regional Target funding are shown in Section 1A of each annual element of the TIP tables (Table 3-7). The other sections in Table 3-7 (Sections 1B, 2A, 2B, 2C, and 3B) list the following:
Tables 3-8, 3-9, 3-10, and 3-11 list the federally funded transit projects and programs in the Boston region that the MBTA, MWRTA, and CATA plan to undertake.
Detailed descriptions of projects funded through both the Regional Target and statewide portions of the Highway Program follow the tables. The descriptions note the evaluation scores (for MPO-funded projects), project proponents, and funding details. The pages are organized alphabetically by the municipality in which each project is located.
This section summarizes the investments made by the Boston Region MPO, MassDOT, MBTA, CATA, and MWRTA that are documented in the FFYs 2025–29 TIP. Table 3-3 shows the Boston Region MPO’s investments of Regional Target funding—including both the number of projects and the dollar amount—by investment program. These investments are aimed at making progress towards the MPO’s goals for the region, including enhancing safety for all users, preserving and modernizing the transportation system, promoting mobility and reducing congestion, supporting clean air and sustainability, ensuring all have equitable access to the transportation system, and fostering economic vitality in the region through investments in transportation.
The MPO’s Regional Target Program increased in size by approximately $30.4 million between the FFYs 2024–28 TIP and the FFYs 2025–29 TIP to a total program size of more than $727.9 million.
Table 3-3
FFYs 2025–29 Boston Region MPO Regional Target Investment Summary
.
MPO Investment Program |
Number of Projects |
Regional Target Dollars Programmed |
Bicycle Network and Pedestrian Connections |
8 |
$80,376,280 |
Community Connections (allocated to projects) |
9 |
$2,995,833 |
Community Connections (not yet allocated to projects)* |
2 |
$17,036,193 |
Complete Streets |
23 |
$328,605,870 |
Intersection Improvements |
3 |
$12,550,882 |
Major Infrastructure—Roadway |
5 |
$226,071,909 |
Transit Transformation (allocated to projects) |
5 |
$12,591,897 |
Transit Transformation (not yet allocated to projects) |
1 |
$19,500,000 |
Administrative |
2 |
$11,043,000 |
Unprogrammed |
N/A |
$43,376,331 |
Total |
58 |
$754,169,752 |
Note: Funding amounts in this table include both federal and non-federal funds, including matching funds.
* This figure includes $8 million in BikeShare Support funding.
FFY = federal fiscal year. MPO = metropolitan planning organization. N/A = not applicable.
Source: Boston Region MPO.
Table 3-4 shows MassDOT’s FFYs 2025–29 TIP investments—including both the number of projects or programs and the dollar amount—organized by MassDOT program. MassDOT’s investments are distributed across a variety of programs and will support bridge and pavement improvements, roadway improvements and reconstruction, new bicycle and pedestrian infrastructure, and safety improvements. More details on these investments are available on the project description pages in the second section of this chapter.
As detailed above for the MPO’s Regional Target Program, the BIL significantly increased the funding available to MassDOT for programming projects in the statewide Highway Program. Most notably, the BIL’s Bridge Formula Program allowed MassDOT to increase the funding allocated to federal-aid bridge projects. Furthermore, FFY 2026 represents the conclusion of Grant Anticipation Notes (GANS) payments for MassDOT’s Accelerated Bridge Program (ABP). As this program winds down, the passage of the 2021 Massachusetts Transportation Bond Bill and the new federal funding available through the BIL has allowed for the creation of MassDOT’s Next Generation Bridge Program (NGBP).
Like the ABP, the NGBP leverages state bonding capacity to accelerate the rehabilitation and replacement of critical or structurally deficient bridges in Massachusetts. In the FFYs 2025–29 TIP, 13 bridge projects are funded by MassDOT through the NGBP using state bond bill funds. These projects are shown in the TIP as debt payments on these bonds, which will use future federal formula funding.
Continued funding from the BIL supports increased investment across MassDOT’s other programs represented in the FFYs 2025–29 TIP, including the Bicycle and Pedestrian Program, the Intersection Improvements Program, the Interstate and Non-Interstate Pavement Programs, the Roadway Reconstruction Program, and the Safety Improvements Program. MassDOT’s Highway Program is substantively similar in total programming between the FFYs 2024–28 TIP and FFYs 2025–29 TIP. The FFYs 2025–29 TIP introduces a new Highway Resiliency Improvement Program.
Table 3-4
FFYs 2025–29 MassDOT Highway Program Investment Summary
MassDOT Program |
Number of Projects |
MassDOT Dollars Programmed |
Accessibility Improvements |
1 |
$1,349,161 |
Bicycle and Pedestrian |
9 |
$59,751,474 |
Bridge Off-System |
2 |
$17,280,769 |
Bridge On-System |
18 |
$1,249,415,139 |
Bridge Systematic Maintenance |
7 |
$95,601,149 |
Freight |
3 |
$20,010,798 |
Highway Resiliency Improvement Program |
2 |
$14,500,806 |
Intersection Improvements |
7 |
$63,669,086 |
Interstate Pavement |
5 |
$67,013,203 |
Non-Interstate Pavement |
8 |
$44,051,771 |
Roadway Reconstruction |
5 |
$101,576,170 |
Safe Routes to School |
12 |
$23,984,686 |
Safety Improvements |
10 |
$49,965,684 |
Total |
89 |
$1,808,169,896 |
Note: Funding amounts in this table include both federal and non-federal funds, including matching funds. FFY = Federal Fiscal Year. MassDOT = Massachusetts Department of Transportation.
Table 3-5 shows the MBTA’s programs and associated FFYs 2025–29 TIP funding amounts. Additional details on the MBTA’s programs and projects are in Tables 3-8 and 3-9. The MBTA’s capital program is substantively similar between FFYs 2024–28 TIP and the FFYs 2025–29 TIP, decreasing from a total program size of $3.99 billion to $3.85 billion. Investments made through these programs allow the MBTA to continue to maintain and modernize its infrastructure in support of the agency’s role as the largest transit provider in the Commonwealth of Massachusetts.
The MBTA caters to a wide range of needs, serving the Boston region with commuter rail, light rail, subway, fixed-route bus, and paratransit services. The MBTA prioritizes projects that keep the existing transit system in a state of good repair, including the purchase of new rolling stock, accessibility and resiliency improvements to stations, the rehabilitation of bridges and tunnels, and the replacement of tracks and signals to support system-wide reliability. Limited system expansion projects are also undertaken through the MBTA’s federal capital program. Further information on how the MBTA’s investments support system safety and condition is available in Chapter 4.
Table 3-5
FFYs 2025–29 MBTA Transit Program Investment Summary
Federal Transit Administration Program |
MBTA Program |
MBTA Dollars Programmed |
Section 5307: Urbanized Area Formula Grants |
Bridge and Tunnel Program |
$39,000,000 |
Section 5307: Urbanized Area Formula Grants |
Revenue Vehicle Program |
$404,142,509 |
Section 5307: Urbanized Area Formula Grants |
Signals/Systems Upgrade Program |
$395,331,005 |
Section 5307: Urbanized Area Formula Grants |
Stations and Facilities Program |
$389,337,630 |
Section 5337: Fixed Guideway/Bus Funds |
Bridge and Tunnel Program |
$405,609,433 |
Section 5337: Fixed Guideway/Bus Funds |
Revenue Vehicle Program |
$589,481,405 |
Section 5337: Fixed Guideway/Bus Funds |
Signals/Systems Upgrade Program |
$301,212,951 |
Section 5337: Fixed Guideway/Bus Funds |
Stations and Facilities Program |
$204,542,949 |
Section 5339: Bus and Bus Facilities Funds |
Bus Program |
$40,303,276 |
Other Federal Funds |
Green Line CIG-Core Capacity (Proposed Funding)* |
$3,800,580,887 |
Other Federal Funds |
RRIF/TIFIA Financing Program† |
$797,500,000 |
Other Federal Funds |
North Station Draw 1 Bridge Replacement (FFY 26 MEGA) |
$236,330,911 |
Other Federal Funds |
Fairmount Line Decarbonization (CRP) |
$8,710,079 |
Total |
N/A |
$7,612,083,035 |
Note: Federal Transit Administration formula funds (Sections 5307, 5337 and 5339) are based on estimated apportionments for FFYs 2026–30. TIP programs and projects are based on a preliminary draft Capital Investment Plan (CIP) as of April 2025. Adjustments will be made to federal projects and budgets as the CIP process is finalized. Funding amounts in this table include both federal and non-federal funds, including matching funds.
*The "Green Line CIG-Core Capacity (Proposed Funding)" line item represents a preliminary estimate of the MBTA’s future FTA CIG-Core Capacity grant application and is a demonstration of the MBTA’s participation in the discretionary program. If awarded, this grant would support a number of Green Line Projects intended to increase system capacity by no less than 10 percent. Each project will be funded by a combination of FTA Core Capacity grant funds, FTA Boston UZA formula funds and MBTA local match. This line item only reflects the proposed Core Capacity funding. Projects P0591, P1010, P0921, P1102, P1105, P0920, P1011, P1103, P1101, P1336, P0923, P1334, P0922, P1337, P1338, and P0924 are approved in the transit element of the endorsed FFYs 2025-29 Boston Region TIP and the Transit Investment Report of the FFYs 2025-29 Massachusetts STIP. These projects are elements of the MBTA’s Core Capacity application and are identified in the table above. Through the MBTA CIP, Boston Region TIP, and Massachusetts STIP, MBTA has committed the use of $370,308,314 of Boston UZA 5307 formula funding to support the completion of these projects. Upon award, projects, budgets, and funding sources will be amended as required.
† RRIF/TIFIA financing program funding is an initial estimate and will be refined as projects are identified and loans are finalized with the Build America Bureau.
CRP = Carbon Reduction Program. FFY = federal fiscal year. MBTA = Massachusetts Bay Transportation Authority. N/A = not applicable. RRIF = Railroad Rehabilitation and Improvement Financing. STIP = State Transportation Improvement Program. TIFIA = Transportation Infrastructure Finance and Innovation Act. TIP = Transportation Improvement Program. UZA = urbanized area.
Sources: MBTA and the Boston Region MPO.
Table 3-6 summarizes CATA and MWRTA investments included in the FFYs 2025–29 TIP, and more information is available on each agency’s investments in Tables 3-10 and 3-11. Though the MBTA provides commuter rail service to the Cape Ann communities of Rockport and Gloucester, CATA provides additional paratransit and fixed-route bus services to these communities and to Danvers, Peabody, Ipswich, Essex, and Beverly. CATA’s federal capital program supports its role in providing critical transportation alternatives to residents and visitors of the area, including through the replacement of buses, the modernization of facilities, and the maintenance of assets.
MWRTA similarly complements MBTA commuter rail service, operating fixed-route bus, on-demand microtransit, and commuter shuttle services to a number of communities in the MetroWest subregion. MWRTA’s federal capital program supports this mission by funding vehicle replacements, station and facility maintenance and improvements, and operating assistance for paratransit services, among other efforts. Other MWRTA projects funded in the MWRTA’s capital program include the electrification of the agency’s paratransit fleet and investments in technology to support travel training and customer service efforts.
The program sizes for CATA and MWRTA increased greatly between the FFYs 2024–28 TIP and FFYs 2025–29. This was driven by a 91 percent increase in the state budget for regional transit authorities in state fiscal year 2024. These agencies collectively received an approximate $41.52 million increase in funding levels in this TIP, increasing from $65.36 million to a total program size of $106.88 million. This funding level also includes approximately $8.3 million in flexed funding from the Boston Region MPO’s Regional Target Program between FFYs 2025 and 2026.
Table 3-6
FFYs 2025–29 CATA and MWRTA Transit Program Investment Summary
Regional Transit Authority |
Federal Transit Administration Program |
RTA Dollars Programmed |
CATA |
Section 5307: Urbanized Area Formula Funding |
$2,850,000 |
CATA |
State Transportation Bond Capital Assistance |
$9,670,000 |
CATA |
Municipal and Local Assessments |
$400,000 |
MWRTA |
Section 5307: Urbanized Area Formula Funding |
$33,010,000 |
MWRTA |
Section 5339: Bus and Bus Facilities |
$42,000,000 |
MWRTA |
State Transportation Bond Capital Assistance |
$29,990,000 |
MWRTA |
Other Federal |
$27,000,000 |
Total |
N/A |
$144,920,000 |
Note: Funding amounts in this table include both federal and non-federal funds, including matching funds.
CATA = Cape Ann Transportation Authority. FFY = federal fiscal year. MWRTA = Metro West Regional Transit Authority. N/A = not applicable. RTA = regional transit authority.
Sources: CATA, MWRTA, and the Boston Region MPO.
Tables 3-7 through 3-11 build on the summary tables listed above by detailing investments made through both the Highway and Transit Programs by project, program, and funding year.
Table 3-7
FFYs 2025–29 TIP Highway Table
| 2030 | 612534 | Boston Region | Melrose | MELROSE- LEBANON STREET IMPROVEMENT PROJECT | 4 | STBG | $4,341,221 | $3,528,000 | $2,822,400 | $705,600 | |
| 2030 | 612534 | Boston Region | Melrose | MELROSE- LEBANON STREET IMPROVEMENT PROJECT | 4 | TAP | $4,341,221 | $2,000,000 | $1,600,000 | $400,000 | |
| 2030 | 612963 | Boston Region | Bellingham | BELLINGHAM- ROADWAY REHABILITATION OF ROUTE 126 (HARTFORD ROAD), FROM 800 NORTH OF THE I-495 NB OFF RAMP TO MEDWAY TL, INCLUDING B-06-017 | 3 | NHPP | $15,848,000 | $7,508,000 | $6,006,400 | $1,501,600 | |
| 2030 | S12820 | Boston Region | BOSTON REGION - BIKESHARE SUPPORT SET ASIDE | STBG | $8,000,000 | $2,000,000 | $1,600,000 | $400,000 | |||
| Flex to FTA | $7,000,000 | $5,600,000 | $1,400,000 | ||||||||
| 2030 | S12113 | Boston Region | BOSTON REGION - TRANSIT TRANSFORMATION PROGRAM | CMAQ | $19,500,000 | $7,000,000 | $5,600,000 | $1,400,000 | |||
| Transit Grant Program | $2,500,000 | $2,000,000 | $500,000 | ||||||||
| 2030 | S12124 | Boston Region | Multiple | BOSTON REGION - COMMUNITY CONNECTIONS PROGRAM | CMAQ | $9,036,193 | $2,500,000 | $2,000,000 | $500,000 | ||
| Roadway Improvements | $3,000,000 | $2,400,000 | $600,000 | ||||||||
| 2030 | S13145 | Boston Region | BOSTON REGION PROJECT DESIGN SET-ASIDE | STBG | $11,000,000 | $3,000,000 | $2,400,000 | $600,000 | |||
| Section 1B / Earmark or Discretionary Grant Funded Projects | $188,200,465 | $150,560,372 | $37,640,093 | ||||||||
| Bridge On-system Non-NHS NB | $20,691,268 | $16,553,014 | $4,138,254 | ||||||||
| 2030 | 608397 | Boston Region | Gloucester | GLOUCESTER- BRIDGE RECONSTRUCTION, G-05-002, WESTERN AVENUE OVER BLYNMAN CANAL | 4 | HIP-BR | $64,960,000 | $20,691,268 | $16,553,014 | $4,138,254 | |
| Bridge On-system NHS | $167,509,197 | $134,007,358 | $33,501,839 | ||||||||
| 2030 | 612496 | Boston Region | Somerville | SOMERVILLE- BRIDGE PRESERVATION, S-17-031, I-93 (NB & SB) FROM ROUTE 28 TO TEMPLE STREET (PHASE 2) | 4 | HIP-BR | $217,509,198 | $57,509,197 | $46,007,358 | $11,501,839 | |
| 2030 | 613130 | Boston Region | Boston | BOSTON- BRIDGE REPLACEMENT, B-16-033, MORRISSEY BOULEVARD OVER DORCHESTER BAY | 6 | HIP-BR | $174,618,125 | $110,000,000 | $88,000,000 | $22,000,000 | |
| Section 2A / Federal Aid Funded State Prioritized Reliability Projects | $170,039,815 | $136,853,427 | $33,186,388 | ||||||||
| Bridge On-system Non-NHS | $100,000,000 | $80,000,000 | $20,000,000 | ||||||||
| 2030 | 605276 | Boston Region | Multiple | BEVERLY- SALEM- BRIDGE REPLACEMENT, B-11-005=S-01-013, KERNWOOD AVENUE OVER DANVERS RIVER AND B-11-001, BRIDGE STREET OVER BASS RIVER (HALL-WHITAKER DRAWBRIDGE) | 4 | NHPP | $438,752,268 | $100,000,000 | $80,000,000 | $20,000,000 | |
| Non-Interstate Pavement | $17,128,224 | $13,702,579 | $3,425,645 | ||||||||
| 2030 | 608495 | Boston Region | Multiple | CONCORD- LEXINGTON- LINCOLN- RESURFACING AND RELATED WORK ON ROUTE 2A | 4 | NHPP | $5,067,399 | $5,067,399 | $4,053,919 | $1,013,480 | |
| 2030 | 612027 | Boston Region | Ipswich | IPSWICH- RESURFACING OF ROUTE 1A | 4 | NHPP | $2,195,025 | $2,195,025 | $1,756,020 | $439,005 | |
| 2030 | 613639 | Boston Region | Framingham | FRAMINGHAM- RESURFACING AND RELATED WORK ON ROUTE 9 | 3 | NHPP | $9,865,800 | $9,865,800 | $7,892,640 | $1,973,160 | |
| Safety Improvements | $8,215,751 | $7,394,176 | $821,575 | ||||||||
| 2030 | 608498 | Boston Region | Multiple | QUINCY- BRAINTREE- RESURFACING AND RELATED WORK ON ROUTE 53 | 6 | HSIP | $11,911,069 | $1,000,000 | $900,000 | $100,000 | |
| 2030 | 610675 | Boston Region | Chelsea | CHELSEA- RECONSTRUCTION OF SPRUCE STREET, FROM EVERETT AVENUE TO WILLIAMS STREET | 6 | HSIP | $7,215,751 | $7,215,751 | $6,494,176 | $721,575 | |
| Bridge On-system NHS | $44,695,840 | $35,756,672 | $8,939,168 | ||||||||
| 2030 | 612634 | Boston Region | Somerville | SOMERVILLE- BRIDGE REPLACEMENT, S-17-024, ROUTE 28/MCGRATH HWY OVER SOMERVILLE AVE EXT & MBTA | 4 | NHPP-PEN | $93,854,208 | $44,695,840 | $35,756,672 | $8,939,168 | |
| Section 2B / Federal Aid Funded State Prioritized Modernization Projects | $23,526,266 | $19,947,616 | $3,578,650 | ||||||||
| Intersection Improvements | $11,266,036 | $10,139,432 | $1,126,604 | ||||||||
| 2030 | 607748 | Boston Region | Acton | ACTON- INTERSECTION & SIGNAL IMPROVEMENTS ON SR 2 & SR 111 (MASSACHUSETTS AVENUE) AT PIPER ROAD & TAYLOR ROAD | 3 | HSIP | $11,266,036 | $11,266,036 | $10,139,432 | $1,126,604 | |
| Roadway Reconstruction | $10,911,069 | $8,728,855 | $2,182,214 | ||||||||
| 2030 | 608498 | Boston Region | Multiple | QUINCY- BRAINTREE- RESURFACING AND RELATED WORK ON ROUTE 53 | 6 | NHPP | $11,911,069 | $10,911,069 | $8,728,855 | $2,182,214 | |
| Accessibility Improvements | $1,349,161 | $1,079,329 | $269,832 | ||||||||
| 2030 | 613882 | Boston Region | Multiple | DISTRICT 4- ACCESSIBILITY IMPROVEMENTS AT MULTIPLE LOCATIONS (SOUTHERN PROJECT) | 4 | STBG | $1,349,161 | $1,349,161 | $1,079,329 | $269,832 | |
| Section 2C / Federal Aid Funded State Prioritized Expansion Projects | $14,732,000 | $11,785,600 | $2,946,400 | ||||||||
| Bicycle and Pedestrian | $14,732,000 | $11,785,600 | $2,946,400 | ||||||||
| 2030 | S13230 | Boston Region | WAKEFIELD - RAIL TRAIL CONSTRUCTION NORTHERN SEGMENT | CMAQ | $14,732,000 | $14,732,000 | $11,785,600 | $2,946,400 | |||
Table 3-8
FFYs 2025–29 TIP Transit Table (MBTA Federal Capital Program)
| MBTA Capital Program - Federal Funding | ||||||||
| FFY 2026-2030 Transportation Improvement Program (TIP) - April 2025 | ||||||||
| Federal Funding Program | ALI | 2026 | 2027 | 2028 | 2029 | 2030 | FFY26-30 Total (Federal) | FFY26-30 Total (Incl. Match) |
| 5307 | $196,449,783 | $196,449,784 | $196,449,784 | $196,449,781 | $196,449,783 | $982,248,915 | $1,227,811,144 | |
| Bridge & Tunnel Program | 12.24.05 | $0 | $7,800,000 | $7,800,000 | $7,800,000 | $7,800,000 | $31,200,000 | $39,000,000 |
| Revenue Vehicle Program | 12.12.00 | $22,501,120 | $75,203,222 | $75,203,222 | $75,203,221 | $75,203,222 | $323,314,007 | $404,142,509 |
| Signals/Systems Upgrade Program | 12.63.01 | $137,358,437 | $44,726,592 | $44,726,592 | $44,726,591 | $44,726,592 | $316,264,804 | $395,331,005 |
| Stations and Facilities Program | 12.34.00 | $36,590,226 | $68,719,970 | $68,719,970 | $68,719,969 | $68,719,969 | $311,470,104 | $389,337,630 |
| 5337 | $240,135,478 | $240,135,478 | $240,135,478 | $240,135,478 | $240,135,478 | $1,200,677,390 | $1,500,846,738 | |
| Bridge & Tunnel Program | 12.24.05 | $9,678,482 | $78,702,266 | $78,702,266 | $78,702,266 | $78,702,266 | $324,487,546 | $405,609,433 |
| Revenue Vehicle Program | 12.12.00 | $76,218,736 | $98,841,597 | $98,841,597 | $98,841,597 | $98,841,597 | $471,585,124 | $589,481,405 |
| Signals/Systems Upgrade Program | 12.63.01 | $84,793,869 | $39,044,123 | $39,044,123 | $39,044,123 | $39,044,123 | $240,970,361 | $301,212,951 |
| Stations and Facilities Program | 12.34.00 | $69,444,391 | $23,547,492 | $23,547,492 | $23,547,492 | $23,547,492 | $163,634,359 | $204,542,949 |
| 5339 | $6,448,524 | $6,448,524 | $6,448,524 | $6,448,525 | $6,448,524 | $32,242,621 | $40,303,276 | |
| Bus Program | 11.14.00 | $6,448,524 | $6,448,524 | $6,448,524 | $6,448,525 | $6,448,524 | $32,242,621 | $40,303,276 |
| FFY26-30 FTA Formula Funding | $443,033,785 | $443,033,786 | $443,033,786 | $443,033,784 | $443,033,785 | $2,215,168,926 | $2,768,961,158 | |
| Other Federal | $2,258,823,235 | $162,500,000 | $162,500,000 | $162,500,000 | $147,500,000 | $2,893,823,235 | $4,843,121,877 | |
| RRIF/TIFIA Financing Program (Potential) | 12.24.05 | $162,500,000 | $162,500,000 | $162,500,000 | $162,500,000 | $147,500,000 | $797,500,000 | $797,500,000 |
| Green Line CIG-Core Capacity (Proposed Funding) | 12.23.03 | $1,900,290,443 | $0 | $0 | $0 | $0 | $1,900,290,443 | $3,800,580,887 |
| North Station Draw 1 Bridge Repl. (FFY26 MEGA) | 12.23.05 | $189,064,729 | $0 | $0 | $0 | $0 | $189,064,729 | $236,330,911 |
| Fairmount Line Decarbonization (CRP) | 12.23.03 | $6,968,063 | $0 | $0 | $0 | $0 | $6,968,063 | $8,710,079 |
| FFY26-30 Total Federal Funding | $2,701,857,020 | $605,533,786 | $605,533,786 | $605,533,784 | $590,533,785 | $5,108,992,161 | $7,612,083,035 | |
| Note: | ||||||||
| FTA formula funds (5307, 5337 and 5339) are based on estimated apportionments for FFY26-30. | ||||||||
| TIP programs and projects are based on the draft FY26-30 CIP and planned federal obligations as of Apr-25. Adjustments may be made to federal projects and budgets as the FY26-30 CIP is finalized. | ||||||||
| The Activity Line Item (ALI) codes are preliminary only and generally reflect the bulk of the TIP program. Within a program there may be several different ALI codes used. | ||||||||
| RRIF/TIFIA financing program funding is an initial estimate and will be refined as projects are identified and loans are finalized with the Build America Bureau. | ||||||||
| The "Green Line CIG-Core Capacity (Proposed Funding)" line item represents a preliminary estimate of the MBTA’s future FTA CIG-Core Capacity grant application and is a demonstration of the MBTA’s participation in the discretionary program. If awarded, this grant would support a number of Green Line Projects intended to increase system capacity by no less than 10%. Each Project will be funded by a combination of FTA Core Capacity grant funds, FTA Boston UZA formula funds and MBTA local match. This line item only reflects the proposed Core Capacity funding. Projects P0591, P1010, P0921, P1102, P1105, P0920, P1011, P1103, P1101, P1336, P0923, P1334, P0922, P1337, P1338, and P0924 are approved in the transit element of the endorsed FFY25-29 Boston Region TIP and the Transit Investment Report of the FFY25-29 Massachusetts STIP. These Projects are elements of the MBTA’s Core Capacity application and are identified in the table above. Through the MBTA CIP, Boston Region TIP, and Massachusetts STIP, MBTA has committed the use of $370,308,314 of Boston UZA 5307 formula funding to support the completion of these projects. Upon award, Projects, budgets, and funding sources will be amended as required. | ||||||||
Note:
FTA formula funds (5307, 5337 and 5339) are based on estimated apportionments for FFY25-29.
TIP programs and projects are based on the draft FY 2025-29 CIP and planned federal obligations as of April 24. Adjustments may be made to federal projects and budgets as the FY 2025-29 CIP is finalized.
The Activity Line Item (ALI) codes are preliminary only and generally reflect the bulk of the TIP program. Within a program there may be several different ALI codes used.
RRIF loan funding for the PTC/ATC/Fiber Resiliency project is based on the currently planned drawdown schedule and is subject to change.
RRIF/TIFIA financing program funding is an initial estimate and will be refined as projects are identified and loans are finalized with the Build America Bureau.
Table 3-9
FFYs 2025–29 TIP Transit Table (MBTA Federal Capital Program – Project List and Descriptions [80% Federal Share])
| 5307 - Bridge and Tunnel | |||||||
| 5307 | Bridge and Tunnel | P1107 | Bridge Program Pipeline - Rehabilitation, Repair and Replacement | $0 | $31,200,000 | $31,200,000 | This program uses information provided through the bridge inspection and load rating program to design and construct, prioritized bridge rehabilitation, repair, or replacement projects. |
| $0 | $31,200,000 | $31,200,000 | |||||
| 5307 - Revenue Vehicles | |||||||
| 5307 | Revenue Vehicles | P0369 | Green Line Type 10 Vehicle Replacement Program | $89,455,444 | $148,737,666 | $238,193,111 | Procurement of 102 new fully-accessible light rail vehicles and related infrastructure improvements to replace the existing Type 7 and Type 8 fleets, with additional optional cars available in the contract to support increased system capacity. |
| 5307 | Revenue Vehicles | P0618 | Procurement of 40ft Enhanced Electric Hybrid Buses | $16,638,809 | $65,254,827 | $81,893,636 | Procurement of up to 160 40ft Enhanced Electric Hybrid (EEH) buses to initiate the replacement of the 40ft diesel buses purchased in 2006-2008 and support more reliable, efficient, and sustainable operations. Includes vehicle testing, warranty, and inspection. |
| 5307 | Revenue Vehicles | P0633 | MBTA Catamaran Overhauls | $784,800 | $0 | $784,800 | Overhaul of two 149-passenger MBTA ferries, including spare parts, manuals, diagnostic equipment, tools, training, training aids, warranty, and all associated materials, equipment, and services to ensure reliability and operational efficiency. |
| 5307 | Revenue Vehicles | P0649 | Option Order Procurement of New Flyer Hybrid 40ft Buses | $0 | $0 | $0 | Procurement of 194 40ft buses with hybrid propulsion to replace an aging fleet and improve fuel economy. |
| 5307 | Revenue Vehicles | P0652 | Procurement of 100 Bi-Level Commuter Rail Coaches | $0 | $1,021,532 | $1,021,532 | Procurement of 100 Bi-Level Commuter Rail coaches to replace aging single-level coaches, expand capacity from 120 to 180 passengers per coach, reduce the number of coaches required, and mitigate operational bottlenecks. |
| 5307 | Revenue Vehicles | P0653 | Procurement of 40ft Battery Electric Buses and Related Infrastructure | $0 | $4,635,295 | $4,635,295 | Procurement of up to 460 40ft battery electric buses (BEBs), including an initial purchase of 80 buses, to support bus electrification and replace fleets currently running diesel bus service. |
| 5307 | Revenue Vehicles | P0860 | Hybrid Bus Overhaul (New Flyer XDE40 - SR 1881) | $0 | $1,440,000 | $1,440,000 | Midlife overhaul of major systems and components (engine, battery upgrade, drive unit, cooling systems, axles, brakes) of 60 40ft BAE hybrid buses to ensure reliable and safe operations and to meet FTA service life requirements. |
| 5307 | Revenue Vehicles | P0911 | Hybrid Bus Overhaul (New Flyer XDE40 - SR1983) | $38,094,961 | $0 | $38,094,961 | Midlife overhaul of major systems and components for 156 40ft hybrid buses to ensure reliable and safe operations that meet FTA requirements. |
| 5307 | Revenue Vehicles | P1154 | CNG Bus Overhaul (New Flyer XN40 - SR 1982) | $0 | $43,386,458 | $43,386,458 | Midlife overhaul of 175 40-foot New Flyer CNG buses delivered from 2016 to 2017. These buses require overhaul of major systems and components to ensure continued reliable and safe operations and to meet FTA service life requirements. |
| 5307 | Revenue Vehicles | P1155 | Hybrid Bus Overhaul (New Flyer XDE40 - SR 2011) | $800,000 | $30,518,228 | $31,318,228 | Midlife overhaul of 44 60-foot New Flyer hybrid buses delivered from 2016 to 2017. These buses require overhaul of major systems and components to ensure continued reliable and safe operations and to meet FTA service life requirements. |
| 5307 | Revenue Vehicles | P1162 | Reliability Centered Maintenance - Blue, Orange and Red Line | $0 | $28,320,000 | $28,320,000 | Improvements to trucks, brakes, motors, current collectors, propulsion, and auxiliary fuses on the Blue Line and improvements to propulsion, brakes, HVAC, and doors on the Red and Orange Lines. |
| $145,774,014 | $323,314,007 | $469,088,021 | |||||
| 5307 - Signals and Systems | |||||||
| 5307 | Signals and Systems | P0285 | Signal Program - Red/Orange Line | $40,820,968 | $2,800,000 | $43,620,968 | Replacement and upgrade of signal equipment on the Red and Orange Lines. Includes renewal of track circuit modules using latest digital audio frequency technology and replacement of wayside equipment. |
| 5307 | Signals and Systems | P0591 | Green Line Central Tunnel Track, Power, and Signal Replacement | $6,587,432 | $88,801,175 | $95,388,607 | Rehabilitation and upgrades to signal, track and power infrastructure within the Green Line Central Tunnel. Includes central instrumentation houses and signal, track, and power systems at Copley, Park Street, and Government Center. |
| 5307 | Signals and Systems | P0857 | Mattapan High-Speed Line Transformation | $12,411,960 | $79,216,536 | $91,628,495 | This project provides repairs, accessibility improvements, power upgrades, and other infrastructure investments on the Mattapan Line. |
| 5307 | Signals and Systems | P0912 | Systemwide Tunnel Flood Mitigation Program | $0 | $24,256,000 | $24,256,000 | This project provides planning, training, and infrastructure improvements for MBTA tunnels to improve their resiliency to flooding. |
| 5307 | Signals and Systems | P0912c | Silver Line Tunnel Flood Mitigation | $0 | $5,600,000 | $5,600,000 | Flood mitigation to protect identified vulnerabilities along the Silver Line agaisnt future flood events. |
| 5307 | Signals and Systems | P0921 | Green Line Type 10 Dedicated High-Speed Test Track | $0 | $8,875,194 | $8,875,194 | Design and construction of signal controlled crossovers on the Green Line D Branch between Chestnut Hill and Newton Centre Stations. These changes will accelerate the high-speed testing and limit impacts to revenue service. |
| 5307 | Signals and Systems | P0922 | Green Line Traction Power Upgrades for Increased Capacity (D Branch) | $0 | $8,000,000 | $8,000,000 | Traction power upgrades on Green Line D-Branch to address DC power system requirements for the future Type 10 trains. |
| 5307 | Signals and Systems | P0940 | Rail Modernization - Early Action Items | $0 | $12,000,000 | $12,000,000 | Design and construction of early action upgrades for power, track, stations, and accessibility on the Fairmount, Providence/Stoughton, Newburyport/Rockport, Haverhill, Fitchburg, and Lowell Lines to enhance service reliability, capacity, and accessibility. |
| 5307 | Signals and Systems | P1102 | Overhead Contact System Relocation for Type 10 Vehicles | $0 | $14,980,493 | $14,980,493 | Assessment of the overhead contact system (OCS) on the Green Line to identify areas out of compliance with the future Type 10 trains. This project will also establish systemwide standards for the location of the OCS and realign the OCS as necessary. |
| 5307 | Signals and Systems | P1105 | Type 10 Operator Simulator Installation | $0 | $5,125,598 | $5,125,598 | Construction of the space and infrastructure necessary to accommodate two Type 10 operator training simulators. |
| 5307 | Signals and Systems | P1210 | PILC-EPR Medium Voltage Cable Replacement Program | $0 | $11,800,000 | $11,800,000 | Replacement of medium voltage AC cables that are beyond their useful life between traction power substations to maintain a state of good repair and reduce lead exposure risk to employees. |
| 5307 | Signals and Systems | P1212 | Systemwide 15kV Feeder and Duct Bank Replacement | $0 | $22,809,809 | $22,809,809 | This project provides for the design and systemwide replacement of paper insulated lead-covered (PILC) power feeder cables with new cables containing Ethylene Propylene Rubber (EPR) to increase employee safety and power system resiliency. |
| 5307 | Signals and Systems | P1213 | Systemwide Power Control Equipment Upgrade | $0 | $12,000,000 | $12,000,000 | This project will provide equipment and fiber optic network upgrades to the MBTA power control system. |
| 5307 | Signals and Systems | P1418 | Transit Priority Plan Implementation | $0 | $12,000,000 | $12,000,000 | This program will construct transit priority infrastructure in support of the Bus Network Redesign High Frequency Network. |
| 5307 | Signals and Systems | P1433 | Rail Modernization - Newburyport/Rockport Line Electrification | $0 | $8,000,000 | $8,000,000 | Develop infrastructure for new battery-electric twenty-minute service on the Newburyport/Rockport Line, including a Traction Power Substation (TPSS) at North Station to provide a redundant subway feed and power a new electric ferry. |
| $59,820,360 | $316,264,804 | $376,085,164 | |||||
| 5307 - Stations and Facilities | |||||||
| 5307 | Stations and Facilities | P0066a | Quincy Adams Accessibility Improvements | $374,633 | $0 | $374,633 | Replacement of three existing elevators and addition of new elevator at Quincy Adams, according to ADA/BCIL requirements. Also includes upgrades to mechanical, communication, and safety systems, as well as wayfinding signage. |
| 5307 | Stations and Facilities | P0066e | Harvard/Central Elevator | $400,000 | $0 | $400,000 | Replacement of existing station elevator No. 821 at Harvard Square and No. 861 at Central Square on the Red Line, per ADA/BCIL requirements. Also includes replacement of central escalator No. 360. |
| 5307 | Stations and Facilities | P0066g | Downtown Crossing Elevator Phase 1 | $72,000 | $0 | $72,000 | Installation of two new elevators at Downtown Crossing to meet ADA and BCIL requirements. Includes exit gate improvements, creation of ‘points of safety’ with fire/smoke rated wall and door assemblies, and a new fire alarm system. |
| 5307 | Stations and Facilities | P0075 | Elevator Program Multiple Location Design | $0 | $6,222,034 | $6,222,034 | Design and some construction work for the replacement of elevators and/or addition of new, redundant elevators and related wayfinding amenities at transit stations. |
| 5307 | Stations and Facilities | P0104 | Charlestown Bus - Seawall Rehabilitation | $2,000,000 | $0 | $2,000,000 | Stabilization of the Mystic River shoreline and replacement of existing seawall to protect Charlestown Bus Facility from flooding. Includes a collaboration with Massachusetts DCR to build a multi-use public path along the seawall. |
| 5307 | Stations and Facilities | P0671a | Quincy Bus Facility Modernization | $34,746,701 | $5,292,521 | $40,039,222 | Relocation and replacement of the Quincy Bus Maintenance Facility. The new, modernized facility will expand capacity and includes the infrastructure necessary to support the MBTA's first battery-electric bus (BEB) fleet. |
| 5307 | Stations and Facilities | P0671b | Arborway Bus Facility - Design Funding | $0 | $6,800,000 | $6,800,000 | Design funding to support the construction of a new Arborway bus facility to accommodate battery electric bus (BEB) infrastructure and bus electrification. |
| 5307 | Stations and Facilities | P0912a | Airport Tunnel Portal Flood Protection | $0 | $16,398,322 | $16,398,322 | This project provides floodgates to the entrance of the Blue Line tunnel at the Airport portal to prevent flooding and includes upgrades to pump rooms and traction power systems. |
| 5307 | Stations and Facilities | P0912b | Systemwide Pump Room Upgrades | $0 | $1,920,000 | $1,920,000 | This project provides design services for improvements to rapid transit and Silver Line tunnel pump rooms, including State of Good Repair and control system upgrades. |
| 5307 | Stations and Facilities | P0920 | Green Line Maintenance Facilities and Yards | $0 | $8,000,000 | $8,000,000 | Assessment and design of improvements to the Reservoir, Riverside, Lake Street, and Inner Belt maintenance facilities and yards. These are needed to support the future Type 10 trains. |
| 5307 | Stations and Facilities | P0923 | E Branch Accessibility & Capacity Improvements | $0 | $44,817,443 | $44,817,443 | Accessibility improvements to stations and right-of-way upgrades on the E Branch of the Green Line from Brigham Circle to Heath Street Station. These improvements are needed to support future Type 10 trains. |
| 5307 | Stations and Facilities | P0924 | B Branch Accessibility & Infrastructure Improvements | $0 | $68,815,069 | $68,815,069 | This project will upgrade B Branch stations to accommodate 2-car Type 10 vehicles by adjusting track alignment, building accessible platforms, and enhancing traction power from Blandford Portal to Boston College. |
| 5307 | Stations and Facilities | P1010 | Riverside Vehicle Maintenance Facility Modifications and Upgrades | $0 | $53,900,556 | $53,900,556 | Upgrading of the Riverside Vehicle Maintenance Facility to support the future Type 10 trains. This project will improve maintenance efficiency, safety, and reliability. |
| 5307 | Stations and Facilities | P1011 | Inner Belt Vehicle Maintenance Facility Modifications & Upgrades | $0 | $4,220,360 | $4,220,360 | Design and installation of a new hoist at the Inner Belt Vehicle Maintenance Facility to accommodate the future Type 10 trains. This upgrade will enhance the facility’s maintenance capabilities and improve efficiency. |
| 5307 | Stations and Facilities | P1101 | Lake Street Complex Demolition and Reconfiguration | $0 | $23,446,916 | $23,446,916 | Demolition of the Lake Street facility and reconfiguration into an expanded yard. The site will be designed to maximize train storage, streamline yard operations, and eliminate a sharp curve in anticipation of the larger Type 10 light rail trains. |
| 5307 | Stations and Facilities | P1103 | Reservoir Yard and Non-Revenue Track Optimization and Reconfiguration | $0 | $24,424,868 | $24,424,868 | Reconfiguration of various track elements in the vicinity of Reservoir Yard, including the lower West yard, East/West Wye, Chestnut Hill Avenue connection, B Branch connection, and the non-revenue track around Cleveland Circle. |
| 5307 | Stations and Facilities | P1216 | Everett Building Floor Repairs | $0 | $15,031,457 | $15,031,457 | Floor repairs in the Everett Commuter Rail Maintenance Facility building. |
| 5307 | Stations and Facilities | P1225 | Systemwide Escalator and Elevator Replacement | $0 | $12,000,000 | $12,000,000 | This project provides for the systemwide replacement of escalators and elevators in poor condition with limited replacement part availability. |
| 5307 | Stations and Facilities | P1225a | Escalator Replacement and Maintenance - On Call Systemwide | $0 | $8,000,000 | $8,000,000 | Systemwide replacement of escalators to maintain a State of Good Repair. Escalators identified for replacement include those at Broadway and Andrew Stations. |
| 5307 | Stations and Facilities | P1232 | Green Line D Branch Enhanced Accessibility Improvements | $0 | $1,867,347 | $1,867,347 | Accessibility improvements on the Green Line D Branch to improve existing station entrances and increase accessibility. |
| 5307 | Stations and Facilities | P1334 | Riverside Yard Optimization Design | $0 | $3,200,000 | $3,200,000 | Reconfiguration of Riverside Yard to optimize storage capacity to accommodate the new Type 10 trains. |
| 5307 | Stations and Facilities | P1336 | Inner Belt Yard Expansion | $0 | $7,113,212 | $7,113,212 | Expansion of the Green Line Extension (GLX) Yard and adjacent construction of a new yard and Engineering & Maintenance building. |
| $37,593,335 | $311,470,104 | $349,063,439 | |||||
| 5337 - Bridge and Tunnel | |||||||
| 5337 | Bridge and Tunnel | P0006 | Gloucester Drawbridge Replacement | $2,650,223 | $0 | $2,650,223 | Replacement of Gloucester Drawbridge on the Rockport Line. The new bridge will consist of a moveable bascule span with two independent barrels, two spans of precast concrete box beams, a new steel superstructure, and a new micro-pile abutment. |
| 5337 | Bridge and Tunnel | P0008 | Emergency Bridge Design / Inspection & Rating | $1,393,050 | $28,282 | $1,421,332 | Funding to support as-needed emergency design, inspection, and rating of bridges. |
| 5337 | Bridge and Tunnel | P0009 | Bridges - Design | $7,106,499 | $0 | $7,106,499 | Design funding to support the repair, rehabilitation, and replacement of bridges across the system. |
| 5337 | Bridge and Tunnel | P0018 | North Station Draw 1 Bridge Replacement | $26,445,100 | $220,897,536 | $247,342,636 | Replacement of North Station Draw 1 moveable bridge structures and control tower. Includes construction of three new vertical lift bridges, extending an existing station platform to accommodate new station tracks 11 and 12, and track & signal improvements extending 1.5 miles from North Station. |
| 5337 | Bridge and Tunnel | P0495 | Bridge Bundling Contract | $7,200,000 | $0 | $7,200,000 | Replacement of six Commuter Rail bridges at Intervale Rd. in Weston; Bacon St. in Wellesley; High Line Bridge in Somerville; Lynn Fells Parkway in Melrose; Parker St. in Lawrence; and Commercial St. in Lynn. |
| 5337 | Bridge and Tunnel | P0551 | Longfellow Approach | $7,970,206 | $33,932,242 | $41,902,448 | Rehabilitation of Longfellow Approach viaduct, Span 1 of the Longfellow Bridge, and station platforms at Charles/MGH Station. Includes new track, power, communication and signal systems, and additional emergency egress and redundant elevators. |
| 5337 | Bridge and Tunnel | P0627 | Systemwide Bridge Inspection and Rating | $13,858,000 | $28,524,120 | $42,382,120 | Program to support in-depth inspection and load rating of MBTA-owned bridges at regular intervals. |
| 5337 | Bridge and Tunnel | P0892 | Saugus Drawbridge Replacement | $2,411,623 | $5,588,378 | $8,000,000 | Rehabilitation and maintenance of Saugus Drawbridge on the Newburyport/Rockport Line. |
| 5337 | Bridge and Tunnel | P1107 | Bridge Program Pipeline - Rehabilitation, Repair and Replacement | $7,429,627 | $7,610,373 | $15,040,000 | This program uses information provided through the bridge inspection and load rating program to design and construct, prioritized bridge rehabilitation, repair, or replacement projects. |
| 5337 | Bridge and Tunnel | P1116 | Systemwide Culvert Inspection and Load Rating | $2,088,187 | $5,120,000 | $7,208,187 | Inventory, inspection, and load rating of the MBTA's approx. 1,300 culverts supporting in-service structures systemwide. |
| 5337 | Bridge and Tunnel | R0074 | Tunnel Inspection Systemwide | $4,503,971 | $22,786,617 | $27,290,588 | Ongoing inspection and rating of Commuter Rail, Red Line, Orange Line, Green Line, and Blue Line tunnels. |
| $83,056,486 | $324,487,546 | $407,544,031 | |||||
| 5337 - Revenue Vehicles | |||||||
| 5337 | Revenue Vehicles | P0239 | F40 Commuter Rail Locomotive Overhaul | $0 | $13,052,716 | $13,052,716 | Overhaul of thirty-seven F40 Commuter Rail locomotives to enhance reliability and reduce the risk of unplanned maintenance. |
| 5337 | Revenue Vehicles | P0369 | Green Line Type 10 Vehicle Replacement Program | $0 | $175,148,906 | $175,148,906 | Procurement of 102 new fully-accessible light rail vehicles and related infrastructure improvements to replace the existing Type 7 and Type 8 fleets, with additional optional cars available in the contract to support increased system capacity. |
| 5337 | Revenue Vehicles | P0370 | Green Line Train Protection | $3,666,809 | $32,470,500 | $36,137,309 | Installation of equipment for a train protection and information system across the whole Green Line system. These improvements will enhance safety and reliability by mitigating red signal violations, train-to-train collisions, derailments, and intrusions into work zones. |
| 5337 | Revenue Vehicles | P0370a | Green Line Train Protection 2 (GLTPS2) | $55,821,183 | $0 | $55,821,183 | Implementation of a Train Protection System that will provide an auditable alarm and indicator light for collision avoidance, red signal violation protection, and speed enforcement for all Green Line cars. Type 9 and Type 10 cars will also include brake activation in the event of a violation. |
| 5337 | Revenue Vehicles | P0918 | Procurement of Passenger Locomotives - Future Fleet | $545,235 | $121,975,445 | $122,520,680 | Procurement of new Commuter Rail locomotives to replace the oldest vehicles in the fleet and ensure the reliability of service. |
| 5337 | Revenue Vehicles | P0927 | Rolling Stock - Locomotive and Coach State of Good Repair and Resilience | $0 | $19,120,000 | $19,120,000 | Programmatic mechanical improvements to increase reliability, correct system deficiencies, standardize maintenance systems, and improve equipment availability for Commuter Rail rolling stock, ensuring a State of Good Repair. |
| 5337 | Revenue Vehicles | P1173 | HSP46 Locomotive Overhaul | $13,454,701 | $109,817,557 | $123,272,258 | Midlife overhaul of 40 HSP46 Locomotives to improve reliability and reduce risk of unplanned maintenance. |
| $73,487,927 | $471,585,124 | $545,073,052 | |||||
| 5337 - Signals and Systems | |||||||
| 5337 | Signals and Systems | P0139 | Orange Line Traction Power Upgrade | $0 | $7,840,000 | $7,840,000 | Major renovation of four aging Orange Line traction power substations at Oak Grove, Malden Center, Sullivan and Wellington. Work includes total replacement of the traction power electrical systems, as well as minor repairs to other systems. |
| 5337 | Signals and Systems | P0146 | SCADA Upgrades | $0 | $1,600,000 | $1,600,000 | Upgrades to the Power Supervisory Control and Data Acquisition (SCADA) communication network from leased lines to the Security Wide Area Network (SWAN) to provide high-speed ethernet connection at 24 traction power substations and unit substations. |
| 5337 | Signals and Systems | P0261 | Worcester Line Track and Station Accessibility Improvements | $7,883,530 | $16,282,809 | $24,166,339 | New third track and realignment of existing tracks on the Framingham and Worcester Commuter Rail lines between Weston and Framingham. Includes upgrades to Wellesley Farms, Wellesley Hills, Wellesley Square, and West Natick Stations. |
| 5337 | Signals and Systems | P0283 | Green Line Central Tunnel Signal - 25 Cycle | $3,840,000 | $0 | $3,840,000 | Replacement of 25Hz track circuits with 100Hz track circuits in the Green Line central tunnel. Includes replacement of track circuit cable, trough, messenger, cases, relays, rectifiers, and signal power equipment. |
| 5337 | Signals and Systems | P0285 | Signal Program - Red/Orange Line | $33,333,334 | $34,666,666 | $68,000,000 | Replacement and upgrade of signal equipment on the Red and Orange Lines. Includes renewal of track circuit modules using latest digital audio frequency technology and replacement of wayside equipment. |
| 5337 | Signals and Systems | P0301 | Systemwide Radio | $0 | $54,894,533 | $54,894,533 | Upgrade of the MBTA’s existing two-way radio system used by MBTA Transit Police and operations personnel. This project includes mobile radios for heavy rail, light rail, and bus vehicles. |
| 5337 | Signals and Systems | P0675 | Orange Line Southwest Corridor Modernization | $0 | $16,960,000 | $16,960,000 | This project will design and reconstruct track and support systems on the Southwest Corridor of the Orange Line between Chinatown and Forest Hills Stations. Initial work will include construction of truck pads at Cedar Street and Green Street. |
| 5337 | Signals and Systems | P1117 | Systemwide Fire Suppression Systems Repairs | $0 | $16,000,000 | $16,000,000 | Replacement and upgrade of fire-suppression systems. Includes replacement of standpipe system at Braintree Station, and replacement of sprinkler systems at Albany Bus garage, Andrew Station and Charlestown Building No. 14. |
| 5337 | Signals and Systems | P1132 | Ashmont Branch Track Replacement | $0 | $4,000,000 | $4,000,000 | Design and construction for partial reconstruction of track and track support systems on the Ashmont Branch of the Red Line. |
| 5337 | Signals and Systems | P1139 | Asset Management Program | $3,047,474 | $31,269,322 | $34,316,795 | Continued implementation of the MBTA Asset Management Program in accordance with FTA requirements, including asset inventory and condition assessments, updates to the National Transit Database and the Transit Asset Management Plan, and EAMS implementation. |
| 5337 | Signals and Systems | P1315 | Fairmount Line Infrastructure for Decarbonized Service | $8,160,000 | $39,788,800 | $47,948,800 | Infrastructure upgrades to support decarbonized 20-minute service on the Fairmount Line, enhancing sustainability, frequency, and reliability. |
| 5337 | Signals and Systems | P1404 | Blue Line Auxiliary Power Supply Units Replacement | $0 | $12,868,232 | $12,868,232 | Replacement of obsolete Auxillary Power Supply (APS) units on Blue Line vehicles to reduce the risk of failure and extend the useful life of these vehicles. |
| 5337 | Signals and Systems | P1419 | Kendall Crossover | $0 | $4,800,000 | $4,800,000 | Replacement of the existing hand-throw crossover north of Kendall Station with a fully signalized universal crossover south of Kendall Station to improve operational flexibility, shorten diversion limits, and reduce construction costs on the northern Red Line right-of-way. |
| $56,264,338 | $240,970,361 | $297,234,699 | |||||
| 5337 - Stations and Facilities | |||||||
| 5337 | Stations and Facilities | P0003 | Green Line B Branch Consolidation | $0 | $295,716 | $295,716 | Consolidation of four Green Line B-Branch stops into two new, fully accessible stations: Babcock Street and Amory Street. Features include accessible boarding and exits, security and lighting upgrades, and longer platforms to accommodate the new Type 10 trains. |
| 5337 | Stations and Facilities | P0066 | Elevator Program | $1,218,320 | $0 | $1,218,320 | Design and construction funding for elevator improvements on the rapid transit system. Individual elevator projects are separated into unique projects once construction stage is reached. |
| 5337 | Stations and Facilities | P0076 | Oak Grove Station Vertical Transportation Improvements | $1,028,000 | $0 | $1,028,000 | Accessibility upgrades at Oak Grove station, including three elevators, replacement of one existing elevator, sidewalk repairs, and wayfinding and station-brightening improvements. |
| 5337 | Stations and Facilities | P0087 | Braintree and Quincy Adams Garage Rehabilitation | $3,424,745 | $0 | $3,424,745 | Full rehabilitation of the Red Line’s Braintree Station and Quincy Adams Station parking garages to extend the operable service life of each facility by forty years. |
| 5337 | Stations and Facilities | P0097 | 45 High Street - Data Center Upgrades | $0 | $800,000 | $800,000 | Upgrades to data servers and renovations of the 4th floor at 45 High St. and the fire command center located in the building's lobby, including additional life-safety improvements. |
| 5337 | Stations and Facilities | P0129 | Newton Highlands Green Line Station Accessibility Project | $5,578,201 | $47,194,634 | $52,772,835 | Accessibility improvements at Newton Highlands Station on the Green Line D Branch, including ramps covered with canopies, raised platforms, one at-grade pedestrian crossing, site lighting, new platform shelter, and covered bike racks. |
| 5337 | Stations and Facilities | P0163 | Forest Hills Improvement Project | $4,965,762 | $21,124,002 | $26,089,764 | Design and construction of of various upgrades at Forest Hills Station to deliver improved accessibility, safety, and comfort for riders. |
| 5337 | Stations and Facilities | P0168 | Symphony Station Improvements | $13,200,000 | $10,339,619 | $23,539,619 | Upgrade Symphony Station to a modern and fully accessible passenger facility. Includes construction of four new elevators, raised platforms, accessible restrooms, installation of egress stairs, and upgraded fire alarm systems. |
| 5337 | Stations and Facilities | P0174 | Natick Center Station Accessibility Improvements | $8,047,998 | $0 | $8,047,998 | Reconstruction and modernization of Natick Center Station, including new fully accessible high-level side platforms,elevators, ramps, stairs, lighting, wayfinding, streetscape, upgraded tracks, and a connection to the Cochituate Rail Trail. |
| 5337 | Stations and Facilities | P0395 | Worcester Union Station Accessibility and Infrastructure Improvements | $2,841,410 | $0 | $2,841,410 | Includes high-level center platform with elevators, ramps, and stairs; replacement and realignment of station tracks; and construction of a new rail crossover (CP-44) to improve accessibility, operations, and service capacity at Worcester Union Station. |
| 5337 | Stations and Facilities | P0631b | Blue Line Comm Rooms & Suffolk Downs Platform-Stair Repair | $1,667,917 | $13,666,249 | $15,334,166 | Rehabilitation of communications rooms along the Blue Line to bring them into a state of good repair and support the implementation of Fare Transformation. |
| 5337 | Stations and Facilities | P0679 | Codman Yard Expansion and Improvements | $29,103,412 | $18,919,744 | $48,023,156 | Improvements to Codman Yard, including in-kind replacement of existing infrastructure and the expansion of storage capacity to support the new Red Line trains. |
| 5337 | Stations and Facilities | P0970 | Attleboro Station Improvements (GATRA) | $736,489 | $0 | $736,489 | This project includes platform reconstruction, stair and ramp repairs, and path-of-travel improvements at the Attleboro Station and includes collaboration with GATRA on improvements to the station area. |
| 5337 | Stations and Facilities | P1009a | B Branch Short Term Accessibility Improvements | $0 | $15,315,806 | $15,315,806 | This project will upgrade all inaccessible station platforms along Commonwealth Avenue on the B Branch. It includes design and construction for Blandford St., Packard’s Corner, Warren St., Griggs St., Allston St., Sutherland Rd., Chiswick Rd., Chestnut Hill Ave., and South St. |
| 5337 | Stations and Facilities | P1025 | Lynn Station Parking Garage Deconstruction | $633,455 | $17,716,781 | $18,350,236 | Decommissioning of the partially closed Lynn Station parking garage. |
| 5337 | Stations and Facilities | P1144b | BET Roof and HVAC Replacement | $0 | $6,240,000 | $6,240,000 | Replacement of a 400-square-foot roof at the Boston Engine Terminal (BET) maintenance facility in Somerville with a new 25-year roofing system to ensure long-term durability and protection. |
| 5337 | Stations and Facilities | P1171 | Billerica MOW Repair and Storage Facility | $0 | $880,000 | $880,000 | Funds to design and construct a new, fully accessible Commuter Rail maintenance facility, storage yards, and tracks in Billerica, with eight service bays, wash bay, overhead bridge crane, office space, and employee amenities. |
| 5337 | Stations and Facilities | P1249 | Jackson Square Station Accessibility Improvements | $0 | $1,600,000 | $1,600,000 | Accessibility improvements at Jackson Square Station on the Orange Line, including construction of a new elevator and modernization of existing elevator. |
| 5337 | Stations and Facilities | P1339 | Waverley Station Accessibility Improvements Assessment | $249,600 | $0 | $249,600 | Accessibility upgrades to the Fitchburg Line's Waverly Station in Belmont. |
| 5337 | Stations and Facilities | P1409 | Temporary Station Platform Procurement and Installation | $0 | $6,960,000 | $6,960,000 | Procurement and installation of temporary platforms and ramps at Foxboro Station for special events. Temporary platforms and ramps will be re-deployed across the Commuter Rail system for other special events, as needed. |
| 5337 | Stations and Facilities | R0069 | Park Street Station Wayfinding Improvements | $1,650,033 | $0 | $1,650,033 | Various improvements to lighting, CCTV placement, wayfinding and illuminated exit signage, Braille signage, floor finishes, benches, and 24 staircases at Park Street. Includes artwork restoration and reopening of Tremont Street's Temple Place stairs. |
| 5337 | Stations and Facilities | R0071 | Lynn Station Phase 2 | $0 | $2,581,808 | $2,581,808 | Design funding for new elevators, stairs, platform, canopy, and architectural improvements to the station and the intent to acquire and demolish structures under station's viaduct. Existing parking garage will also be replaced by surface parking. |
| $74,345,341 | $163,634,359 | $237,979,700 | |||||
| 5339 - Bus Program | |||||||
| 5339 | Bus Program | P0911 | Hybrid Bus Overhaul (New Flyer XDE40 - SR1983) | $11,803,343 | $32,242,621 | $44,045,964 | Midlife overhaul of major systems and components for 156 40ft hybrid buses to ensure reliable and safe operations that meet FTA requirements. |
| 5339 | Bus Program | P1155 | Hybrid Bus Overhaul (New Flyer XDE40 - SR 2011) | $6,636,074 | $0 | $6,636,074 | Midlife overhaul of 44 60-foot New Flyer hybrid buses delivered from 2016 to 2017. These buses require overhaul of major systems and components to ensure continued reliable and safe operations and to meet FTA service life requirements. |
| $18,439,417 | $32,242,621 | $50,682,038 | |||||
| Note: Project descriptions and dollar amounts are preliminary only and are provided for informational purposes. In many cases, the scopes of work and project budgets will become more fully developed as the design process proceeds and is completed. The MBTA may also opt to fund a project from a different FTA funding source based on the timing of projects and the availability of FTA funds. | |||||||
| Capital Investment Grant / Core Capacity Program | |||||||
| FTA 5307 Formula Funds Currently in the TIP (80% Federal Share) - April 2025 | |||||||
| CC ID | TIP Program | CIP # | Project Name | FFY25 | FFY26-30 | Total (Federal) | Core Capacity ID# |
| 5307 | Signals and Systems | P0591 | Green Line Central Tunnel Track, Power, and Signal Replacement | $6,587,432 | $88,801,175 | $95,388,607 | 1, 17 |
| 5307 | Stations and Facilities | P1010 | Riverside Vehicle Maintenance Facility Modifications and Upgrades | $0 | $53,900,556 | $53,900,556 | 2, 18 |
| 5307 | Signals and Systems | P0921 | Green Line Type 10 Dedicated High-Speed Test Track | $0 | $8,875,194 | $8,875,194 | 3 |
| 5307 | Signals and Systems | P1102 | Overhead Contact System Relocation for Type 10 Vehicles | $0 | $14,980,493 | $14,980,493 | 4 |
| 5307 | Signals and Systems | P1105 | Type 10 Operator Simulator Installation | $0 | $5,125,598 | $5,125,598 | 5 |
| 5307 | Stations and Facilities | P0920 | Green Line Maintenance Facilities and Yards | $0 | $8,000,000 | $8,000,000 | N/A |
| 5307 | Stations and Facilities | P1011 | Inner Belt Vehicle Maintenance Facility Modifications & Upgrades | $0 | $4,220,360 | $4,220,360 | 7 |
| 5307 | Stations and Facilities | P1103 | Reservoir Yard and Non-Revenue Track Optimization and Reconfiguration | $0 | $24,424,868 | $24,424,868 | 8 |
| 5307 | Stations and Facilities | P1101 | Lake Street Complex Demolition and Reconfiguration | $0 | $23,446,916 | $23,446,916 | 9 |
| 5307 | Stations and Facilities | P1336 | Inner Belt Yard Expansion | $0 | $7,113,212 | $7,113,212 | 10 |
| 5307 | Stations and Facilities | P0923 | E Branch Accessibility & Capacity Improvements | $0 | $44,817,443 | $44,817,443 | 11 |
| 5307 | Stations and Facilities | P1334 | Riverside Yard Optimization Design | $0 | $3,200,000 | $3,200,000 | 12 |
| 5307 | Signals and Systems | P0922 | Green Line Traction Power Upgrades for Increased Capacity (D Branch) | $0 | $8,000,000 | $8,000,000 | 13 |
| P1337 | GL Type 10 Light Rail Fleet Replacement - Option Cars (58 Cars) | $0 | $0 | $0 | 14 | ||
| P1338 | Reservoir VMF Modifications & Upgrades | $0 | $0 | $0 | 15 | ||
| 5307 | Stations and Facilities | P0924 | B Branch Accessibility & Infrastructure Improvements | $0 | $68,815,069 | $68,815,069 | 16a, b, c |
| $6,587,432 | $363,720,882 | $370,308,314 | |||||
| Note: The "Green Line CIG-Core Capacity (Proposed Funding)" line item represents a preliminary estimate of the MBTA’s future FTA CIG-Core Capacity grant application and is a demonstration of the MBTA’s participation in the discretionary program. If awarded, this grant would support a number of Green Line Projects intended to increase system capacity by no less than 10%. Each Project will be funded by a combination of FTA Core Capacity grant funds, FTA Boston UZA formula funds and MBTA local match. This line item only reflects the proposed Core Capacity funding. Projects P0591, P1010, P0921, P1102, P1105, P0920, P1011, P1103, P1101, P1336, P0923, P1334, P0922, P1337, P1338, and P0924 are approved in the transit element of the endorsed FFY25-29 Boston Region TIP and the Transit Investment Report of the FFY25-29 Massachusetts STIP. These Projects are elements of the MBTA’s Core Capacity application and are identified in the table above. Through the MBTA CIP, Boston Region TIP, and Massachusetts STIP, MBTA has committed the use of $370,308,314 of Boston UZA 5307 formula funding to support the completion of these projects. Upon award, Projects, budgets, and funding sources will be amended as required. | |||||||
| RRIF/TIFIA Financing Program | |||||||
| Projects Potentially Funded by Federal RRIF/TIFIA Loans | |||||||
| TIP Program | CIP ID# | Project Name | Loan Amount and Timing - TBD | Project Description | |||
| RRIF/TIFIA Financing | P0671a | Quincy Bus Facility Modernization | Potential RRIF/TIFIA loan - amount and timing to be determined | Relocation and replacement of the Quincy Bus Maintenance Facility. The new, modernized facility will expand capacity and includes the infrastructure necessary to support the MBTA's first battery-electric bus (BEB) fleet. | |||
| RRIF/TIFIA Financing | P0952 | Widett Layover and Maintenance Facility | Potential RRIF/TIFIA loan - amount and timing to be determined | Preliminary design for a Commuter Rail layover facility at Widett Circle in South Boston. | |||
| RRIF/TIFIA Financing | P0170 | Newtonville Station | Potential RRIF/TIFIA loan - amount and timing to be determined | Design and construction of a fully accessible Newtonville Commuter Rail Station with 400 ft. high-level double-sided platforms. | |||
| RRIF/TIFIA Financing | P0178 | South Attleboro Station Improvements | Potential RRIF/TIFIA loan - amount and timing to be determined | Design for the construction of a new South Attleboro station, to include 800-ft. high-level platforms, three elevators, platform access ramps, a bus bay, egress to Newport Ave., additional parking, improved vehicular circulation, updated lighting. | |||
| RRIF/TIFIA Financing | P0863 | South-Side Commuter Rail Maintenance Facility | Potential RRIF/TIFIA loan - amount and timing to be determined | Assessment and design for a new Commuter Rail maintenance and layover facility at Readville. Includes design for future construction of multiple maintenance bays within Yard 1 and Upper Yard 2. | |||
| Note: The MBTA is exploring the use of federal loans through the Build America Bureau to finance certain capital projects at a lower interest rate than traditional tax-exempt bonds. This includes loans under the Railroad Rehabilitation & Improvement Financing (RRIF) and Transportation Infrastructure Finance and Innovation Act (TIFIA) programs. The projects listed above are being considered for this program, subject to the approval of funding through the CIP process. Additional project and funding information will be provided through a future TIP/Amendment if federal grant funds or loans are utilized. | |||||||
Note: Project descriptions and dollar amounts are preliminary only and are provided for informational purposes. In many cases, the scopes of work and project budgets will become more fully developed as the design process proceeds and is completed. The MBTA may also opt to fund a project from a different FTA funding source based on the timing of projects and the availability of FTA funds.
Table 3-10
FFYs 2025–29 TIP Transit Table (MWRTA)
| STIP: 2026 - 2030 (D) | |||||||||
| Year | MassDOT Project ID | Program | MassDOT Project Description | Funding Source | Total Project Cost | Total Programmed Funds | Federal Funds | State Funds | Other Funds |
| Federal Fiscal Year 2026 | $12,500,000 | $7,720,000 | $4,780,000 | ||||||
| MetroWest Regional Transit Authority | $12,500,000 | $7,720,000 | $4,780,000 | ||||||
| 2026 | MWRTA011707 | RTA Facility & System Modernization | METROWEST RTA- BLANDIN HUB OPERATIONS AND MAINTENANCE EXPANSION - CONSTRUCTION | 5307 | $12,500,000 | $500,000 | $500,000 | ||
| 2026 | MWRTA011707 | RTA Facility & System Modernization | METROWEST RTA- BLANDIN HUB OPERATIONS AND MAINTENANCE EXPANSION - CONSTRUCTION | RTACAP | $12,500,000 | $500,000 | $500,000 | ||
| 2026 | MWRTA011815 | RTA Facility & System Modernization | MetroWest RTA - BLANDIN HUB OPERATIONS AND MAINTENANCE EXPANSION - DESIGN | 5307 | $3,000,000 | $750,000 | $750,000 | ||
| 2026 | MWRTA011815 | RTA Facility & System Modernization | MetroWest RTA - BLANDIN HUB OPERATIONS AND MAINTENANCE EXPANSION - DESIGN | TDC | $3,000,000 | $150,000 | $150,000 | ||
| 2026 | MWRTA011948 | RTA Fleet Upgrades | METROWEST RTA- ACQUIRE HEAVY DUTY 30 FOOT REVENUE VEHICLE | 5307 | $12,600,000 | $2,100,000 | $2,100,000 | ||
| 2026 | MWRTA011948 | RTA Fleet Upgrades | METROWEST RTA- ACQUIRE HEAVY DUTY 30 FOOT REVENUE VEHICLE | RTACAP | $12,600,000 | $2,100,000 | $2,100,000 | ||
| 2026 | RTD0011117 | RTA Facility & Vehicle Maintenance | MetroWest RTA - TERMINAL, INTERMODAL (TRANSIT) - BLANDIN | 5307 | $1,200,000 | $960,000 | $960,000 | ||
| 2026 | RTD0011117 | RTA Facility & Vehicle Maintenance | MetroWest RTA - TERMINAL, INTERMODAL (TRANSIT) - BLANDIN | RTACAP | $1,200,000 | $240,000 | $240,000 | ||
| 2026 | RTD0011118 | RTA Facility & System Modernization | MetroWest Regional Transit Authority - TECHNOLOGY SUPPORT/CAPITAL OUTREACH | 5307 | $300,000 | $150,000 | $150,000 | ||
| 2026 | RTD0011118 | RTA Facility & System Modernization | MetroWest Regional Transit Authority - TECHNOLOGY SUPPORT/CAPITAL OUTREACH | RTACAP | $300,000 | $150,000 | $150,000 | ||
| 2026 | RTD0011119 | RTA Facility & Vehicle Maintenance | MetroWest RTA - ACQUISITION OF BUS SUPPORT EQUIP/FACILITIES | 5307 | $450,000 | $360,000 | $360,000 | ||
| 2026 | RTD0011119 | RTA Facility & Vehicle Maintenance | MetroWest RTA - ACQUISITION OF BUS SUPPORT EQUIP/FACILITIES | RTACAP | $450,000 | $90,000 | $90,000 | ||
| 2026 | RTD0011125 | RTA Facility & System Modernization | MetroWest RTA - 2026 ELECTRIC VEHICLE (EV) ADDTL ELECTRIFICATION COSTS | 5307 | $1,000,000 | $500,000 | $500,000 | ||
| 2026 | RTD0011125 | RTA Facility & System Modernization | MetroWest RTA - 2026 ELECTRIC VEHICLE (EV) ADDTL ELECTRIFICATION COSTS | RTACAP | $1,000,000 | $500,000 | $500,000 | ||
| 2026 | RTD0011134 | RTA Facility & Vehicle Maintenance | MetroWest RTA - RESTROOMS AT BLANDIN & FCRS HUBS - 5307 | 5307 | $500,000 | $200,000 | $200,000 | ||
| 2026 | RTD0011134 | RTA Facility & Vehicle Maintenance | MetroWest RTA - RESTROOMS AT BLANDIN & FCRS HUBS - 5307 | DRTACAP | $500,000 | $50,000 | $50,000 | ||
| 2026 | RTD0011137 | RTA Vehicle Replacement | MetroWest RTA - ACQUIRE REVENUE REPLACEMENT VEHICLES CUTAWAYS TYPE D CNG Consider For Statewide 5339 Funds | 5307 | $6,800,000 | $600,000 | $600,000 | ||
| 2026 | RTD0011137 | RTA Vehicle Replacement | MetroWest RTA - ACQUIRE REVENUE REPLACEMENT VEHICLES CUTAWAYS TYPE D CNG Consider For Statewide 5339 Funds | RTACAP | $6,800,000 | $600,000 | $600,000 | ||
| 2026 | RTD0011195 | Operating | MetroWest Regional Transit Authority - OPERATING ASSISTANCE NON FIXED ROUTE ADA PARA SERV | 5307 | $10,000,000 | $1,600,000 | $1,600,000 | ||
| 2026 | RTD0011195 | Operating | MetroWest Regional Transit Authority - OPERATING ASSISTANCE NON FIXED ROUTE ADA PARA SERV | SCA | $10,000,000 | $400,000 | $400,000 | ||
| Federal Fiscal Year 2027 | $25,350,000 | $16,385,000 | $8,965,000 | ||||||
| MetroWest Regional Transit Authority | $25,350,000 | $16,385,000 | $8,965,000 | ||||||
| 2027 | MWRTA011701 | RTA Facility & System Modernization | METROWEST RTA- DISCRETIONARY SMART EV SOLAR INFRASTRUCTURE PROJECT PHASE TWO | DOF | $18,750,000 | $8,000,000 | $8,000,000 | ||
| 2027 | MWRTA011701 | RTA Facility & System Modernization | METROWEST RTA- DISCRETIONARY SMART EV SOLAR INFRASTRUCTURE PROJECT PHASE TWO | DRTACAP | $18,750,000 | $2,000,000 | $2,000,000 | ||
| 2027 | MWRTA011707 | RTA Facility & System Modernization | METROWEST RTA- BLANDIN HUB OPERATIONS AND MAINTENANCE EXPANSION - CONSTRUCTION | 5307 | $12,500,000 | $3,500,000 | $3,500,000 | ||
| 2027 | MWRTA011707 | RTA Facility & System Modernization | METROWEST RTA- BLANDIN HUB OPERATIONS AND MAINTENANCE EXPANSION - CONSTRUCTION | RTACAP | $12,500,000 | $3,500,000 | $3,500,000 | ||
| 2027 | MWRTA011708 | RTA Facility & System Modernization | METROWEST RTA- TECHNICAL ASSISTANCE HYDROGEN DEPLOYMENT | RTACAP | $1,000,000 | $500,000 | $500,000 | ||
| 2027 | MWRTA011948 | RTA Fleet Upgrades | METROWEST RTA- ACQUIRE HEAVY DUTY 30 FOOT REVENUE VEHICLE | 5307 | $12,600,000 | $1,050,000 | $1,050,000 | ||
| 2027 | MWRTA011948 | RTA Fleet Upgrades | METROWEST RTA- ACQUIRE HEAVY DUTY 30 FOOT REVENUE VEHICLE | RTACAP | $12,600,000 | $1,050,000 | $1,050,000 | ||
| 2027 | RTD0011137 | RTA Vehicle Replacement | MetroWest RTA - ACQUIRE REVENUE REPLACEMENT VEHICLES CUTAWAYS TYPE D CNG Consider For Statewide 5339 Funds | 5307 | $6,800,000 | $600,000 | $600,000 | ||
| 2027 | RTD0011137 | RTA Vehicle Replacement | MetroWest RTA - ACQUIRE REVENUE REPLACEMENT VEHICLES CUTAWAYS TYPE D CNG Consider For Statewide 5339 Funds | RTACAP | $6,800,000 | $600,000 | $600,000 | ||
| 2027 | RTD0011195 | Operating | MetroWest Regional Transit Authority - OPERATING ASSISTANCE NON FIXED ROUTE ADA PARA SERV | 5307 | $10,000,000 | $1,600,000 | $1,600,000 | ||
| 2027 | RTD0011195 | Operating | MetroWest Regional Transit Authority - OPERATING ASSISTANCE NON FIXED ROUTE ADA PARA SERV | SCA | $10,000,000 | $400,000 | $400,000 | ||
| 2027 | RTD0011196 | RTA Facility & Vehicle Maintenance | MetroWest RTA - TERMINAL, INTERMODAL (TRANSIT) - BLANDIN/FCRS | 5307 | $3,000,000 | $600,000 | $600,000 | ||
| 2027 | RTD0011196 | RTA Facility & Vehicle Maintenance | MetroWest RTA - TERMINAL, INTERMODAL (TRANSIT) - BLANDIN/FCRS | RTACAP | $3,000,000 | $150,000 | $150,000 | ||
| 2027 | RTD0011197 | RTA Facility & Vehicle Maintenance | MetroWest Regional Transit Authority - TECHNOLOGY SUPPORT/CAPITAL OUTREACH | 5307 | $1,400,000 | $175,000 | $175,000 | ||
| 2027 | RTD0011197 | RTA Facility & Vehicle Maintenance | MetroWest Regional Transit Authority - TECHNOLOGY SUPPORT/CAPITAL OUTREACH | RTACAP | $1,400,000 | $175,000 | $175,000 | ||
| 2027 | RTD0011198 | RTA Facility & Vehicle Maintenance | MetroWest RTA - ACQUISITION OF BUS SUPPORT EQUIP/FACILITIES | 5307 | $1,800,000 | $360,000 | $360,000 | ||
| 2027 | RTD0011198 | RTA Facility & Vehicle Maintenance | MetroWest RTA - ACQUISITION OF BUS SUPPORT EQUIP/FACILITIES | RTACAP | $1,800,000 | $90,000 | $90,000 | ||
| 2027 | RTD0011267 | RTA Facility & System Modernization | MetroWest RTA - EV - Additional Electrification Infrastructure | 5307 | $4,000,000 | $500,000 | $500,000 | ||
| 2027 | RTD0011267 | RTA Facility & System Modernization | MetroWest RTA - EV - Additional Electrification Infrastructure | RTACAP | $4,000,000 | $500,000 | $500,000 | ||
| Federal Fiscal Year 2028 | $33,600,000 | $26,135,000 | $7,465,000 | ||||||
| MetroWest Regional Transit Authority | $33,600,000 | $26,135,000 | $7,465,000 | ||||||
| 2028 | MWRTA011701 | RTA Facility & System Modernization | METROWEST RTA- DISCRETIONARY SMART EV SOLAR INFRASTRUCTURE PROJECT PHASE TWO | DOF | $18,750,000 | $7,000,000 | $7,000,000 | ||
| 2028 | MWRTA011701 | RTA Facility & System Modernization | METROWEST RTA- DISCRETIONARY SMART EV SOLAR INFRASTRUCTURE PROJECT PHASE TWO | DRTACAP | $18,750,000 | $1,750,000 | $1,750,000 | ||
| 2028 | MWRTA011705 | RTA Facility & System Modernization | METROWEST RTA - PASSENGER TRANSFER STATION | 5339D | $30,000,000 | $12,000,000 | $12,000,000 | ||
| 2028 | MWRTA011707 | RTA Facility & System Modernization | METROWEST RTA- BLANDIN HUB OPERATIONS AND MAINTENANCE EXPANSION - CONSTRUCTION | 5307 | $12,500,000 | $2,250,000 | $2,250,000 | ||
| 2028 | MWRTA011707 | RTA Facility & System Modernization | METROWEST RTA- BLANDIN HUB OPERATIONS AND MAINTENANCE EXPANSION - CONSTRUCTION | RTACAP | $12,500,000 | $2,250,000 | $2,250,000 | ||
| 2028 | MWRTA011708 | RTA Facility & System Modernization | METROWEST RTA- TECHNICAL ASSISTANCE HYDROGEN DEPLOYMENT | RTACAP | $1,000,000 | $500,000 | $500,000 | ||
| 2028 | MWRTA011948 | RTA Fleet Upgrades | METROWEST RTA- ACQUIRE HEAVY DUTY 30 FOOT REVENUE VEHICLE | 5307 | $12,600,000 | $1,050,000 | $1,050,000 | ||
| 2028 | MWRTA011948 | RTA Fleet Upgrades | METROWEST RTA- ACQUIRE HEAVY DUTY 30 FOOT REVENUE VEHICLE | RTACAP | $12,600,000 | $1,050,000 | $1,050,000 | ||
| 2028 | RTD0011137 | RTA Vehicle Replacement | MetroWest RTA - ACQUIRE REVENUE REPLACEMENT VEHICLES CUTAWAYS TYPE D CNG Consider For Statewide 5339 Funds | 5307 | $6,800,000 | $600,000 | $600,000 | ||
| 2028 | RTD0011137 | RTA Vehicle Replacement | MetroWest RTA - ACQUIRE REVENUE REPLACEMENT VEHICLES CUTAWAYS TYPE D CNG Consider For Statewide 5339 Funds | RTACAP | $6,800,000 | $600,000 | $600,000 | ||
| 2028 | RTD0011195 | Operating | MetroWest Regional Transit Authority - OPERATING ASSISTANCE NON FIXED ROUTE ADA PARA SERV | 5307 | $10,000,000 | $1,600,000 | $1,600,000 | ||
| 2028 | RTD0011195 | Operating | MetroWest Regional Transit Authority - OPERATING ASSISTANCE NON FIXED ROUTE ADA PARA SERV | SCA | $10,000,000 | $400,000 | $400,000 | ||
| 2028 | RTD0011196 | RTA Facility & Vehicle Maintenance | MetroWest RTA - TERMINAL, INTERMODAL (TRANSIT) - BLANDIN/FCRS | 5307 | $3,000,000 | $600,000 | $600,000 | ||
| 2028 | RTD0011196 | RTA Facility & Vehicle Maintenance | MetroWest RTA - TERMINAL, INTERMODAL (TRANSIT) - BLANDIN/FCRS | RTACAP | $3,000,000 | $150,000 | $150,000 | ||
| 2028 | RTD0011197 | RTA Facility & Vehicle Maintenance | MetroWest Regional Transit Authority - TECHNOLOGY SUPPORT/CAPITAL OUTREACH | 5307 | $1,400,000 | $175,000 | $175,000 | ||
| 2028 | RTD0011197 | RTA Facility & Vehicle Maintenance | MetroWest Regional Transit Authority - TECHNOLOGY SUPPORT/CAPITAL OUTREACH | RTACAP | $1,400,000 | $175,000 | $175,000 | ||
| 2028 | RTD0011198 | RTA Facility & Vehicle Maintenance | MetroWest RTA - ACQUISITION OF BUS SUPPORT EQUIP/FACILITIES | 5307 | $1,800,000 | $360,000 | $360,000 | ||
| 2028 | RTD0011198 | RTA Facility & Vehicle Maintenance | MetroWest RTA - ACQUISITION OF BUS SUPPORT EQUIP/FACILITIES | RTACAP | $1,800,000 | $90,000 | $90,000 | ||
| 2028 | RTD0011267 | RTA Facility & System Modernization | MetroWest RTA - EV - Additional Electrification Infrastructure | 5307 | $4,000,000 | $500,000 | $500,000 | ||
| 2028 | RTD0011267 | RTA Facility & System Modernization | MetroWest RTA - EV - Additional Electrification Infrastructure | RTACAP | $4,000,000 | $500,000 | $500,000 | ||
| Federal Fiscal Year 2029 | $37,850,000 | $34,885,000 | $2,965,000 | ||||||
| MetroWest Regional Transit Authority | $37,850,000 | $34,885,000 | $2,965,000 | ||||||
| 2029 | MWRTA011706 | RTA Facility & System Modernization | METROWEST RTA- Hydrogen Fuel Generation and Dispensing Depot | 5339D | $30,000,000 | $30,000,000 | $30,000,000 | ||
| 2029 | MWRTA011948 | RTA Fleet Upgrades | METROWEST RTA- ACQUIRE HEAVY DUTY 30 FOOT REVENUE VEHICLE | 5307 | $12,600,000 | $1,050,000 | $1,050,000 | ||
| 2029 | MWRTA011948 | RTA Fleet Upgrades | METROWEST RTA- ACQUIRE HEAVY DUTY 30 FOOT REVENUE VEHICLE | RTACAP | $12,600,000 | $1,050,000 | $1,050,000 | ||
| 2029 | RTD0011137 | RTA Vehicle Replacement | MetroWest RTA - ACQUIRE REVENUE REPLACEMENT VEHICLES CUTAWAYS TYPE D CNG Consider For Statewide 5339 Funds | 5307 | $6,800,000 | $600,000 | $600,000 | ||
| 2029 | RTD0011137 | RTA Vehicle Replacement | MetroWest RTA - ACQUIRE REVENUE REPLACEMENT VEHICLES CUTAWAYS TYPE D CNG Consider For Statewide 5339 Funds | RTACAP | $6,800,000 | $600,000 | $600,000 | ||
| 2029 | RTD0011195 | Operating | MetroWest Regional Transit Authority - OPERATING ASSISTANCE NON FIXED ROUTE ADA PARA SERV | 5307 | $10,000,000 | $1,600,000 | $1,600,000 | ||
| 2029 | RTD0011195 | Operating | MetroWest Regional Transit Authority - OPERATING ASSISTANCE NON FIXED ROUTE ADA PARA SERV | SCA | $10,000,000 | $400,000 | $400,000 | ||
| 2029 | RTD0011196 | RTA Facility & Vehicle Maintenance | MetroWest RTA - TERMINAL, INTERMODAL (TRANSIT) - BLANDIN/FCRS | 5307 | $3,000,000 | $600,000 | $600,000 | ||
| 2029 | RTD0011196 | RTA Facility & Vehicle Maintenance | MetroWest RTA - TERMINAL, INTERMODAL (TRANSIT) - BLANDIN/FCRS | RTACAP | $3,000,000 | $150,000 | $150,000 | ||
| 2029 | RTD0011197 | RTA Facility & Vehicle Maintenance | MetroWest Regional Transit Authority - TECHNOLOGY SUPPORT/CAPITAL OUTREACH | 5307 | $1,400,000 | $175,000 | $175,000 | ||
| 2029 | RTD0011197 | RTA Facility & Vehicle Maintenance | MetroWest Regional Transit Authority - TECHNOLOGY SUPPORT/CAPITAL OUTREACH | RTACAP | $1,400,000 | $175,000 | $175,000 | ||
| 2029 | RTD0011198 | RTA Facility & Vehicle Maintenance | MetroWest RTA - ACQUISITION OF BUS SUPPORT EQUIP/FACILITIES | 5307 | $1,800,000 | $360,000 | $360,000 | ||
| 2029 | RTD0011198 | RTA Facility & Vehicle Maintenance | MetroWest RTA - ACQUISITION OF BUS SUPPORT EQUIP/FACILITIES | RTACAP | $1,800,000 | $90,000 | $90,000 | ||
| 2029 | RTD0011267 | RTA Facility & System Modernization | MetroWest RTA - EV - Additional Electrification Infrastructure | 5307 | $4,000,000 | $500,000 | $500,000 | ||
| 2029 | RTD0011267 | RTA Facility & System Modernization | MetroWest RTA - EV - Additional Electrification Infrastructure | RTACAP | $4,000,000 | $500,000 | $500,000 | ||
| Federal Fiscal Year 2030 | $22,850,000 | $16,885,000 | $5,965,000 | ||||||
| MetroWest Regional Transit Authority | $22,850,000 | $16,885,000 | $5,965,000 | ||||||
| 2030 | MWRTA011948 | RTA Fleet Upgrades | METROWEST RTA- ACQUIRE HEAVY DUTY 30 FOOT REVENUE VEHICLE | 5307 | $12,600,000 | $1,050,000 | $1,050,000 | ||
| 2030 | MWRTA011948 | RTA Fleet Upgrades | METROWEST RTA- ACQUIRE HEAVY DUTY 30 FOOT REVENUE VEHICLE | RTACAP | $12,600,000 | $1,050,000 | $1,050,000 | ||
| 2030 | MWRTA011964 | RTA Vehicle Replacement | MetroWest RTA - Hydrogen Vehicle Procurement | DOF | $15,000,000 | $12,000,000 | $12,000,000 | ||
| 2030 | MWRTA011964 | RTA Vehicle Replacement | MetroWest RTA - Hydrogen Vehicle Procurement | DRTACAP | $15,000,000 | $3,000,000 | $3,000,000 | ||
| 2030 | RTD0011137 | RTA Vehicle Replacement | MetroWest RTA - ACQUIRE REVENUE REPLACEMENT VEHICLES CUTAWAYS TYPE D CNG Consider For Statewide 5339 Funds | 5307 | $6,800,000 | $600,000 | $600,000 | ||
| 2030 | RTD0011137 | RTA Vehicle Replacement | MetroWest RTA - ACQUIRE REVENUE REPLACEMENT VEHICLES CUTAWAYS TYPE D CNG Consider For Statewide 5339 Funds | RTACAP | $6,800,000 | $600,000 | $600,000 | ||
| 2030 | RTD0011195 | Operating | MetroWest Regional Transit Authority - OPERATING ASSISTANCE NON FIXED ROUTE ADA PARA SERV | 5307 | $10,000,000 | $1,600,000 | $1,600,000 | ||
| 2030 | RTD0011195 | Operating | MetroWest Regional Transit Authority - OPERATING ASSISTANCE NON FIXED ROUTE ADA PARA SERV | SCA | $10,000,000 | $400,000 | $400,000 | ||
| 2030 | RTD0011196 | RTA Facility & Vehicle Maintenance | MetroWest RTA - TERMINAL, INTERMODAL (TRANSIT) - BLANDIN/FCRS | 5307 | $3,000,000 | $600,000 | $600,000 | ||
| 2030 | RTD0011196 | RTA Facility & Vehicle Maintenance | MetroWest RTA - TERMINAL, INTERMODAL (TRANSIT) - BLANDIN/FCRS | RTACAP | $3,000,000 | $150,000 | $150,000 | ||
| 2030 | RTD0011197 | RTA Facility & Vehicle Maintenance | MetroWest Regional Transit Authority - TECHNOLOGY SUPPORT/CAPITAL OUTREACH | 5307 | $1,400,000 | $175,000 | $175,000 | ||
| 2030 | RTD0011197 | RTA Facility & Vehicle Maintenance | MetroWest Regional Transit Authority - TECHNOLOGY SUPPORT/CAPITAL OUTREACH | RTACAP | $1,400,000 | $175,000 | $175,000 | ||
| 2030 | RTD0011198 | RTA Facility & Vehicle Maintenance | MetroWest RTA - ACQUISITION OF BUS SUPPORT EQUIP/FACILITIES | 5307 | $1,800,000 | $360,000 | $360,000 | ||
| 2030 | RTD0011198 | RTA Facility & Vehicle Maintenance | MetroWest RTA - ACQUISITION OF BUS SUPPORT EQUIP/FACILITIES | RTACAP | $1,800,000 | $90,000 | $90,000 | ||
| 2030 | RTD0011267 | RTA Facility & System Modernization | MetroWest RTA - EV - Additional Electrification Infrastructure | 5307 | $4,000,000 | $500,000 | $500,000 | ||
| 2030 | RTD0011267 | RTA Facility & System Modernization | MetroWest RTA - EV - Additional Electrification Infrastructure | RTACAP | $4,000,000 | $500,000 | $500,000 | ||
Table 3-11
FFYs 2025–29 TIP Transit Table (CATA)
| STIP: 2026 - 2030 (D) | ||||||||||
| Year | MassDOT Project ID | Municipality | Program | MassDOT Project Description | Funding Source | Total Project Cost | Total Programmed Funds | Federal Funds | State Funds | Other Funds |
| Federal Fiscal Year 2026 | $4,350,000 | $1,250,000 | $3,000,000 | $100,000 | ||||||
| Cape Ann Transportation Authority | $4,350,000 | $1,250,000 | $3,000,000 | $100,000 | ||||||
| 2026 | CATA011694 | RTA Facility & Vehicle Maintenance | CATA - Rehab/renovation of existing facility | 5307 | $1,793,000 | $250,000 | $250,000 | |||
| 2026 | CATA011694 | RTA Facility & Vehicle Maintenance | CATA - Rehab/renovation of existing facility | RTACAP | $1,793,000 | $250,000 | $250,000 | |||
| 2026 | CATA011695 | RTA Facility & System Modernization | Cape Ann TA-APC, AVL | RTACAP | $540,000 | $680,000 | $680,000 | |||
| 2026 | RTD0010579 | RTA Facility & Vehicle Maintenance | CATA - -Preventive Maintenance | 5307 | $356,250 | $400,000 | $400,000 | |||
| 2026 | RTD0010579 | RTA Facility & Vehicle Maintenance | CATA - -Preventive Maintenance | LF | $356,250 | $100,000 | $100,000 | |||
| 2026 | RTD0010583 | RTA Facility & Vehicle Maintenance | CATA - -buy misc small capital | RTACAP | $15,000 | $170,000 | $170,000 | |||
| 2026 | RTD0010591 | RTA Vehicle Replacement | CATA - -Revenue Vehicle Replacement. | 5307 | $600,000 | $600,000 | $600,000 | |||
| 2026 | RTD0010591 | RTA Vehicle Replacement | CATA - -Revenue Vehicle Replacement. | RTACAP | $600,000 | $1,800,000 | $1,800,000 | |||
| 2026 | T00073 | RTA Facility & Vehicle Maintenance | CATA-Rehab/Renovation Administration & Operations Facility | RTACAP | $30,000 | $100,000 | $100,000 | |||
| Federal Fiscal Year 2027 | $3,130,000 | $400,000 | $2,630,000 | $100,000 | ||||||
| Cape Ann Transportation Authority | $3,130,000 | $400,000 | $2,630,000 | $100,000 | ||||||
| 2027 | CATA011694 | RTA Facility & Vehicle Maintenance | CATA - Rehab/renovation of existing facility | RTACAP | $1,793,000 | $230,000 | $230,000 | |||
| 2027 | CATA011695 | RTA Facility & System Modernization | Cape Ann TA-APC, AVL | RTACAP | $540,000 | $180,000 | $180,000 | |||
| 2027 | RTD0010579 | RTA Facility & Vehicle Maintenance | CATA - -Preventive Maintenance | 5307 | $356,250 | $400,000 | $400,000 | |||
| 2027 | RTD0010579 | RTA Facility & Vehicle Maintenance | CATA - -Preventive Maintenance | LF | $356,250 | $100,000 | $100,000 | |||
| 2027 | RTD0010583 | RTA Facility & Vehicle Maintenance | CATA - -buy misc small capital | RTACAP | $15,000 | $170,000 | $170,000 | |||
| 2027 | RTD0010591 | RTA Vehicle Replacement | CATA - -Revenue Vehicle Replacement. | RTACAP | $600,000 | $1,950,000 | $1,950,000 | |||
| 2027 | T00073 | RTA Facility & Vehicle Maintenance | CATA-Rehab/Renovation Administration & Operations Facility | RTACAP | $30,000 | $100,000 | $100,000 | |||
| Federal Fiscal Year 2028 | $1,300,000 | $400,000 | $800,000 | $100,000 | ||||||
| Cape Ann Transportation Authority | $1,300,000 | $400,000 | $800,000 | $100,000 | ||||||
| 2028 | CATA011694 | RTA Facility & Vehicle Maintenance | CATA - Rehab/renovation of existing facility | RTACAP | $1,793,000 | $430,000 | $430,000 | |||
| 2028 | CATA011695 | RTA Facility & System Modernization | Cape Ann TA-APC, AVL | RTACAP | $540,000 | $100,000 | $100,000 | |||
| 2028 | RTD0010579 | RTA Facility & Vehicle Maintenance | CATA - -Preventive Maintenance | 5307 | $356,250 | $400,000 | $400,000 | |||
| 2028 | RTD0010579 | RTA Facility & Vehicle Maintenance | CATA - -Preventive Maintenance | LF | $356,250 | $100,000 | $100,000 | |||
| 2028 | RTD0010583 | RTA Facility & Vehicle Maintenance | CATA - -buy misc small capital | RTACAP | $15,000 | $170,000 | $170,000 | |||
| 2028 | T00073 | RTA Facility & Vehicle Maintenance | CATA-Rehab/Renovation Administration & Operations Facility | RTACAP | $30,000 | $100,000 | $100,000 | |||
| Federal Fiscal Year 2029 | $870,000 | $400,000 | $370,000 | $100,000 | ||||||
| Cape Ann Transportation Authority | $870,000 | $400,000 | $370,000 | $100,000 | ||||||
| 2029 | CATA011695 | RTA Facility & System Modernization | Cape Ann TA-APC, AVL | RTACAP | $540,000 | $100,000 | $100,000 | |||
| 2029 | RTD0010579 | RTA Facility & Vehicle Maintenance | CATA - -Preventive Maintenance | 5307 | $356,250 | $400,000 | $400,000 | |||
| 2029 | RTD0010579 | RTA Facility & Vehicle Maintenance | CATA - -Preventive Maintenance | LF | $356,250 | $100,000 | $100,000 | |||
| 2029 | RTD0010583 | RTA Facility & Vehicle Maintenance | CATA - -buy misc small capital | RTACAP | $15,000 | $170,000 | $170,000 | |||
| 2029 | T00073 | RTA Facility & Vehicle Maintenance | CATA-Rehab/Renovation Administration & Operations Facility | RTACAP | $30,000 | $100,000 | $100,000 | |||
| Federal Fiscal Year 2030 | $3,270,000 | $400,000 | $2,870,000 | |||||||
| Cape Ann Transportation Authority | $3,270,000 | $400,000 | $2,870,000 | |||||||
| 2030 | CATA011695 | RTA Facility & System Modernization | Cape Ann TA-APC, AVL | RTACAP | $540,000 | $100,000 | $100,000 | |||
| 2030 | RTD0010579 | RTA Facility & Vehicle Maintenance | CATA - -Preventive Maintenance | 5307 | $356,250 | $400,000 | $400,000 | |||
| 2030 | RTD0010583 | RTA Facility & Vehicle Maintenance | CATA - -buy misc small capital | RTACAP | $15,000 | $170,000 | $170,000 | |||
| 2030 | RTD0010591 | RTA Vehicle Replacement | CATA - -Revenue Vehicle Replacement. | RTACAP | $600,000 | $2,500,000 | $2,500,000 | |||
| 2030 | T00073 | RTA Facility & Vehicle Maintenance | CATA-Rehab/Renovation Administration & Operations Facility | RTACAP | $30,000 | $100,000 | $100,000 | |||
Proponent: This field lists the primary advocate for each project, who is responsible for seeing the project through to completion.
ID Number: This number references the project’s identification number in MassDOT’s project-tracking system.
Project Type: This field provides the type of project programmed. For those projects programmed with Regional Target funds (projects listed in Section 1A of the TIP tables), the projects are categorized according to the MPO’s six investment programs (Bicycle and Pedestrian, Complete Streets, Intersection Improvements, Major Infrastructure, Community Connections, and Transit Transformation). For those projects programmed directly by MassDOT (projects listed in Sections 1B, 2A, 2B, 2C, and 3B), MassDOT’s STIP Program categories are applied.
Cost: This figure is the total project cost as programmed in the TIP across all fiscal years, including years outside of FFYs 2025–29.
Funding Source: The funding source indicates whether a project is funded using the MPO’s Regional Target funds or MassDOT’s statewide highway funds.
Scoring Summary: This table shows the number of points awarded to the project across each of the MPO’s project evaluation categories. MPO staff has not evaluated all projects in the TIP; staff only evaluates projects that are being considered for funding with the MPO’s Regional Target funds. The field definitions for the tables are as follows for all projects scored in the MPO’s Bicycle and Pedestrian, Complete Streets, Intersection Improvements, Major Infrastructure, and Transit Transformation investment programs:
Projects within the MPO’s Community Connections Program are scored using different categories, given the unique nature of this program. The field definitions for those tables are as follows:
As mentioned in Chapter 2, the MPO adopted a revised set of project selection criteria in October 2023. These new criteria were used to score new projects under consideration for funding using the MPO’s Regional Target funds for both the FFYs 2025–29 TIP cycle. For this reason, the scoring criteria and point allocations vary based on when a project was evaluated for funding and programmed in the TIP. Point allocations are specified for each project, and some project pages feature additional information in this section to provide context for how projects were evaluated. Further details on all of the MPO’s project selection criteria are available in Appendix A.
Project Description: The description of the project is based, in part, on the written description of the project on MassDOT’s Project Information website. In some cases, these descriptions have been modified to clarify the details of the projects. Projects evaluated by the MPO tend to have more detailed descriptions, as more complete project documentation was provided to MPO staff for these projects.
Funding Summary: Funding tables are included for each project and show the following information:
For more information on all projects, please visit MassDOT’s Project Information website, https://hwy.massdot.state.ma.us/projectinfo/projectinfo.asp, the Boston Region MPO’s website, bostonmpo.org, or contact Ethan Lapointe, TIP Manager, at elapointe@ctps.org.
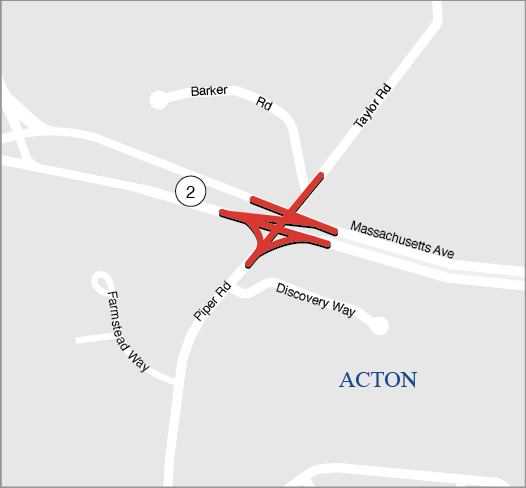
Proponent: |
MassDOT |
ID Number: |
607748 |
Project Type: |
Intersection Improvements |
Cost: |
$11,266,036 |
Funding Source: |
Statewide Highway Funds |
This is a MassDOT-prioritized project and is therefore not directly evaluated using the MPO’s TIP scoring criteria.
Work consists of intersection Safety upgrades for signs, pavement markings, and traffic signals as identified through a Road Safety Audit Process in the town of Acton.
Source |
(FFY) 2026 |
2027 |
2028 |
2029 |
2030 |
Total |
Federal Funds |
– |
– |
– |
– |
$9,012,829 |
$9,012,829 |
Non-Federal Funds |
– |
– |
– |
– |
$2,253,207 |
$2,253,207 |
Total Funds |
— |
— |
— |
— |
$11,266,036 |
$11,266,036 |
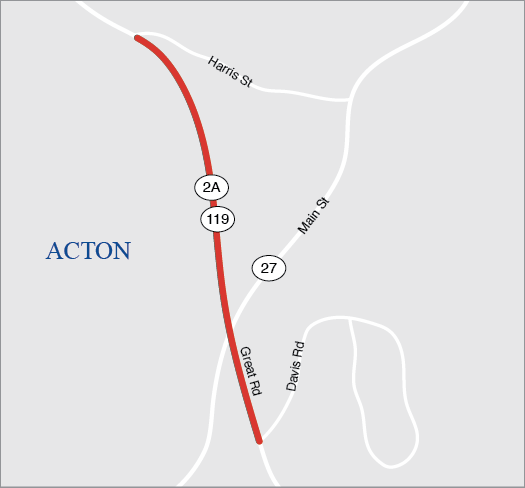
Proponent: |
Acton |
ID Number: |
S13293 |
Project Type: |
Complete Streets |
Cost: |
$860,000 |
Funding Source: |
Regional Target Funds |
Category |
Safety |
MR |
AC |
RES |
TE |
CA/HC |
Total |
Score |
12 out of 16 |
8 out of 16 |
7.75 out of 15 |
1 out of 14 |
4.6 out of 20 |
8 out of 16 |
41.4 out of 100 |
This line item will support design for a project to resurface Great Road and implement a five-foot sidewalk and 10-foot shared-use path along the corridor. The project area features a large number of multifamily dwellings and currently lacks safe bicycle or pedestrian infrastructure. The project also would make significant improvements to safety for all roadway users at the intersections of Great Road and Harris Street, and Great Road and Davis Road near the Bruce Freeman Rail Trail.
Source |
(FFY) 206 |
2027 |
2028 |
2029 |
2030 |
Total |
Federal Funds |
$688,000 |
– |
– |
– |
– |
$688,000 |
Non-Federal Funds |
$172,000 |
– |
– |
– |
– |
$172,000 |
Total Funds |
$860,000 |
— |
— |
— |
— |
$860,000 |
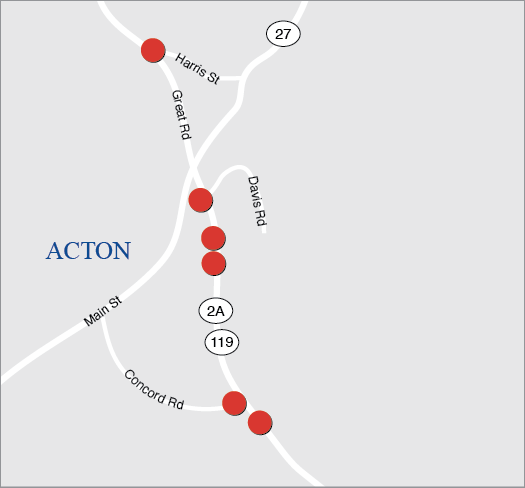
Proponent: |
MassDOT |
ID Number: |
613166 |
Project Type: |
Intersection Improvements |
Cost: |
$2,505,600 |
Funding Source: |
Statewide Highway Funds |
This is a MassDOT-prioritized project and is therefore not directly evaluated using the MPO’s TIP scoring criteria.
This project addresses safety concerns at several intersections along Great Road in Acton.
Source |
(FFY) 2026 |
2027 |
2028 |
2029 |
2030 |
Total |
Federal Funds |
– |
– |
$2,004,480 |
– |
– |
$2,004,480 |
Non-Federal Funds |
– |
– |
$501,120 |
– |
– |
$501,120 |
Total Funds |
— |
— |
$2,505,600 |
– |
– |
$2,505,600 |
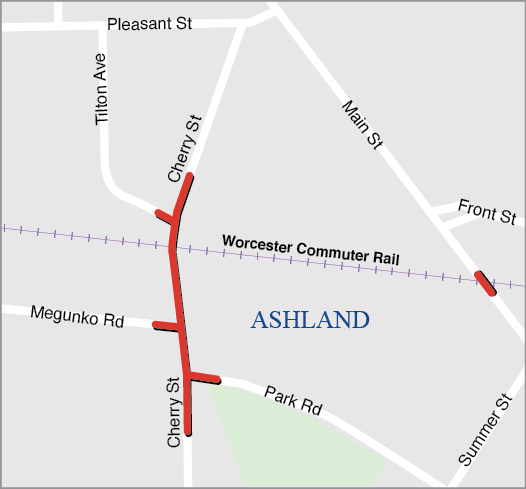
| Proponent: |
Ashland |
|---|---|
ID Number: |
608436 |
Project Type: |
Intersection Improvements |
Cost: |
$1,269,327 |
Funding Source: |
Regional Target Funds |
| Category |
Safety |
MR |
AC |
RES |
TE |
CA/HC |
Total |
|---|---|---|---|---|---|---|---|
Score |
12 out of 30 |
10 out of 29 |
5 out of 29 |
2 out of 16 |
1 out of 12 |
8 out of 18 |
38 out of 134 |
The primary purpose of the project is to improve the safety features for the roadway corridors of Cherry Street and Main Street in order to establish a Federal Railroad Administration Quiet Zone surrounding the railroad crossings on those two roadways. This goal will primarily be accomplished through the installation of roadway medians and the enhancement of existing railroad crossing signals and gates. In addition, the project addresses a critical gap in the pedestrian sidewalk network through the construction of new sidewalks. The project’s other goals include improving the existing roadway condition through pavement reconstruction and enhancing stormwater drainage in the project area.
Source |
(FFY) 2026 |
2027 |
2028 |
2029 |
2030 |
Total |
Federal Funds |
– |
– |
$1,015,462 |
– |
– |
$1,015,462 |
Non-Federal Funds |
– |
– |
$253,865 |
– |
– |
$253,865 |
Total Funds |
— |
— |
$1,269,327 |
— |
— |
$1,269,327 |
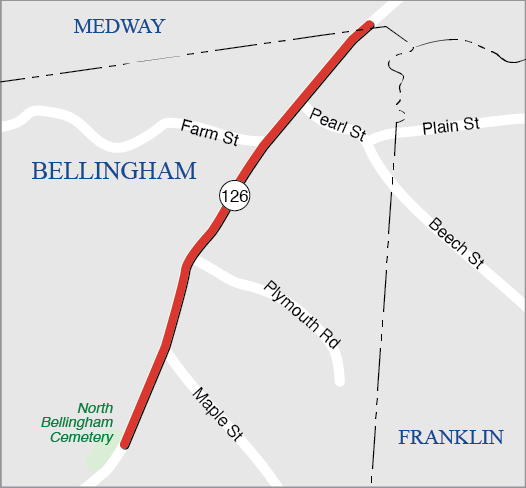
| Proponent: |
Bellingham |
|---|---|
ID Number: |
612963 |
Project Type: |
Complete Streets |
Cost: |
$15,848,000 |
Funding Source: |
Regional Target Funds |
| Category |
Safety |
MR |
AC |
RES |
TE |
CA/HC |
Total |
|---|---|---|---|---|---|---|---|
Score |
7.5 out of 16 |
12.5 out of 19 |
14 out of 15 |
7 out of 14 |
4.3 out of 20 |
9 out of 16 |
54.3 out of 100 |
The project includes roadway rehabilitation along 1.5 miles of Route 126, improved pedestrian and bicycle accommodations with full bilateral sidewalks and a shared-use path, and improvements to the bridge over Hopping Brook (B-06-017). An existing traffic signal at Maple Street will be upgraded and a new signal installed at Pearl Street. The project not only improves drainage throughout the project area but will incorporate improvements for better conveyance of Stall Brook under Route 126 for riverine flood mitigation alongside other drainage improvements.
| Source |
(FFY) 2026 |
2027 |
2028 |
2029 |
2030 |
Total |
|---|---|---|---|---|---|---|
Federal Funds |
– |
– |
– |
$6,672,000 |
$6,006,400 |
$12,678,400 |
Non-Federal Funds |
– |
– |
– |
$1,668,000 |
$1,501,600 |
$3,169,600 |
Total Funds |
— |
— |
— |
$8,340,000 |
$7,508,000 |
$15,848,000 |
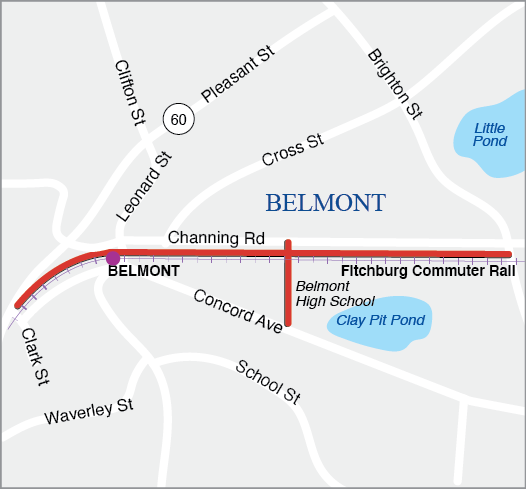
| Proponent: |
Belmont |
|---|---|
ID Number: |
609204 |
Project Type: |
Bicycle and Pedestrian |
Cost: |
$27,306,266 |
Funding Source: |
Regional Target Funds |
| Category |
Safety |
MR |
AC |
RES |
TE |
CA/HC |
Total |
|---|---|---|---|---|---|---|---|
Score |
15 out of 20 |
8 out of 14 |
18 out of 18 |
7 out of 14 |
7.6 out of 20 |
9 out of 14 |
64.6 out of 100 |
This project will construct the Belmont Community Path between the existing Fitchburg Cutoff Path and Belmont Center, creating a direct off-street connection between the heart of Belmont, the Alewife MBTA station, and destinations beyond in Cambridge, Somerville, and Boston. The project proposes a 12-foot paved facility with two-foot grass shoulders and additional landscaping along the length of the path that will buffer the new facility from the adjacent railroad tracks and neighboring properties. The project includes an underpass beneath the commuter rail tracks at Channing Road and Alexander Avenue to provide a safe connection between the Winnbrook neighborhood that lies on the north side of the tracks with the bike lanes on Concord Avenue and the adjacent new school serving students in grades 7-12.
| Source |
(FFY) 2026 |
2027 |
2028 |
2029 |
2030 |
Total |
|---|---|---|---|---|---|---|
Federal Funds |
$21,845,013 |
– |
– |
– |
– |
$21,845,013 |
Non-Federal Funds |
$5,461,253 |
– |
– |
– |
– |
$5,461,253 |
Total Funds |
$27,306,266 |
— |
— |
— |
— |
$27,306,266 |
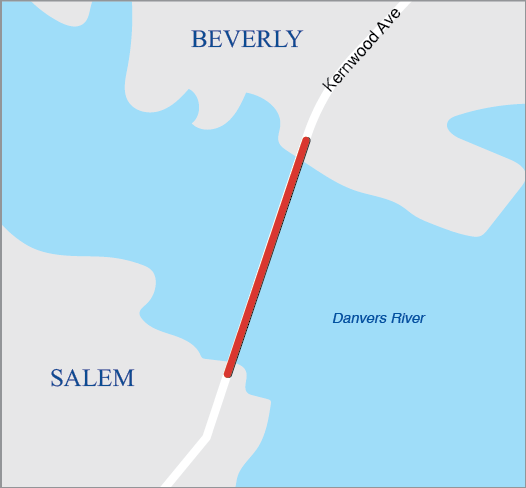
| Proponent: |
MassDOT |
|---|---|
ID Number: |
605276 |
Project Type: |
Bridge |
Cost: |
$438,752,269 |
Funding Source: |
State Highway Funds |
This is a MassDOT-prioritized project and is therefore not directly evaluated using the MPO’s TIP scoring criteria.
A preliminary type study and a value engineering study shall help to determine whether this bridge should be replaced or rehabilitated. If replacement, then three options shall be explored: a fixed high span bridge; replacement of only the approach timber spans; and a complete bridge replacement with a movable span and fixed approach spans.
| Source |
(FFY) 2026 |
2027 |
2028 |
2029 |
2030 |
Total |
|---|---|---|---|---|---|---|
Federal Funds |
– |
– |
$32,000,000 |
$80,000,000 |
$80,000,000 |
$48,000,000 |
Non-Federal Funds |
– |
– |
$8,000,000 |
$20,000,000 |
$20,000,000 |
$192,000,000 |
Total Funds |
— |
— |
$40,000,000 |
$100,000,000 |
$100,000,000 |
$240,000,000 |
| Proponent: |
CTPS |
|---|---|
ID Number: |
S12820 |
Project Type: |
Community Connections |
Cost: |
$8,000,000 |
Funding Source: |
Regional Target Funds |
This line item sets aside funding to be programmed for projects that will be scored separately using the Bikeshare Support criteria of the MPO’s Community Connections program.
This line item sets aside funding to support Bikeshare investments within the Community Connections program. Example uses of this set-aside include bikeshare system expansion, as well as replacement and upgrades to existing stations. FFY 2025 was the inaugural year of funding projects through this set-aside, and four bikeshare replacement projects were funded to replace 127 bicycles and 36 docks. The four projects funded by this effort are listed in this TIP.
| Source |
(FFY) 2026 |
2027 |
2028 |
2029 |
2030 |
Total |
|---|---|---|---|---|---|---|
Federal Funds |
– |
$1,600,000 |
$1,600,000 |
$1,600,000 |
$1,600,000 |
$6,400,000 |
Non-Federal Funds |
– |
$400,000 |
$400,000 |
$400,000 |
$400,000 |
$1,600,000 |
Total Funds |
— |
$2,000,000 |
$2,000,000 |
$2,000,000 |
$2,000,000 |
$8,000,000 |
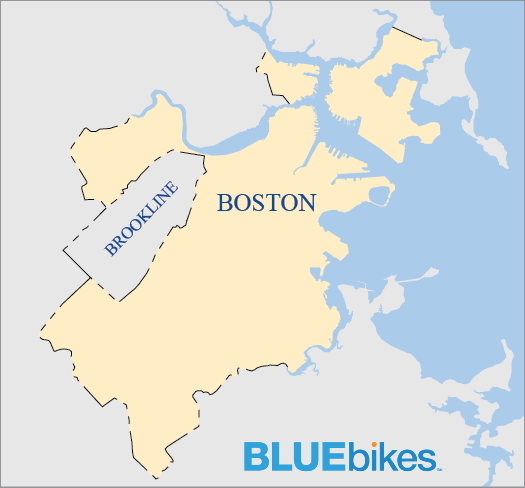
| Proponent: |
Boston |
|---|---|
ID Number: |
S13180 |
Project Type: |
Community Connections |
Cost: |
$783,860 |
Funding Source: |
Regional Target Funds |
| Category |
Conn |
Coord |
Plan |
TE |
CCM |
PM |
Total |
|---|---|---|---|---|---|---|---|
Score |
14 out of 18 |
10 out of 15 |
10 out of 15 |
13.5 out of 18 |
13 out of 24 |
10 out of 10 |
70.5 out of 100 |
This project will replace 20 Bluebikes Stations with 380 total docks across several neighborhoods in Boston, including Allston/Brighton, Charlestown, East Boston, Fenway, Roxbury, and Seaport.
Source |
(FFY) 2026 |
2027 |
2028 |
2029 |
2030 |
Total |
Federal Funds |
$627,088 |
– |
– |
– |
– |
$627,088 |
Non-Federal Funds |
$156,772 |
– |
– |
– |
– |
$156,772 |
Total Funds |
$783,860 |
— |
— |
— |
— |
$783,860 |
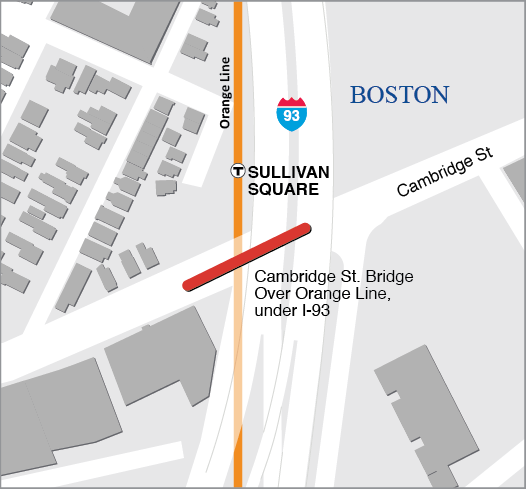
Proponent: |
Boston |
ID Number: |
612989 |
Project Type: |
Complete Streets |
Cost: |
$16,531,736 |
Funding Source: |
Regional Target Funds |
Category |
Safety |
MR |
AC |
RES |
TE |
CA/HC |
Total |
Score |
5 out of 18 |
15 out of 20 |
12.5 out of 18 |
4.5 out of 12 |
5.9 out of 20 |
10.25 out of 12 |
53.2 out of 100 |
The project replaces the deck of the Cambridge Street Bridge in Boston’s Charlestown neighborhood, which is a key connector traversing both MBTA Orange Line and commuter rail and Amtrak rail service in addition to travel underneath Interstate 93. This state-of-good-repair investment improves multimodal accessibility with upgraded pedestrian and bicycle facilities in addition to a new westbound bus lane for improved bus connections between Sullivan Square, Charlestown, and Somerville.
Source |
(FFY) 2026 |
2027 |
2028 |
2029 |
2030 |
Total |
Federal Funds |
– |
$13,225,389 |
– |
– |
– |
$13,225,389 |
Non-Federal Funds |
– |
$3,306,347 |
– |
– |
– |
$3,306,347 |
Total Funds |
— |
$16,531,736 |
— |
— |
— |
$16,531,736 |
Proponent: |
MassDOT |
ID Number: |
606728 |
Project Type: |
Bridge |
Cost: |
$108,054,000 |
Funding Source: |
Statewide Highway Funds |
This is a MassDOT-prioritized project and is therefore not directly evaluated using the MPO’s TIP scoring criteria.
This project will replace bridge C-01-008, which carries First Street over Broad Canal, and bridge C-01-040, which carries Land Boulevard over Broad Canal, in Cambridge. Both bridges are currently listed as structurally deficient and have posted load restrictions due to their poor condition.
Source |
(FFY) 2026 |
2027 |
2028 |
2029 |
2030 |
Total |
Federal Funds |
– |
– |
$86,443,200 |
– |
– |
$86,443,200 |
Non-Federal Funds |
– |
– |
$21,610,800 |
– |
– |
$21,610,800 |
Total Funds |
— |
— |
$108,054,000 |
— |
— |
$108,054,000 |
Proponent: |
MassDOT |
ID Number: |
613130 |
Project Type: |
Bridge |
Cost: |
$174,618,125 |
Funding Source: |
Statewide Highway Funds |
This is a MassDOT-prioritized project and is therefore not directly evaluated using the MPO’s TIP scoring criteria.
This project will replace bridge B-16-365, which carries Storrow Drive over the Bowker Ramps and Muddy River in Boston. This bridge is currently listed as structurally deficient and has posted vehicle weight restrictions due to its poor condition. The funding for this project includes a $15 million contribution from the Boston Region MPO in FFY 2028.
Source |
(FFY) 2026 |
2027 |
2028 |
2029 |
2030 |
Total |
Federal Funds |
– |
– |
– |
$43,694,500 |
$88,000,000 |
$131,694,500 |
Non-Federal Funds |
– |
– |
– |
$10,923,625 |
$22,000,000 |
$32,923,625 |
Total Funds |
— |
— |
— |
$54,618,125 |
$110,000,000 |
$164,618,125 |
Proponent: |
MassDOT |
ID Number: |
612519 |
Project Type: |
Bridge |
Cost: |
$76,704,381 |
Funding Source: |
Statewide Highway Funds |
This is a MassDOT-prioritized project and is therefore not directly evaluated using the MPO’s TIP scoring criteria.
This project will replace bridge B-16-165, which carries Blue Hill Avenue over the MBTA Fairmount and Franklin commuter rail lines in Boston.
Source |
(FFY) 2026 |
2027 |
2028 |
2029 |
2030 |
Total |
Federal Funds |
– |
– |
$26,819,518 |
– |
– |
$26,819,518 |
Non-Federal Funds |
– |
– |
$6,704,879 |
– |
– |
$6,704,879 |
Total Funds |
— |
— |
$33,524,397 |
— |
— |
$33,524,397 |
Proponent: |
MassDOT |
ID Number: |
613125 |
Project Type: |
Bridge |
Cost: |
$27,721,008 |
Funding Source: |
Statewide Highway Funds |
This is a MassDOT-prioritized project and is therefore not directly evaluated using the MPO’s TIP scoring criteria.
This project will perform deck and superstructure replacement of Bridge B–16–051(4T5), Massachusetts Avenue over Interstate 90 and MBTA commuter rail near Hynes Convention Center Station.
Source |
(FFY) 2026 |
2027 |
2028 |
2029 |
2030 |
Total |
Federal Funds |
– |
– |
$22,176,806 |
– |
– |
$22,176,806 |
Non-Federal Funds |
– |
– |
$5,544,202 |
– |
– |
$5,544,202 |
Total Funds |
— |
— |
$27,721,008 |
— |
— |
$27,721,008 |
![]()
Proponent: |
MassDOT |
ID Number: |
613124 |
Project Type: |
Bridge |
Cost: |
$39,378,666 |
Funding Source: |
Statewide Highway Funds |
This is a MassDOT-prioritized project and is therefore not directly evaluated using the MPO’s TIP scoring criteria.
This project will replace the superstructure of the Beacon Street Bridge over Interstate 90 at mile marker 132.2 near Boston University and Landsowne MBTA Station.
Source |
(FFY) 2026 |
2027 |
2028 |
2029 |
2030 |
Total |
Federal Funds |
– |
– |
$31,502,933 |
– |
– |
$31,502,933 |
Non-Federal Funds |
– |
– |
$7,875,733 |
– |
– |
$7,875,733 |
Total Funds |
— |
— |
$39,378,666 |
— |
— |
$39,378,666 |
| Proponent: |
MassDOT |
|---|---|
ID Number: |
610537 |
Project Type: |
Safe Routes to School |
Cost: |
$2,363,537 |
Funding Source: |
Statewide Highway Funds |
This is a MassDOT-prioritized project and is therefore not directly evaluated using the MPO’s TIP scoring criteria.
This project will make upgrades to promote safety along the roadways surrounding Ellis Elementary School in Boston through the Safe Routes to School program. The project proposes traffic-calming measures throughout the project area, including speed humps and curb extensions at several locations. Along Humboldt Avenue, the project proposes signal timing adjustments, the addition of bicycle lanes, and the installation of bus bulbs and a crosswalk at the intersection of Humboldt Avenue and Monroe Street. Raised intersection treatments are also proposed at three locations along Walnut Avenue.
Source |
(FFY) 2026 |
2027 |
2028 |
2029 |
2030 |
Total |
Federal Funds |
$1,890,830 |
– |
– |
– |
– |
$1,890,830 |
Non-Federal Funds |
$472,707 |
– |
– |
– |
– |
$472,707 |
Total Funds |
$2,363,537 |
— |
— |
— |
— |
$2,363,537 |
| Proponent: |
MassDOT |
|---|---|
ID Number: |
611954 |
Project Type: |
Safety Improvements |
Cost: |
$2,333,968 |
Funding Source: |
Statewide Highway Funds |
This is a MassDOT-prioritized project and is therefore not directly evaluated using the MPO’s TIP scoring criteria.
This project involves the replacement of guide and traffic signs on Interstate 93 and Interstate 90 within the Central Artery/Tunnel system, including applicable signing on intersecting secondary roadways. The project covers approximately six miles along Interstate 90 (mile markers 132 to 138) and five miles along Interstate 93 (mile markers 15 to 20). The project area includes the Ted Williams Tunnel from the Interstate 90 terminus in East Boston westbound to the Brookline/Boston city line east of St. Mary’s Street. The project area along Interstate 93 runs between Southhampton Street north to the Mystic Avenue off ramp.
Source |
(FFY) 2026 |
2027 |
2028 |
2029 |
2030 |
Total |
Federal Funds |
– |
$1,867,174 |
– |
– |
– |
$1,867,174 |
Non-Federal Funds |
– |
$466,794 |
– |
– |
– |
$466,794 |
Total Funds |
— |
$2,333,968 |
— |
— |
— |
$2,333,968 |
Proponent: |
Boston |
ID Number: |
606453 |
Project Type: |
Complete Streets |
Cost: |
$10,185,935 |
Funding Source: |
Regional Target Funds |
Category |
Safety |
MR |
AC |
RES |
TE |
CA/HC |
Total |
Score |
15 out of 20 |
8 out of 14 |
18 out of 18 |
7 out of 14 |
7.6 out of 20 |
9 out of 14 |
64.6 out of 100 |
This roadway improvement project will enhance safety and mobility for people walking and biking along the Boylston Street corridor. The project will improve traffic signals and crosswalks, replace street lighting, and reconstruct sidewalks and ramps to achieve ADA compliance throughout the corridor. This project will also construct additional improvements to the Muddy River crossing at the western end of the corridor, including along Park Drive to the Landmark Center driveway and at the intersection of Brookline Avenue and Pilgrim Road. These improvements will include the addition of segments of separated bicycle lanes and cycle track, improved signals and crosswalks, and reconstructed sidewalks to shorten pedestrian crossings. The scope of work of this project has been adjusted to coordinate with and reflect recent and upcoming developments along the corridor.
Source |
(FFY) 2026 |
2027 |
2028 |
2029 |
2030 |
Total |
Federal Funds |
$8,148,748 |
– |
– |
– |
– |
$8,148,748 |
Non-Federal Funds |
$2,037,187 |
– |
– |
– |
– |
$2,037,187 |
Total Funds |
$10,185,935 |
— |
— |
— |
— |
$10,185,935 |
Proponent: |
MassDOT |
ID Number: |
613164 |
Project Type: |
Bicycle and Pedestrian |
Cost: |
$4,965,462 |
Funding Source: |
Statewide Highway Funds |
This is a MassDOT-prioritized project and is therefore not directly evaluated using the MPO’s TIP scoring criteria.
This project will construct a new bridge over the Neponset River at Osceola Street, connecting to the Neponset River Greenway at Brush Hill Road.
Source |
(FFY) 2026 |
2027 |
2028 |
2029 |
2030 |
Total |
Federal Funds |
– |
– |
$3,972,370 |
– |
– |
$3,972,370 |
Non-Federal Funds |
– |
– |
$993,092 |
– |
– |
$993,092 |
Total Funds |
— |
— |
$4,965,462 |
— |
— |
$4,965,462 |

Proponent: |
Boston |
ID Number: |
606226 |
Project Type: |
Major Infrastructure |
Cost: |
$197,759,449 |
Funding Source: |
Regional Target Funds |
This project is funded using Regional Target funds but was not scored using the MPO’s TIP project selection criteria. The project was evaluated through the MPO’s Long-Range Transportation Plan process.
The reconstruction of Rutherford Avenue from City Square to Sullivan Square will make the road a multimodal urban boulevard corridor. This project will be funded over five years, starting in FFY 2028. The total project cost is estimated to be $197,759,449 and the total funding in the FFYs 2026-30 TIP is $57,000,000. The City of Boston will contribute $25,000,000 in local matching funding towards the project.
Source |
(FFY) 2026 |
2027 |
2028 |
2029 |
2030 |
Total |
Federal Funds |
– |
– |
– |
$18,800,000 |
$26,800,000 |
$45,600,000 |
Non-Federal Funds |
– |
– |
– |
$4,700,000 |
$6,700,000 |
$11,400,000 |
Total Funds |
— |
— |
— |
$23,500,000 |
$33,500,000 |
$57,000,000 |

| Proponent: |
MassDOT |
|---|---|
ID Number: |
610650 |
Project Type: |
Safety Improvements |
Cost: |
$6,440,000 |
Funding Source: |
Statewide Highway Funds |
This is a MassDOT-prioritized project and is therefore not directly evaluated using the MPO’s TIP scoring criteria.
MassDOT is proposing to improve safety between the intersection of Gallivan Boulevard at Washington Street and Gallivan Boulevard at Granite Avenue/Adams Street. The design will be based on the future road safety audit (RSA) to take place throughout the project limits. These recommendations will likely improve curb ramps, cross walks, traffic signals, pavement markings, signage, etc. The project will aim to improve safety for all modes of transportation, through recommendations from the RSA.
Source |
(FFY) 2026 |
2027 |
2028 |
2029 |
2030 |
Total |
Federal Funds |
– |
– |
– |
$5,152,000 |
– |
$5,152,000 |
Non-Federal Funds |
– |
– |
– |
$1,288,000 |
– |
$1,288,000 |
Total Funds |
— |
— |
— |
$6,440,000 |
— |
$6,440,000 |
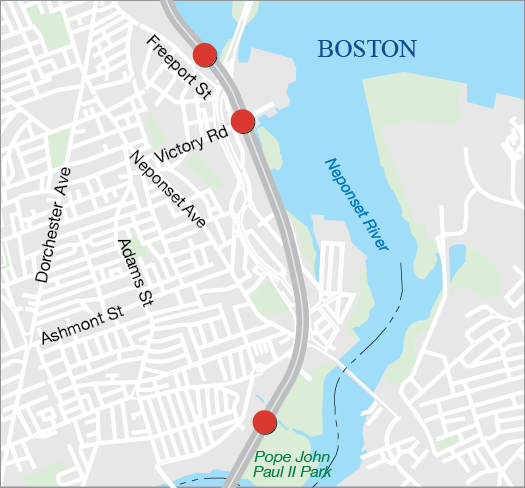
Proponent: |
MassDOT |
ID Number: |
613099 |
Project Type: |
Roadway Reconstruction |
Cost: |
$3,247,991 |
Funding Source: |
Statewide Highway Funds |
This is a MassDOT-prioritized project and is therefore not directly evaluated using the MPO’s TIP scoring criteria.
This project will maintain unstable slopes along three sections of I-93 in Boston: one section along Pope John Paul II Park, another over Victory Road, and a third adjacent to the southbound on-ramp from Freeport Street.
Source |
(FFY) 2026 |
2027 |
2028 |
2029 |
2030 |
Total |
Federal Funds |
– |
$2,598,393 |
– |
– |
– |
$2,598,393 |
Non-Federal Funds |
– |
$649,598 |
– |
– |
– |
$649,598 |
Total Funds |
— |
$3,247,991 |
— |
— |
— |
$3,247,991 |
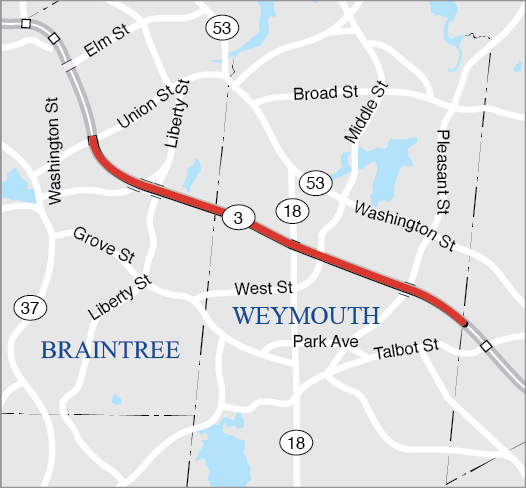
| Proponent: |
MassDOT |
|---|---|
ID Number: |
612050 |
Project Type: |
Non-Interstate Pavement |
Cost: |
$10,286,416 |
Funding Source: |
Statewide Highway Funds |
This is a MassDOT-prioritized project and is therefore not directly evaluated using the MPO’s TIP scoring criteria.
This project includes resurfacing and related work on Route 3 in Braintree and Weymouth. The project’s extents run from mile marker 37.7 to mile marker 41.8 for a total of 4.1 miles, or from the Weymouth/Hingham town line to Union Street in Braintree.
Source |
(FFY) 2026 |
2027 |
2028 |
2029 |
2030 |
Total |
Federal Funds |
$8,229,133 |
– |
– |
– |
– |
$8,229,133 |
Non-Federal Funds |
$2,057,283 |
– |
– |
– |
– |
$2,057,283 |
Total Funds |
$10,286,416 |
— |
— |
— |
— |
$10,286,416 |
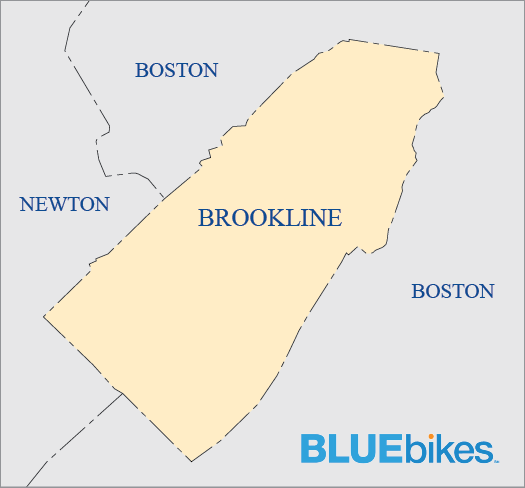
Proponent: |
Brookline |
ID Number: |
S13179 |
Project Type: |
Community Connections |
Cost: |
$238,646 |
Funding Source: |
Regional Target Funds |
Category |
Conn |
Coord |
Plan |
TE |
CCM |
PM |
Total |
Score |
11.5 out of 18 |
10 out of 15 |
14 out of 15 |
11 out of 18 |
15 out of 24 |
6 out of 10 |
67.5 out of 100 |
This project will construct three new Bluebike stations, two in South Brookline and one near Longwood Station on the D Branch of the Green Line, and the procurement of 10 new e-bikes.
Source |
(FFY) 2026 |
2027 |
2028 |
2029 |
2030 |
Total |
Federal Funds |
$190,917 |
– |
– |
– |
– |
$190,917 |
Non-Federal Funds |
$47,729 |
– |
– |
– |
– |
$47,729 |
Total Funds |
$238,646 |
— |
— |
— |
— |
$238,646 |
.png)
| Proponent: |
MassDOT |
|---|---|
ID Number: |
612816 |
Project Type: |
Safe Routes to School |
Cost: |
$1,066,511 |
Funding Source: |
Statewide Highway Funds |
This is a MassDOT-prioritized project and is therefore not directly evaluated using the MPO’s TIP scoring criteria.
This project will make upgrades to promote safety along the roadways surrounding William H. Lincoln School in Brookline through the Safe Routes to School program. The Project will improve pedestrian and bicycle safety and access improvements on the one-way portion of Chestnut Street, including the installation of a two-way protected bike lane, new sidewalks, new ADA-compliant wheelchair ramps, related pavement markings, and signage. On Kennard Road, the project will construct a new raised intersection, crosswalks, ADA-compliant wheelchair ramps, related pavement markings, and signage at the school driveway to reduce motor vehicle speed and improve pedestrian safety and access.
| Source |
(FFY) 2026 |
2027 |
2028 |
2029 |
2030 |
Total |
|---|---|---|---|---|---|---|
Federal Funds |
– |
$853,209 |
– |
– |
– |
$853,209 |
Non-Federal Funds |
– |
$213,302 |
– |
– |
– |
$213,302 |
Total Funds |
— |
$1,066,511 |
— |
— |
— |
$1,066,511 |
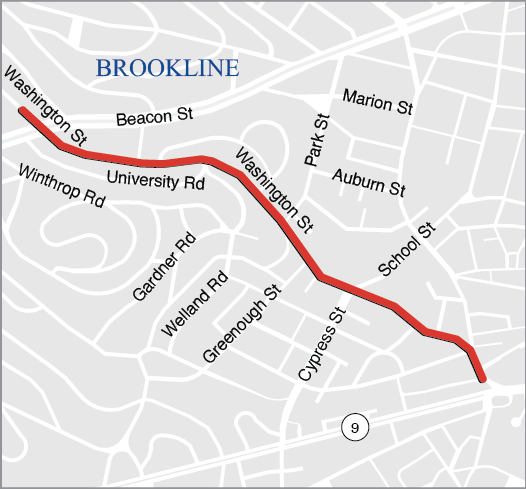
| Proponent: |
Brookline |
|---|---|
ID Number: |
610932 |
Project Type: |
Complete Streets |
Cost: |
$27,959,721 |
Funding Source: |
Regional Target Funds |
| Category |
Safety |
Sys Pres |
CM/M |
CA/SC |
EQUITY |
EV |
Total |
|---|---|---|---|---|---|---|---|
Score |
14 out of 18 |
13 out of 20 |
11 out of 18 |
7 out of 12 |
7.4 out of 20 |
10 out of 12 |
62.4 out of 100 |
This project will reconstruct Washington Street in Brookline between Boylston Street and Beacon Street. Washington Street is currently constrained with a narrow right of way that accommodates two lanes of traffic, on-street parking in both directions, bicycling, and significant volumes of pedestrians. Sidewalks are currently in poor condition, and the area contains two HSIP bicycle crash clusters and one pedestrian crash cluster. The project will reconstruct sidewalks along both sides of the entire corridor and will provide protected bicycle facilities in both directions that are separated from vehicular traffic for a vast majority of the corridor. Other multimodal improvements include the provision of dedicated bus pull-out space outside of the travel lanes. The project will also replace the existing signals along Washington Street’s length and will reconstruct the roadway surface.
Source |
(FFY) 2026 |
2027 |
2028 |
2029 |
2030 |
Total |
Federal Funds |
– |
– |
$12,032,223 |
$10,335,554 |
– |
$22,367,777 |
Non-Federal Funds |
– |
– |
$3,008,056 |
$2,583,888 |
– |
$5,591,944 |
Total Funds |
— |
— |
$15,040,279 |
$12,919,442 |
— |
$27,959,721 |
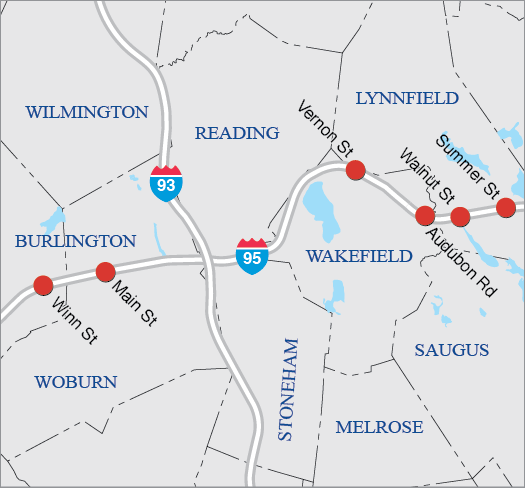
Proponent: |
MassDOT |
ID Number: |
613196 |
Project Type: |
Bridge |
Cost: |
$13,171,481 |
Funding Source: |
Statewide Highway Funds |
This is a MassDOT-prioritized project and is therefore not directly evaluated using the MPO’s TIP scoring criteria.
This project involves bridge preservation of 10 reinforced concrete frame bridges in Burlington, Lynnfield, Wakefield, and Woburn to include concrete patching and railing upgrades.
Source |
(FFY) 2026 |
2027 |
2028 |
2029 |
2030 |
Total |
Federal Funds |
$10,537,185 |
– |
– |
– |
– |
$10,537,185 |
Non-Federal Funds |
$2,634,296 |
– |
– |
– |
– |
$2,634,296 |
Total Funds |
$13,171,481 |
— |
— |
— |
— |
$13,171,481 |
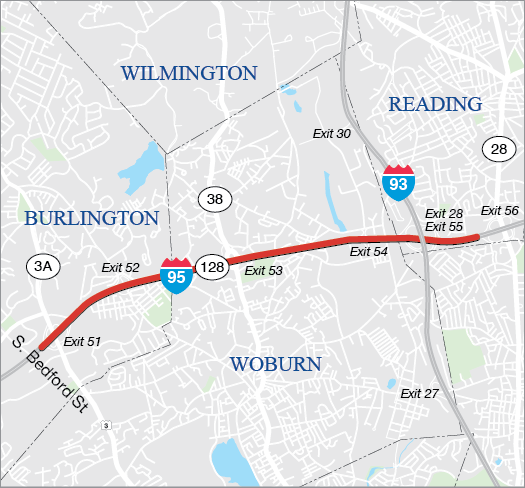
Proponent: |
MassDOT |
ID Number: |
613318 |
Project Type: |
Interstate Pavement |
Cost: |
$8,790,600 |
Funding Source: |
Statewide Highway Funds |
This is a MassDOT-prioritized project and is therefore not directly evaluated using the MPO’s TIP scoring criteria.
This project involves pavement preservation on the northbound and southbound lanes of I-95 from about 250 ft southwest of the overpass over South Bedford Street in Burlington to about 100 ft west of exit 56A on I-95 North in Woburn.
Source |
(FFY) 2026 |
2027 |
2028 |
2029 |
2030 |
Total |
Federal Funds |
– |
$7,032,480 |
– |
– |
– |
$7,032,480 |
Non-Federal Funds |
– |
$1,758,120 |
– |
– |
– |
$1,758,120 |
Total Funds |
— |
$8,790,600 |
— |
— |
— |
$8,790,600 |
Proponent: |
Cambridge |
ID Number: |
S13182 |
Project Type: |
Community Connections |
Cost: |
$223,715 |
Funding Source: |
Regional Target Funds |
Category |
Conn |
Coord |
Plan |
TE |
CCM |
PM |
Total |
Score |
12.5 out of 18 |
6 out of 15 |
14 out of 15 |
10 out of 18 |
16 out of 24 |
7 out of 10 |
65.5 out of 100 |
This project will replace seven stations with 123 total docks across several neighborhoods in Cambridge, including North Cambridge, Porter Square, Cambridgeport, and Kendall Square.
Source |
(FFY) 2026 |
2027 |
2028 |
2029 |
2030 |
Total |
Federal Funds |
$178,972 |
– |
– |
– |
– |
$178,972 |
Non-Federal Funds |
$44,743 |
– |
– |
– |
– |
$44,743 |
Total Funds |
$223,715 |
— |
— |
— |
— |
$223,715 |
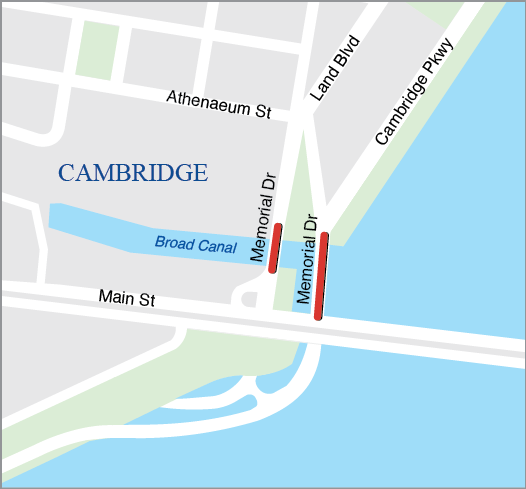
| Proponent: |
MassDOT |
|---|---|
ID Number: |
606449 |
Project Type: |
Bridge |
Cost: |
$38,727,023 |
Funding Source: |
Statewide Highway Funds |
This is a MassDOT-prioritized project and is therefore not directly evaluated using the MPO’s TIP scoring criteria.
This project will replace bridge C-01-008, which carries First Street over Broad Canal, and bridge C-01-040, which carries Land Boulevard over Broad Canal, in Cambridge. Both bridges are currently listed as structurally deficient and have posted load restrictions due to their poor condition.
Source |
(FFY) 2026 |
2027 |
2028 |
2029 |
2030 |
Total |
Federal Funds |
– |
– |
$19,853,778 |
$11,127,841 |
– |
$30,981,618 |
Non-Federal Funds |
– |
– |
$4,963,444 |
$2,781,960 |
– |
$7,745,405 |
Total Funds |
— |
— |
$24,817,222 |
$13,909,801 |
— |
$38,727,023 |
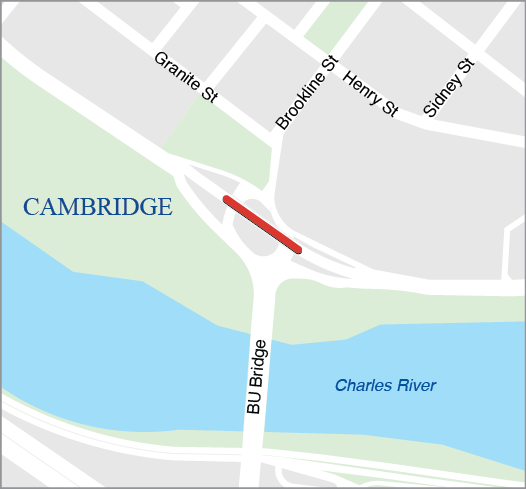
| Proponent: |
MassDOT |
|---|---|
ID Number: |
611987 |
Project Type: |
Bridge |
Cost: |
$49,283,338 |
Funding Source: |
Statewide Highway Funds |
This is a MassDOT-prioritized project and is therefore not directly evaluated using the MPO’s TIP scoring criteria.
This project will replace bridge C-01-026, which carries Memorial Drive over Brookline Street in Cambridge.
Source |
(FFY) 2026 |
2027 |
2028 |
2029 |
2030 |
Total |
Federal Funds |
– |
– |
$39,426,670 |
– |
– |
$30,981,618 |
Non-Federal Funds |
– |
– |
$9,856,668 |
– |
– |
$7,745,405 |
Total Funds |
— |
— |
$49,283,338 |
— |
— |
$49,283,338 |
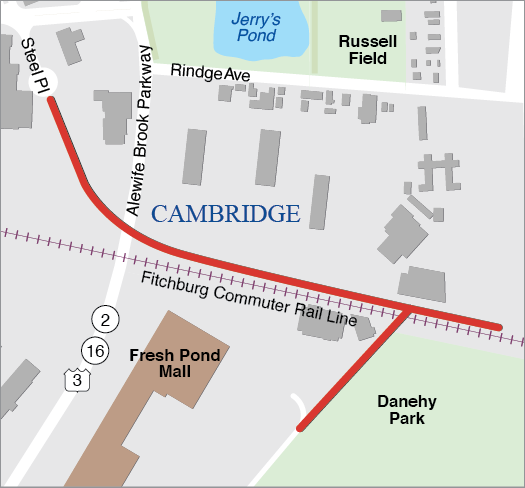
| Proponent: |
Cambridge |
|---|---|
ID Number: |
S13295 |
Project Type: |
Bicycle and Pedestrian |
Cost: |
$2,000,000 |
Funding Source: |
Regional Target Funds |
| Category |
Conn |
Coord |
Plan |
TE |
CCM |
PM |
Total |
|---|---|---|---|---|---|---|---|
Score |
14 out of 16 |
14 out of 15 |
15.5 out of 17 |
14 out of 16 |
15 out of 16 |
5.6 out of 20 |
78.1 out of 100 |
This project will design a new bridge carrying a shared-use path over the MBTA Fitchburg Line between New Street and Sherman Street. The path will connect to Danehy Park, Sherman Street, Alewife Station, and the North Cambridge residential neighborhoods.
Source |
(FFY) 2026 |
2027 |
2028 |
2029 |
2030 |
Total |
Federal Funds |
$1,600,000 |
– |
– |
– |
– |
$1,600,000 |
Non-Federal Funds |
$400,000 |
– |
– |
– |
– |
$400,000 |
Total Funds |
$2,000,000 |
— |
— |
— |
— |
$2,000,000 |
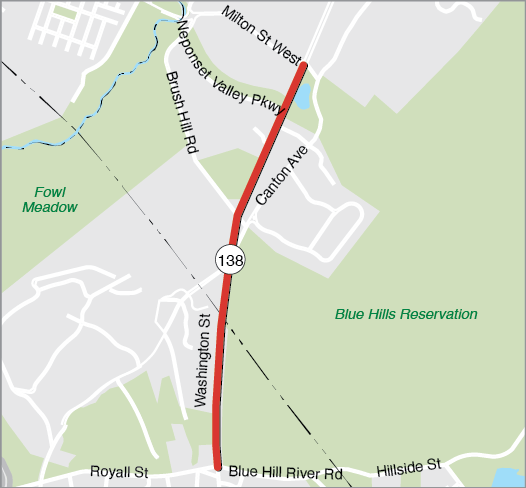
| Proponent: |
MassDOT |
|---|---|
ID Number: |
612615 |
Project Type: |
Roadway Reconstruction |
Cost: |
$19,435,808 |
Funding Source: |
Statewide Highway Funds |
This is a MassDOT-prioritized project and is therefore not directly evaluated using the MPO’s TIP scoring criteria.
This project will reconstruct Route 138 between Royall Street and Dollar Lane to add a shared use path and sidewalk. Dollar Lane will have safety improvements.
Source |
(FFY) 2026 |
2027 |
2028 |
2029 |
2030 |
Total |
Federal Funds |
– |
– |
– |
$15,548,646 |
– |
$15,548,646 |
Non-Federal Funds |
– |
– |
– |
$3,887,162 |
– |
$3,887,162 |
Total Funds |
— |
— |
— |
$19,435,808 |
— |
$19,435,808 |
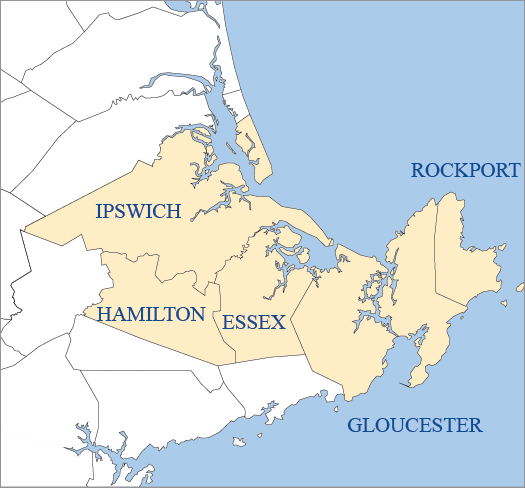
| Proponent: |
CATA |
|---|---|
ID Number: |
S12970 |
Project Type: |
Transit Transformation |
Cost: |
$2,460,000 |
Funding Source: |
Regional Target Funds |
This project is funded using Regional Target funds but was not scored using the MPO’s TIP project selection criteria for Transit Transformation as it was programmed after the project evaluation period to utilize available funding in FFY 2026.
This project will replace four vehicles in CATAs bus fleet that have reached the end of their useful life, with two vehicles reaching the end of their lifecycle in 2022 and two in 2023. The vehicles will be procured using an existing option for purchase of diesel electric hybrid buses.
Source |
(FFY) 2026 |
2027 |
2028 |
2029 |
2030 |
Total |
Federal Funds |
$600,000 |
– |
– |
– |
– |
$600,000 |
Non-Federal Funds |
$150,000 |
– |
– |
– |
– |
$150,000 |
Total Funds |
$750,000 |
— |
— |
— |
— |
$750,000 |
Proponent: |
Chelsea |
ID Number: |
S13194 |
Project Type: |
Community Connections |
Cost: |
$107,785 |
Funding Source: |
Regional Target Funds |
Category |
Conn |
Coord |
Plan |
TE |
CCM |
PM |
Total |
Score |
14 out of 18 |
10 out of 15 |
12 out of 15 |
10 out of 18 |
13 out of 24 |
7 out of 10 |
66 out of 100 |
This project will construct three new Bluebikes stations in Chelsea. One will be installed at the Eastern Avenue Silver Line station and entrance to the Chelsea Greenway, one adjacent to Chelsea High School, and one at Washington Park in a residential neighborhood near the border with Everett. In addition, this project will also purchase three new e-bikes and 28 new pedal bikes.
Source |
(FFY) 2026 |
2027 |
2028 |
2029 |
2030 |
Total |
Federal Funds |
$86,228 |
– |
– |
– |
– |
$86,228 |
Non-Federal Funds |
$21,557 |
– |
– |
– |
– |
$21,557 |
Total Funds |
$107,785 |
— |
— |
— |
— |
$107,785 |
.png)
Proponent: |
MassDOT |
ID Number: |
612884 |
Project Type: |
Safe Routes to School |
Cost: |
$3,524,272 |
Funding Source: |
Statewide Highway Funds |
This is a MassDOT-prioritized project and is therefore not directly evaluated using the MPO’s TIP scoring criteria.
This project will make upgrades to promote safety along the roadways surrounding Mary C. Burke Elementary School in Chelsea through the Safe Routes to School program. The project will serve the immediate needs of the students and staff by drastically improving pedestrian safety along Eastern Avenue, Stockton Street, and Spencer Avenue. Improvements include the addition of pedestrian signals, rehabilitation of pavement markings and roadway surfaces, construction of new ADA-compliant ramps, and reconstruction of existing traffic signal components. The project will also reduce the number of travel lanes on Eastern Avenue to add a pedestrian refuge. The roadway network will be simplified through the formal closure of a rarely used roadway in the project area, allowing for the creation of new open space in its place.
Source |
(FFY) 2026 |
2027 |
2028 |
2029 |
2030 |
Total |
Federal Funds |
– |
– |
$2,819,418 |
– |
– |
$2,819,418 |
Non-Federal Funds |
– |
– |
$704,854 |
– |
– |
$704,854 |
Total Funds |
— |
— |
$3,524,272 |
— |
— |
$3,524,272 |
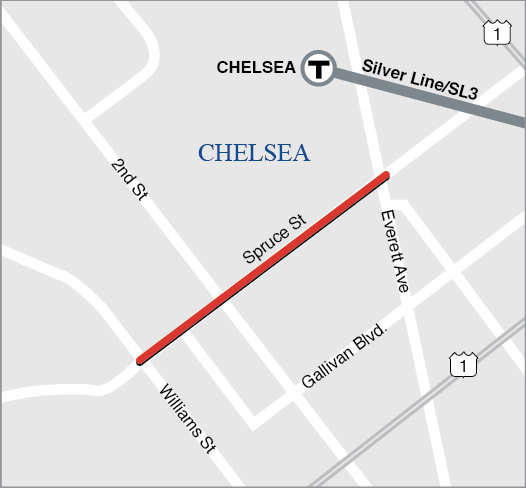
| Proponent: |
MassDOT |
|---|---|
ID Number: |
610675 |
Project Type: |
Safety Improvements |
Cost: |
$7,215,751 |
Funding Source: |
Statewide Highway Funds |
This is a MassDOT-prioritized project and is therefore not directly evaluated using the MPO’s TIP scoring criteria.
The primary objective of this project is the creation of a vibrant, accessible, and safe corridor in order to stimulate the Shopping Center and adjacent industrial area, support the Critical Urban Freight Corridor, and to increase access of patrons to its business, commercial, and residential areas. Through the comprehensive rehabilitation of this roadway, we will address non-compliance with ADA standards, implement upgraded signalization at intersections, reduce congestion and optimize circulation, reduce all crash types, and introduce adequate bicycle and pedestrian facilities to promote mobility.
Source |
(FFY) 2026 |
2027 |
2028 |
2029 |
2030 |
Total |
Federal Funds |
– |
– |
– |
– |
$5,772,601 |
$5,772,601 |
Non-Federal Funds |
– |
– |
– |
– |
$1,443,150 |
$1,443,150 |
Total Funds |
— |
— |
— |
— |
$7,215,751 |
$7,215,751 |
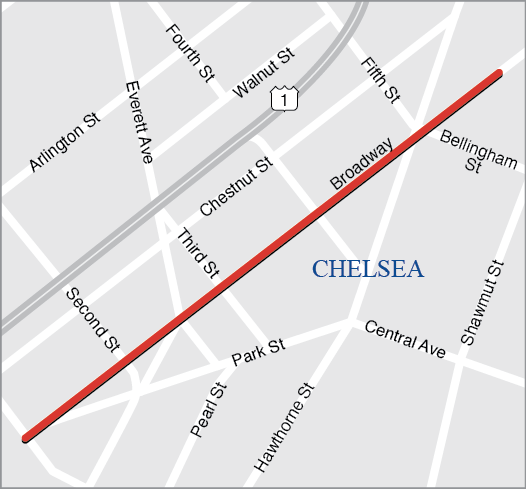
Proponent: |
MassDOT |
ID Number: |
609532 |
Project Type: |
Intersection Improvements |
Cost: |
$10,804,213 |
Funding Source: |
Statewide Highway Funds |
This is a MassDOT-prioritized project and is therefore not directly evaluated using the MPO’s TIP scoring criteria.
The project will include corridor-wide safety improvements targeted at reducing incidents for all users. Standard safety countermeasures such as improved signage, lighting, traffic-calming streetscape elements, curb extensions, signal upgrades (where applicable) and other countermeasures may be incorporated. In addition, it is expected that the corridor’s pavement, sidewalks and bus transit amenities will be improved or replaced.
Source |
(FFY) 2026 |
2027 |
2028 |
2029 |
2030 |
Total |
Federal Funds |
– |
$8,643,370 |
– |
– |
– |
– |
Non-Federal Funds |
– |
$2,160,843 |
– |
– |
– |
– |
Total Funds |
— |
$10,804,213 |
— |
— |
— |
— |
![]()
| Proponent: |
Chelsea and Revere |
|---|---|
ID Number: |
S12963 |
Project Type: |
Community Connections |
Cost: |
$1,413,375 |
Funding Source: |
Regional Target Funds |
| Category |
Conn |
Coord |
Plan |
TE |
CCM |
PM |
Total |
|---|---|---|---|---|---|---|---|
Score |
13 out of 18 |
11 out of 15 |
N/A |
11.25 out of 18 |
11.5 out of 24 |
7 out of 10 |
53.75 out of 100 |
The Cities of Chelsea and Revere propose a microtransit service that will provide regional, low-cost, on-demand transportation across a 6.5 square mile zone in Chelsea and Revere. The service will offer convenient pick-up and drop-off services that align with riders’ schedules, filling first- and last-mile gaps in the existing transit system and ensuring accessibility to critical destinations, such as grocery stores, healthcare facilities, places of employment, and educational institutions. The applicants estimate 58 passenger trips per day with electric vehicles. As a Microtransit Pilot Project, the project is proposed for funding across three years with $499,649 in Year 1, $450,278 in Year 2, and $463,807 in Year 3.
Source |
(FFY) 2026 |
2027 |
2028 |
2029 |
2030 |
Total |
Federal Funds |
$360,222 |
$371,046 |
– |
– |
– |
$731,268 |
Non-Federal Funds |
$90,056 |
$92,761 |
– |
– |
– |
$182,817 |
Total Funds |
$450,278 |
$463,807 |
— |
— |
— |
$914,085 |
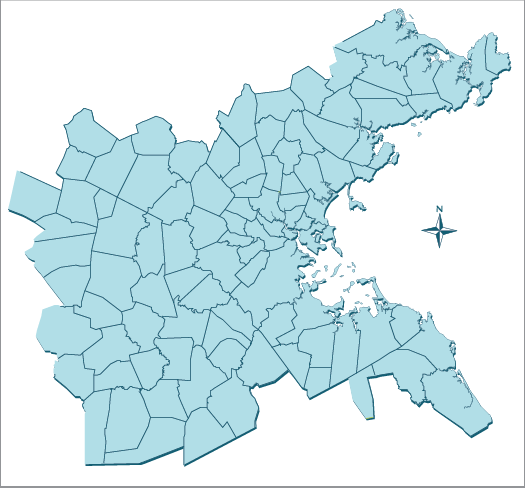
| Proponent: |
Regionwide |
|---|---|
ID Number: |
S12124 |
Project Type: |
Community Connections |
Cost: |
$9,036,193 |
Funding Source: |
Regional Target Funds |
The scoring criteria for the Community Connections Program are listed in Appendix A. Scores for projects funded in the FFYs 2026–30 TIP through this program are available on those projects’ pages within this chapter.
The Community Connections Program is the MPO’s funding program for first- and last-mile solutions, community transportation, and other small, nontraditional transportation projects such as those that update transit technology and improve bicycle and pedestrian facilities. The Community Connections Program is one of the investment programs included in the MPO’s current Long-Range Transportation Plan, Destination 2050. Seven new projects were programmed in FFY 2026 during this TIP development cycle, and funding remains available to program in future TIP cycles in FFYs 2027 through 2030.
Source |
(FFY) 2026 |
2027 |
2028 |
2029 |
2030 |
Total |
Federal Funds |
– |
$1,628,954 |
$1,600,000 |
$2,000,000 |
$2,000,000 |
$7,228,954 |
Non-Federal Funds |
– |
$407,239 |
$400,000 |
$500,000 |
$500,000 |
$1,807,239 |
Total Funds |
— |
$2,036,193 |
$2,000,000 |
$2,500,000 |
$2,500,000 |
$9,036,193 |
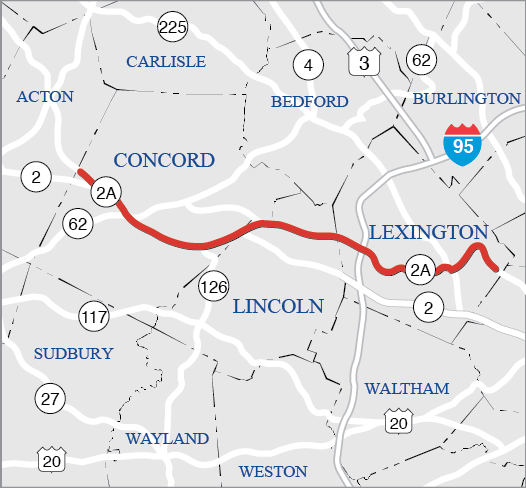
| Proponent: |
MassDOT |
|---|---|
ID Number: |
608495 |
Project Type: |
Non-Interstate Pavement |
Cost: |
$5,067,399 |
Funding Source: |
Statewide Highway Funds |
This is a MassDOT-prioritized project and is therefore not directly evaluated using the MPO’s TIP scoring criteria.
This project will resurface Route 2A in the communities of Concord, Lexington, and Lincoln from near Minuteman High School to Crosby Pond. The project may also make safety improvements along the corridor.
Source |
(FFY) 2026 |
2027 |
2028 |
2029 |
2030 |
Total |
Federal Funds |
– |
– |
– |
– |
$4,053,919 |
$4,053,919 |
Non-Federal Funds |
– |
– |
– |
– |
$1,013,480 |
$1,013,480 |
Total Funds |
— |
— |
— |
— |
$5,067,399 |
$5,067,399 |
Proponent: |
CTPS |
ID Number: |
S13291 |
Project Type: |
Administrative |
Cost: |
$43,000 |
Funding Source: |
Regional Target Funds |
This effort will measure the outcomes of capital projects that are evaluated and funded elsewhere in the TIP. This line item is not subject to the TIP project selection criteria.
This line item purchases six air quality sensors with additional monitoring equipment to support evaluation of the outcomes of projects funded through the TIP as part of the MPO's Performance Based Planning Program.
Source |
(FFY) 2026 |
2027 |
2028 |
2029 |
2030 |
Total |
Federal Funds |
$34,400 |
– |
– |
– |
– |
$34,400 |
Non-Federal Funds |
$8,600 |
– |
– |
– |
– |
$8,600 |
Total Funds |
$43,000 |
— |
— |
— |
— |
$43,000 |
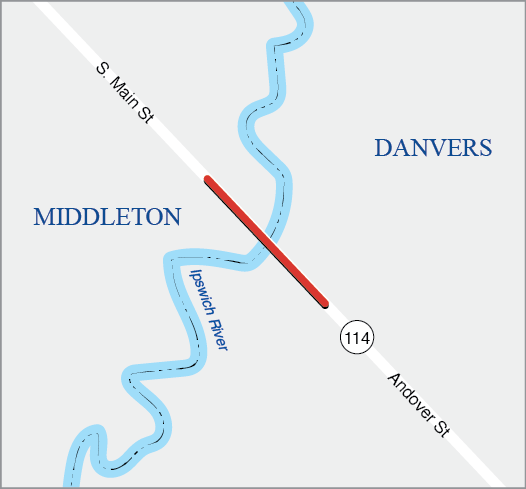
Proponent: |
MassDOT |
ID Number: |
610782 |
Project Type: |
Bridge |
Cost: |
$25,953,750 |
Funding Source: |
Statewide Highway Funds |
This is a MassDOT-prioritized project and is therefore not directly evaluated using the MPO’s TIP scoring criteria.
This project will fund the replacement of bridge D-03-009=M-20-005, which carries Andover Street over the Ipswich River between Danvers and Middleton.
Source |
(FFY) 2026 |
2027 |
2028 |
2029 |
2030 |
Total |
Federal Funds |
– |
– |
$20,763,000 |
– |
– |
$20,763,000 |
Non-Federal Funds |
– |
– |
$5,190,750 |
– |
– |
$5,190,750 |
Total Funds |
— |
— |
$25,953,750 |
— |
— |
$25,953,750 |
-01.png)
| Proponent: |
MassDOT |
|---|---|
ID Number: |
612607 |
Project Type: |
Bicycle and Pedestrian |
Cost: |
$3,711,150 |
Funding Source: |
Statewide Highway Funds |
This is a MassDOT-prioritized project and is therefore not directly evaluated using the MPO’s TIP scoring criteria.
This project will construct a 0.8-mile segment of the Danvers Rail Trail from Spring Street in the east to just west of Maple Street. The eastern end of this project will connect to earlier phases of the Danvers Rail Trail and to the larger Border to Boston Trail system further east.
Source |
(FFY) 2026 |
2027 |
2028 |
2029 |
2030 |
Total |
Federal Funds |
– |
– |
$2,968,920 |
– |
– |
$2,968,920 |
Non-Federal Funds |
– |
– |
$742,230 |
– |
– |
$742,230 |
Total Funds |
— |
— |
$3,711,150 |
— |
— |
$3,711,150 |
.png)
Proponent: |
MassDOT |
ID Number: |
612804 |
Project Type: |
Safe Routes to School |
Cost: |
$2,566,884 |
Funding Source: |
Statewide Highway Funds |
This is a MassDOT-prioritized project and is therefore not directly evaluated using the MPO’s TIP scoring criteria.
This project will make upgrades to promote safety along the roadways surrounding Avery Elementary School in Dedham through the Safe Routes to School program. The project includes three areas of improvement designed to facilitate safe walking to the Avery campus. The project proposes adding sidewalks and granite curbing on Maverick Street, along with adding new granite curbing along Whiting Avenue. A new crosswalk with rectangular-rapid-flashing beacons is also proposed for installation on Whiting Avenue at Recreation Road. Finally, Hill Avenue is frequently used as a cut-through for students who live East of Avery Elementary, but this route is currently a dead-end road ending in a wooded area with steep grade, a ledge, and fencing. This project proposes formalizing this connection with an ADA-accessible pedestrian walkway ramp to facilitate safe passage in what is currently an unmaintained student made path that is unsafe especially in winter months.
Source |
(FFY) 2026 |
2027 |
2028 |
2029 |
2030 |
Total |
|
Federal Funds |
– |
$2,053,507 |
– |
– |
– |
$2,053,507 |
|
Non-Federal Funds |
– |
$513,377 |
– |
– |
– |
$513,377 |
|
Total Funds |
— |
$2,566,884 |
— |
— |
— |
$2,566,884 |
|
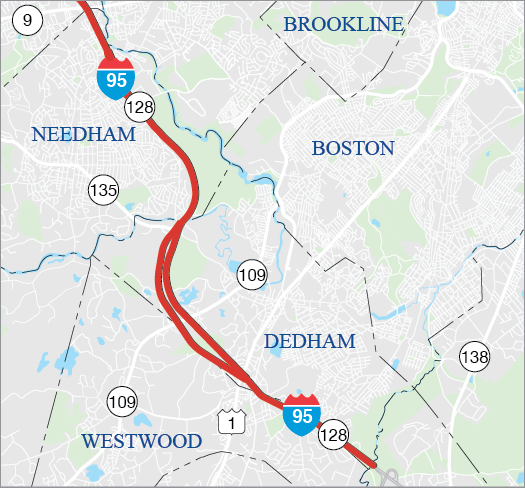
| Proponent: |
MassDOT |
|---|---|
ID Number: |
613382 |
Project Type: |
Interstate Pavement |
Cost: |
$5,703,371 |
Funding Source: |
Statewide Highway Funds |
This is a MassDOT-prioritized project and is therefore not directly evaluated using the MPO’s TIP scoring criteria.
This project proposes to preserve the open-graded friction course on I-95 in Dedham and Needham.
Source |
(FFY) 2026 |
2027 |
2028 |
2029 |
2030 |
Total |
Federal Funds |
– |
$11,720,800 |
– |
– |
– |
$11,720,800 |
Non-Federal Funds |
– |
$2,930,200 |
– |
– |
– |
$2,930,200 |
Total Funds |
— |
$14,651,000 |
— |
— |
— |
$14,651,000 |
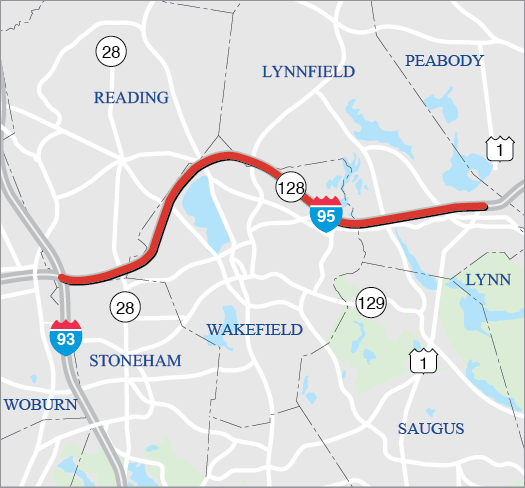
| Proponent: |
MassDOT |
|---|---|
ID Number: |
S13209 |
Project Type: |
Freight |
Cost: |
$1,500,000 |
Funding Source: |
Statewide Highway Funds |
This is a MassDOT-prioritized project and is therefore not directly evaluated using the MPO’s TIP scoring criteria.
This item funds design for improvements to freight infrastructure on I-95 within Reading and Lynnfield.
Source |
(FFY) 2026 |
2027 |
2028 |
2029 |
2030 |
Total |
Federal Funds |
– |
$1,200,000 |
– |
– |
– |
$1,200,000 |
Non-Federal Funds |
– |
$300,000 |
– |
– |
– |
$300,000 |
Total Funds |
— |
$1,500,000 |
— |
— |
— |
$1,500,000 |
| Proponent: |
MassDOT |
|---|---|
ID Number: |
608495 |
Project Type: |
Non-Interstate Pavement |
Cost: |
$5,067,399 |
Funding Source: |
Statewide Highway Funds |
This is a MassDOT-prioritized project and is therefore not directly evaluated using the MPO’s TIP scoring criteria.
This project will resurface Route 2A in the communities of Concord, Lexington, and Lincoln from near Minuteman High School to Crosby Pond. The project may also make safety improvements along the corridor.
Source |
(FFY) 2026 |
2027 |
2028 |
2029 |
2030 |
Total |
Federal Funds |
– |
– |
– |
– |
$4,053,919 |
$4,053,919 |
Non-Federal Funds |
– |
– |
– |
– |
$1,013,480 |
$1,013,480 |
Total Funds |
— |
— |
— |
— |
$5,067,399 |
$5,067,399 |
| Proponent: |
Everett |
|---|---|
ID Number: |
609257 |
Project Type: |
Complete Streets |
Cost: |
$12,075,024 |
Funding Source: |
Regional Target Funds |
| Category |
Safety |
MR |
AC |
RES |
TE |
CA/HC |
Total |
|---|---|---|---|---|---|---|---|
Score |
19 out of 30 |
10 out of 29 |
13 out of 29 |
4 out of 16 |
7 out of 12 |
1 out of 18 |
54 out of 134 |
This Complete Streets project involves the reconstruction of Beacham Street to reduce vehicular collisions and improve bicycle travel. This project also includes the implementation of a shared-use bike path with a buffer along 0.65 miles of the Beacham Street corridor, a major connection between Boston, Somerville, and Cambridge, and Chelsea and East Boston. To promote pedestrian safety, upgrades to traffic signals, pavement markings, and sidewalk conditions will be incorporated to reduce conflict with vehicular traffic and provide an ADA-compliant travel route.
Source |
(FFY) 2026 |
2027 |
2028 |
2029 |
2030 |
Total |
Federal Funds |
– |
$9,660,019 |
– |
– |
– |
$9,660,019 |
Non-Federal Funds |
– |
$2,415,005 |
– |
– |
– |
$2,415,005 |
Total Funds |
— |
$12,075,024 |
— |
— |
— |
$12,075,024 |
| Proponent: |
MassDOT |
|---|---|
ID Number: |
613121 |
Project Type: |
Intersection Improvements |
Cost: |
$8,662,582 |
Funding Source: |
Statewide Highway Funds |
This is a MassDOT-prioritized project and is therefore not directly evaluated using the MPO’s TIP scoring criteria.
This project will make targeted safety enhancements along Route 16 in Everett with a focus on enhanced multimodal accessibility along the corridor. The project may be coordinated with future work along Route 16 to further improve safety for all users and travel modes.
Source |
(FFY) 2026 |
2027 |
2028 |
2029 |
2030 |
Total |
Federal Funds |
– |
$6,930,066 |
– |
– |
– |
$6,930,066 |
Non-Federal Funds |
– |
$1,732,516 |
– |
– |
– |
$1,732,516 |
Total Funds |
— |
$8,662,582 |
— |
— |
— |
$8,662,582 |
| Proponent: |
MassDOT |
|---|---|
ID Number: |
613343 |
Project Type: |
Interstate Pavement |
Cost: |
$14,399,840 |
Funding Source: |
Statewide Highway Funds |
This is a MassDOT-prioritized project and is therefore not directly evaluated using the MPO’s TIP scoring criteria.
This project involves pavement preservation on the northbound and southbound lanes of I-95 in Foxborough from the overpass over Green Street (Route 106) to about 100 ft south of exit 17 on I-95 North.
Source |
(FFY) 2026 |
2027 |
2028 |
2029 |
2030 |
Total |
Federal Funds |
– |
$11,519,872 |
– |
– |
– |
$11,519,872 |
Non-Federal Funds |
– |
$2,879,968 |
– |
– |
– |
$2,879,968 |
Total Funds |
— |
$14,399,840 |
— |
— |
— |
$14,399,840 |
| Proponent: |
MassDOT |
|---|---|
ID Number: |
613654 |
Project Type: |
Bicycle and Pedestrian |
Cost: |
$8,388,800 |
Funding Source: |
Statewide Highway Funds |
This is a MassDOT-prioritized project and is therefore not directly evaluated using the MPO’s TIP scoring criteria.
The project will consist of Phase 1 of the final phase of the Bruce Freeman Rail Trail that once complete will provide connectivity from Lowell to Framingham. Phase 1 proposes approximately 1.6 miles of shared use path with potential for boardwalk structures over critical environmental resource areas (assumed 500 LF). The trail corridor will intersect at grade with 2 roadways and crossing treatments will be evaluated.
Source |
(FFY) 2026 |
2027 |
2028 |
2029 |
2030 |
Total |
Federal Funds |
– |
– |
– |
$6,711,040 |
– |
$6,711,040 |
Non-Federal Funds |
– |
– |
– |
$1,677,760 |
– |
$1,677,760 |
Total Funds |
— |
— |
— |
$8,388,800 |
— |
$8,388,800 |
.png)
| Proponent: |
MassDOT |
|---|---|
ID Number: |
612894 |
Project Type: |
Safe Routes to School |
Cost: |
$1,651,982 |
Funding Source: |
Statewide Highway Funds |
This is a MassDOT-prioritized project and is therefore not directly evaluated using the MPO’s TIP scoring criteria.
This project will make upgrades to promote safety along the roadways surrounding Harmony Grove Elementary School in Framingham through the Safe Routes to School program. This project includes installing new and reconstructing existing sidewalk and curbing on Second Street, from Beaver Street to Waverly Street, and Taralli Terrace, from Second Street to Beaver Park Road. The project will also realign the intersection of Beaver Park Road and Taralli Terrace and install new pavement markings, ADA-compliant curb cuts, crosswalks, and shared bike lanes on Second Street.
Source |
(FFY) 2026 |
2027 |
2028 |
2029 |
2030 |
Total |
Federal Funds |
– |
$1,321,586 |
– |
– |
– |
$1,321,586 |
Non-Federal Funds |
– |
$330,396 |
– |
– |
– |
$330,396 |
Total Funds |
— |
$1,651,982 |
— |
— |
— |
$1,651,982 |
| Proponent: |
Framingham |
|---|---|
ID Number: |
S13147 |
Project Type: |
Major Infrastructure |
Cost: |
$1,400,000 |
Funding Source: |
Statewide Highway Funds |
This project is funded using Regional Target funds but was not scored using the MPO’s TIP project selection criteria. The project was evaluated through the MPO’s Long-Range Transportation Plan process.
This project provides design funding for an initial stage of a major intersection improvement project at Route 126 and 135 and the MBTA and CSX railroad tracks. Design funding will be used to develop and identify alternatives to address congestion at the location, including possibilty of grade crossing removal. This project would advance the design for a separate project #606109, and is also listed in the MPO’s Long Range Transportation Plan, Destination 2050.
Source |
(FFY) 2026 |
2027 |
2028 |
2029 |
2030 |
Total |
Federal Funds |
$1,120,000 |
– |
– |
– |
– |
$1,120,000 |
Non-Federal Funds |
$280,000 |
– |
– |
– |
– |
$280,000 |
Total Funds |
$1,400,000 |
— |
— |
— |
— |
$1,400,000 |
| Proponent: |
MassDOT |
|---|---|
ID Number: |
613639 |
Project Type: |
Non-Interstate Pavement |
Cost: |
$9,865,800 |
Funding Source: |
Statewide Highway Funds |
This is a MassDOT-prioritized project and is therefore not directly evaluated using the MPO’s TIP scoring criteria.
This project consists of resurfacing and related work on Route 9. The project was formerly consolidated into one project under Project ID 609402 in the FFYs 2024–28 TIP, which also included sections of Route 9 in Natick. Please refer to Project #613640 for the section of Route 9 in Natick.
Source |
(FFY) 2026 |
2027 |
2028 |
2029 |
2030 |
Total |
Federal Funds |
– |
– |
– |
– |
$7,892,640 |
$7,892,640 |
Non-Federal Funds |
– |
– |
– |
– |
$1,973,160 |
$1,973,160 |
Total Funds |
— |
— |
— |
— |
$9,865,800 |
$9,865,800 |
| Proponent: |
MassDOT |
|---|---|
ID Number: |
608397 |
Project Type: |
Bridge |
Cost: |
$60,480,000 |
Funding Source: |
Statewide Highway Funds |
This is a MassDOT-prioritized project and is therefore not directly evaluated using the MPO’s TIP scoring criteria.
This project will reconstruct bridge G-05-002, which carries Route 127, Western Avenue, over the Blynman Canal in Gloucester.
Source |
(FFY) 2026 |
2027 |
2028 |
2029 |
2030 |
Total |
|
Federal Funds |
– |
– |
– |
– |
$16,553,014 |
$16,553,01 |
– |
Non-Federal Funds |
– |
– |
– |
– |
$4,138,254 |
$4,138,54 |
– |
Total Funds |
— |
— |
— |
— |
$20,691,268 |
$20,691,268 |
|
| Proponent: |
MassDOT |
|---|---|
ID Number: |
612046 |
Project Type: |
Non-Interstate Pavement |
Cost: |
$4,399,920 |
Funding Source: |
Statewide Highway Funds |
This is a MassDOT-prioritized project and is therefore not directly evaluated using the MPO’s TIP scoring criteria.
This project involves resurfacing on Route 128 in Gloucester from the eastern side of the Annisquam River Bridge to the intersection with Route 127A.
Source |
(FFY) 2026 |
2027 |
2028 |
2029 |
2030 |
Total |
Federal Funds |
– |
– |
– |
$3,519,936 |
– |
$3,519,936 |
Non-Federal Funds |
– |
– |
– |
$879,984 |
– |
$879,984 |
Total Funds |
— |
— |
— |
$4,399,920 |
— |
$4,399,920 |
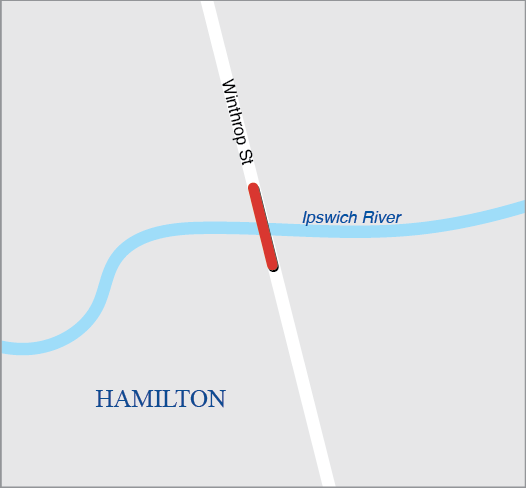
| Proponent: |
MassDOT |
|---|---|
ID Number: |
609467 |
Project Type: |
Bridge |
Cost: |
$11,384,206 |
Funding Source: |
Statewide Highway Funds |
This is a MassDOT-prioritized project and is therefore not directly evaluated using the MPO’s TIP scoring criteria.
This project will replace bridge H-03-002=I-01-006, which carries Winthrop Street over the Ipswich River.
Source |
(FFY) 2026 |
2027 |
2028 |
2029 |
2030 |
Total |
Federal Funds |
– |
$9,107,365 |
– |
– |
– |
$9,107,365 |
Non-Federal Funds |
– |
$2,276,841 |
– |
– |
– |
$2,276,841 |
Total Funds |
— |
$11,384,206 |
— |
— |
— |
$11,384,206 |
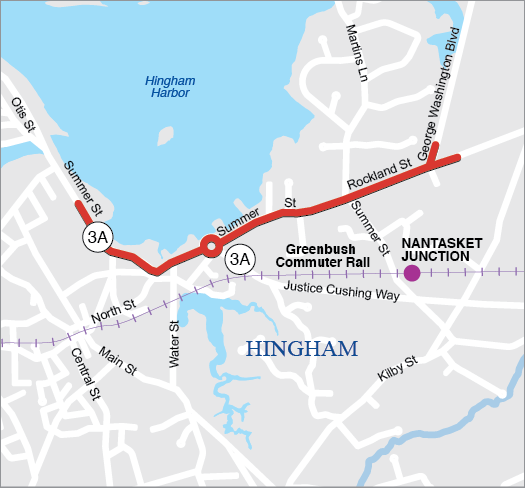
| Proponent: |
Hingham |
|---|---|
ID Number: |
605168 |
Project Type: |
Complete Streets |
Cost: |
$31,949,531 |
Funding Source: |
Regional Target Funds |
| Category |
Safety |
MR |
AC |
RES |
TE |
CA/HC |
Total |
|---|---|---|---|---|---|---|---|
Score |
10 out of 30 |
16 out of 29 |
17 out of 29 |
10 out of 16 |
0 out of 12 |
2 out of 18 |
55 out of 134 |
The project improves multimodal access between Hingham Center, residential areas, and Hingham Harbor by extending the existing buffered, shared-use bike path from Rockland Street to the Hingham inner harbor. In addition, improvements to reduce vehicular accidents will be incorporated through the establishment of turn lanes and a small roundabout at the intersection of Route 3A and Summer Street. The project will include drainage improvements throughout the project limits.
Source |
(FFY) 2026 |
2027 |
2028 |
2029 |
2030 |
Total |
Federal Funds |
$17,559,625 |
$8,000,000 |
– |
– |
– |
$25,559,625 |
Non-Federal Funds |
$4,389,906 |
$2,000,000 |
– |
– |
– |
$6,389,906 |
Total Funds |
$21,949,531 |
$10,000,000 |
— |
— |
— |
$31,949,531 |
| Proponent: |
MassDOT |
|---|---|
ID Number: |
613477 |
Project Type: |
Safe Routes to School |
Cost: |
$1,012,500 |
Funding Source: |
Statewide Highway Funds |
This is a MassDOT-prioritized project and is therefore not directly evaluated using the MPO’s TIP scoring criteria.
The project includes installing new and reconstructing existing sidewalks along Linden Street adding a new crosswalk constructing ADA accessible ramps and installing a pedestrian warning flasher assembly at Linden Street around Grove Street and Avon Street.
Source |
(FFY) 2026 |
2027 |
2028 |
2029 |
2030 |
Total |
Federal Funds |
– |
– |
$810,000 |
– |
– |
$810,000 |
Non-Federal Funds |
– |
– |
$202,500 |
– |
– |
$202,500 |
Total Funds |
— |
— |
$1,012,500 |
— |
— |
$1,012,500 |
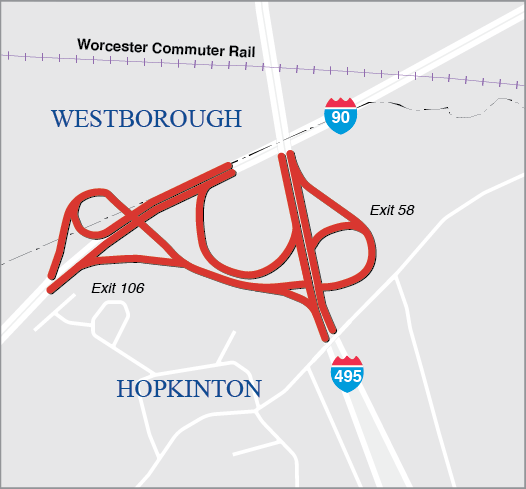
| Proponent: |
MassDOT |
|---|---|
ID Number: |
607977 |
Project Type: |
Roadway Reconstruction |
Cost: |
$300,942,837 |
Funding Source: |
Statewide Highway Funds, Earmark Discretionary |
This is a MassDOT-prioritized project and is therefore not directly evaluated using the MPO’s TIP scoring criteria.
The project proposes to design and construct improvements of the I-495/ I-90 interchange, located in the towns of Hopkinton and Westborough, Massachusetts, including to replace, demolish, design and construct, and/or rehabilitate 18 structures within the project limits.
Source |
(FFY) 2026 |
2027 |
2028 |
2029 |
2030 |
Total |
Federal Funds |
$49,907,115 |
$11,541,927 |
– |
– |
– |
$61,449,042 |
Non-Federal Funds |
$12,476,779 |
$2,885,482 |
– |
– |
– |
$15,362,261 |
Total Funds |
$62,383,894 |
$14,427,409 |
— |
— |
— |
$76,811,303 |
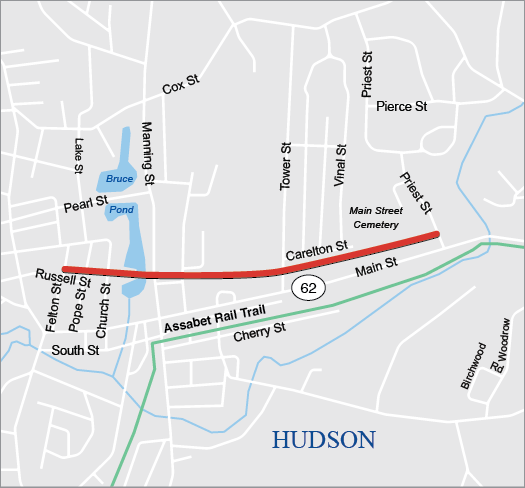
| Proponent: |
Hudson |
|---|---|
ID Number: |
S13048 |
Project Type: |
Bicycle and Pedestrian |
Cost: |
$909,700 |
Funding Source: |
Regional Target Funds |
Category |
Safety |
MR |
AC |
RES |
TE |
CA/HC |
Total |
Score |
11.5 out of 16 |
13.5 out of 15 |
12 out of 17 |
13 out of 14 |
5.4 out of 20 |
13 out of 16 |
68.4 out of 100 |
This project will design the extension of the Massachusetts Central Rail Trail (MCRT) through Hudson, starting near Priest Street and extending westward along a former rail alignment running parallel to Route 62 to the Berlin town line. Construction of the project will likely be executed in multiple phases.
Source |
(FFY) 2026 |
2027 |
2028 |
2029 |
2030 |
Total |
Federal Funds |
$727,760 |
– |
– |
– |
– |
$727,760 |
Non-Federal Funds |
$181,940 |
– |
– |
– |
– |
$181,940 |
Total Funds |
$909,700 |
— |
— |
— |
— |
$909,700 |
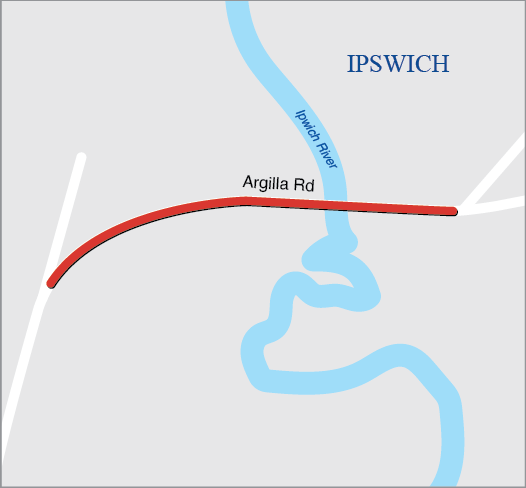
Proponent: |
Ipswich |
ID Number: |
612738 |
Project Type: |
Complete Streets |
Cost: |
$5,183,829 |
Funding Source: |
Regional Target Funds |
Category |
Safety |
MR |
AC |
RES |
TE |
CA/HC |
Total |
Score |
2.5 out of 16 |
7 out of 19 |
7 out of 15 |
11 out of 14 |
2.4 out of 20 |
8 out of 16 |
37.9 out of 100 |
This project will reconstruct and elevate Argilla Road between the Crane Estate driveway and Crane Beach parking lot entrance in order to protect against sunny day and King Tide coastal flood conditions through 2100. The project will widen an existing culvert and introduce new culverts in order to improve horizontal transmission of floodwaters and the marsh beneath the roadway, limiting contamination of sensitive environmental areas and further reducing the possibility for floodwaters to overtop the roadway. The project will incorporate a stabilized shoulder and embankment using native plantings to mitigate scouring and erosion while providing a safer shoulder to improve access without damaging the nearby marsh. The project also incorporates intersection safety and geometry improvements at the driveway to the Crane Estate.
Source |
(FFY) 2026 |
2027 |
2028 |
2029 |
2030 |
Total |
Federal Funds |
– |
– |
– |
$5,183,829 |
– |
$5,183,829 |
Non-Federal Funds |
– |
– |
– |
$4,147,063 |
– |
$4,147,063 |
Total Funds |
— |
— |
— |
$1,036,766 |
— |
$1,036,766 |
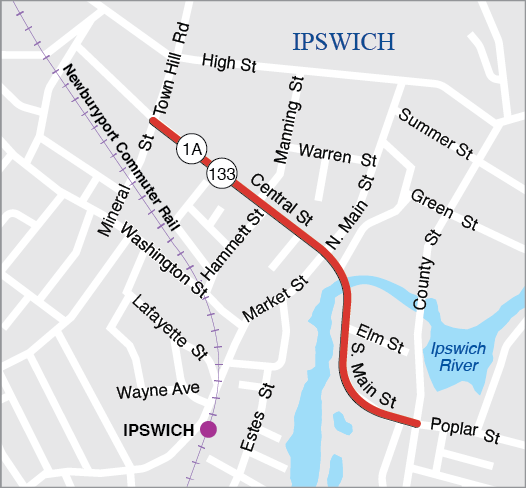
| Proponent: |
Ipswich |
|---|---|
ID Number: |
605743 |
Project Type: |
Complete Streets |
Cost: |
$15,035,254 |
Funding Source: |
Regional Target Funds |
| Category |
Safety |
Sys Pres |
CM/M |
CA/SC |
TE |
EV |
Total |
|---|---|---|---|---|---|---|---|
Score |
11 out of 30 |
10 out of 29 |
10 out of 29 |
6 out of 16 |
2 out of 12 |
8 out of 18 |
47 out of 134 |
In Ipswich, the project will reconstruct the roadway between Mineral Street and Poplar Street (3,200 feet) to improve the roadway surface. Minor geometric improvements at intersection and pedestrian crossings will be included. Sidewalks and wheelchair ramps will be improved in selected areas for ADA compliance. The drainage system is undersized and will be upgraded.
Source |
(FFY) 2026 |
2027 |
2028 |
2029 |
2030 |
Total |
Federal Funds |
– |
$4,800,000 |
$7,228,203 |
– |
– |
$12,028,203 |
Non-Federal Funds |
– |
$1,200,000 |
$1,807,051 |
– |
– |
$3,007,051 |
Total Funds |
— |
$6,000,000 |
$9,035,254 |
— |
— |
$15,035,254 |
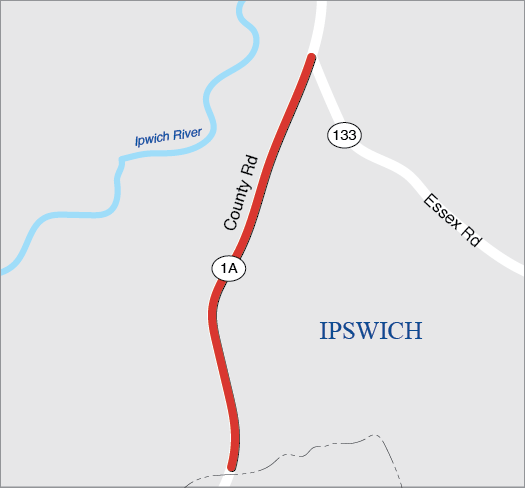
| Proponent: |
MassDOT |
|---|---|
ID Number: |
612027 |
Project Type: |
Non-Interstate Pavement |
Cost: |
$2,195,025 |
Funding Source: |
Statewide Highway Funds |
This is a MassDOT-prioritized project and is therefore not directly evaluated using the MPO’s TIP scoring criteria.
This project involves resurfacing on Route 1A from Long Causeway Brook to the intersection with Route 133.
Source |
(FFY) 2026 |
2027 |
2028 |
2029 |
2030 |
Total |
Federal Funds |
– |
– |
– |
– |
$1,756,020 |
$1,756,020 |
Non-Federal Funds |
– |
– |
– |
– |
$439,005 |
$439,005 |
Total Funds |
— |
— |
— |
— |
$2,195,025 |
$2,195,025 |
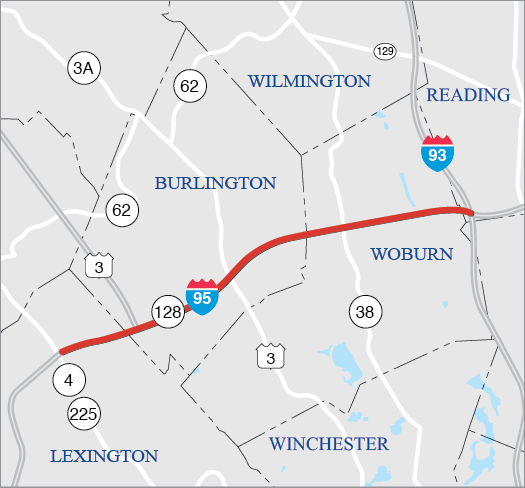
Proponent: |
MassDOT |
ID Number: |
613994 |
Project Type: |
Safety Improvements |
Cost: |
$1,852,340 |
Funding Source: |
Statewide Highway Funds |
This is a MassDOT-prioritized project and is therefore not directly evaluated using the MPO’s TIP scoring criteria.
This project is for the replacement of the existing guide and traffic signs on I-95 (Route 128) between Routes 4/225 in Lexington and I-93 in Woburn, including applicable signing on secondary roadways.
Source |
(FFY) 2026 |
2027 |
2028 |
2029 |
2030 |
Total |
Federal Funds |
$1,481,872 |
– |
– |
– |
– |
$1,481,872 |
Non-Federal Funds |
$370,468 |
– |
– |
– |
– |
$370,468 |
Total Funds |
$1,852,340 |
— |
— |
— |
— |
$1,852,340 |
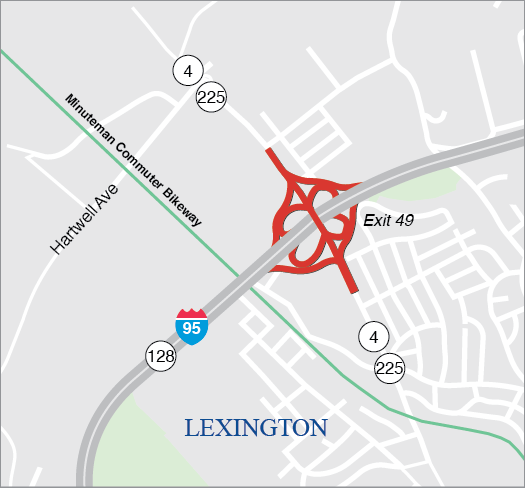
| Proponent: |
Lexington |
|---|---|
ID Number: |
S13146 |
Project Type: |
Major Infrastructure |
Cost: |
$1,650,000 |
Funding Source: |
Regional Target Funds |
This project is funded using Regional Target funds but was not scored using the MPO’s TIP project selection criteria. The project was evaluated through the MPO’s Long-Range Transportation Plan process.
This project provides design funding for an initial stage of improvements at the Interstate 95 and Route 4/225 Interchange in Lexington. The design will investigate and develop improvements at the interchange that, when implemented, will enable further traffic-calming work to be conducted on Route 4/225, Hartwell Avenue, and Wood Street. This project is listed in the MPO’s Long Range Transportation Plan, Destination 2050.
Source |
(FFY) 2026 |
2027 |
2028 |
2029 |
2030 |
Total |
Federal Funds |
$1,320,000 |
– |
– |
– |
– |
$1,320,000 |
Non-Federal Funds |
$330,000 |
– |
– |
– |
– |
$330,000 |
Total Funds |
$1,650,000 |
— |
— |
— |
— |
$1,650,000 |
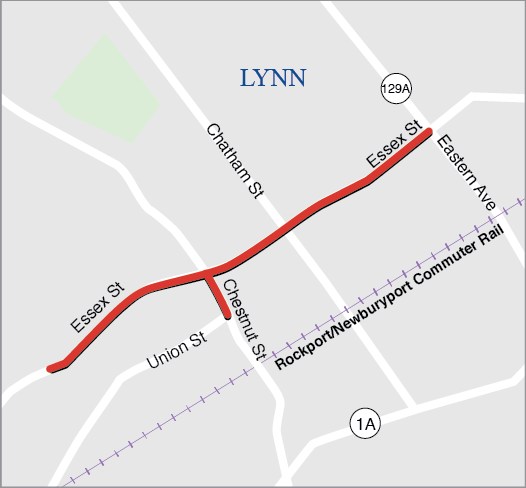
| Proponent: |
Lynn |
|---|---|
ID Number: |
609252 |
Project Type: |
Complete Streets |
Cost: |
$23,567,554 |
Funding Source: |
Regional Target Funds |
| Category |
Safety |
Sys Pres |
CM/M |
CA/SC |
TE |
EV |
Total |
|---|---|---|---|---|---|---|---|
Score |
19 out of 30 |
17 out of 29 |
9 out of 29 |
8 out of 16 |
10 out of 12 |
2 out of 18 |
66 out of 134 |
This project is focused on making key safety improvements for pedestrians and bicyclists. Existing sidewalks on Essex Street will be reconstructed to ADA/AAB standards and will be complemented by the addition of new on-street bicycle facilities. Pedestrian safety will be improved through the construction of curb bump-outs at intersections to reduce crosswalk length. In addition, operational improvements such as signal updates and pavement markings will be established to enhance safety.
Source |
(FFY) 2026 |
2027 |
2028 |
2029 |
2030 |
Total |
Federal Funds |
– |
– |
$10,854,043 |
$8,000,000 |
– |
$18,854,043 |
Non-Federal Funds |
– |
– |
$2,713,511 |
$2,000,000 |
– |
$4,713,511 |
Total Funds |
— |
— |
$13,567,554 |
$10,000,000 |
— |
$23,567,554 |
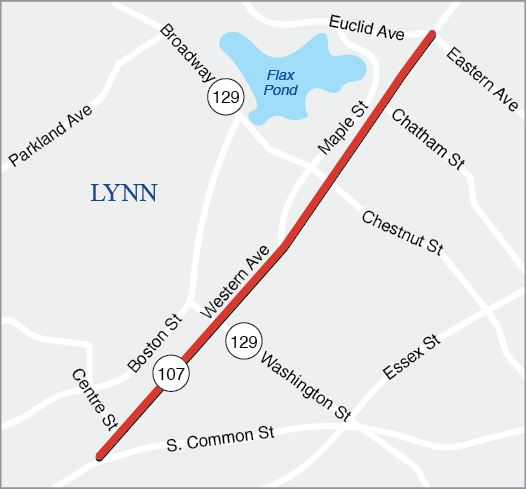
Proponent: |
Lynn |
ID Number: |
609246 |
Project Type: |
Complete Streets |
Cost: |
$45,897,600 |
Funding Source: |
Regional Target Funds |
Category |
Safety |
Sys Pres |
CM/M |
CA/SC |
TE |
EV |
Total |
Score |
18 out of 18 |
14 out of 20 |
10 out of 18 |
11 out of 12 |
11.9 out of 20 |
10 out of 12 |
74.9 out of 100 |
This project will reconstruct 1.9 miles of Western Avenue (Route 107) in Lynn between Centre Street and Eastern Avenue. Work will include roadway pavement reconstruction, drainage improvements, improved design for traffic operations and safety, new signs and pavement markings, and bicycle and ADA-compliant pedestrian improvements. This project includes improvements to bus stop locations throughout the corridor and bus-priority elements will be considered during the design phase. A key goal of this project is to enhance safety along the corridor, as this segment of Western Avenue has three 2017–19 top-200 crash clusters, four 2017–19 all-mode crash clusters, one 2010–19 bicycle crash cluster, and one 2010-19 pedestrian crash cluster, making it a high-priority safety improvement location statewide. This project is anticipated to be funded over three fiscal years, with funding beginning in FFY 2027.
Source |
(FFY) 2026 |
2027 |
2028 |
2029 |
2030 |
Total |
Federal Funds |
– |
– |
– |
$8,000,000 |
$12,000,000 |
$20,000,000 |
Non-Federal Funds |
– |
– |
– |
$2,000,000 |
$3,000,000
|
$5,000,000 |
Total Funds |
— |
— |
— |
$10,000,000 |
$15,000,000 |
$25,000,000 |
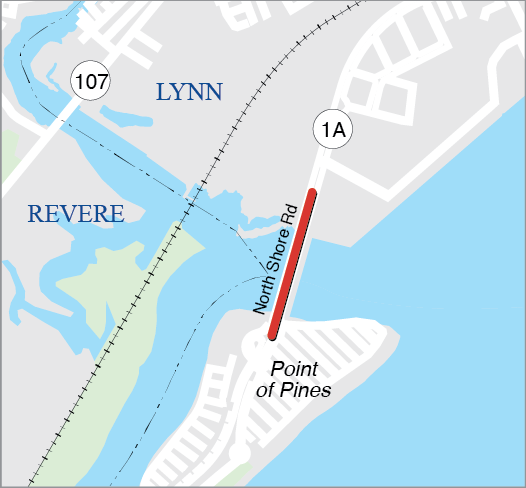
Proponent: |
MassDOT |
ID Number: |
608396 |
Project Type: |
Bridge |
Cost: |
$151,853,184 |
Funding Source: |
Statewide Highway Funds |
This is a MassDOT-prioritized project and is therefore not directly evaluated using the MPO’s TIP scoring criteria.
This project will perform substructure and superstructure repairs and construction for the General Edwards Bridge carrying the Route 1A Lynnway over the Saugus River between Revere and Lynn. This project is expected to be funded between FFYs 2028, 2029, and 2030.
Source |
(FFY) 2026 |
2027 |
2028 |
2029 |
2030 |
Total |
Federal Funds |
– |
– |
$89,482,547 |
$32,000,000 |
– |
$121,482,547 |
Non-Federal Funds |
– |
– |
$22,370,637 |
$8,000,000 |
– |
$30,370,637 |
Total Funds |
— |
— |
$111,853,184 |
$40,000,000 |
— |
$151,853,184 |
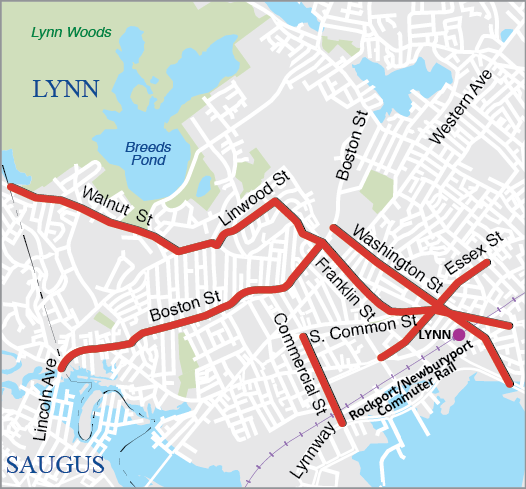
| Proponent: |
MassDOT |
|---|---|
ID Number: |
612599 |
Project Type: |
Safety Improvements |
Cost: |
$16,729,418 |
Funding Source: |
Statewide Highway Funds |
This is a MassDOT-prioritized project and is therefore not directly evaluated using the MPO’s TIP scoring criteria.
This project will implement targeted safety improvements at key locations in Lynn as identified in the Lynn Safe Streets for People Playbook. This multimodal safety plan was created by the City of Lynn in partnership with MassDOT and identified priority streets for improvement and developed strategies to support the creation of a safe network for all users, with an emphasis on walking, biking, and taking transit. The project will involve the implementation of both corridor- and intersection-level treatments and amenities for street users on a systemic basis. The street corridors in this phase will include Walnut Street, Franklin Street, Linwood Street, Washington Street, Boston Street, Essex Street, Liberty Street, Tremont Street, Central Avenue, Exchange Street, and Commercial Street. Corridor treatments will include the installation of protected bicycle lanes, shared streets treatments, and traffic-calming measures such as speed cushions or humps. Intersection treatments will include curb ramps and extensions, geometric adjustments, raised crosswalks, installation of rectangular-rapid-flashing beacons, and signal equipment and timing upgrades. Amenities for street users will include the installation of bicycle parking, improved bus shelters, signage, and benches, floating bus stops, and bus bulbs.
Source |
(FFY) 2026 |
2027 |
2028 |
2029 |
2030 |
Total |
Federal Funds |
– |
$6,400,000 |
– |
– |
– |
$6,400,000 |
Non-Federal Funds |
– |
$1,600,000 |
– |
– |
– |
$1,600,000 |
Total Funds |
— |
$8,000,000 |
— |
— |
|
$8,000,000 |
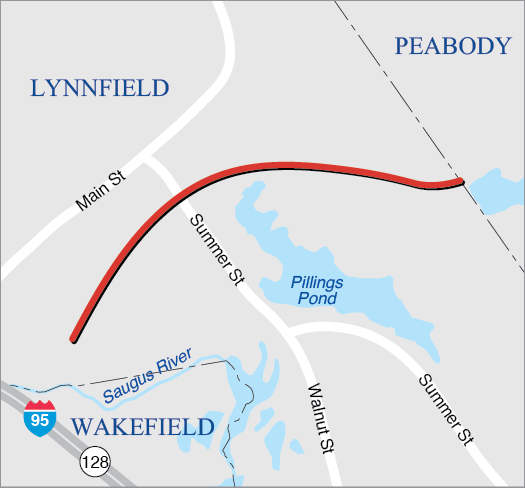
Proponent: |
Lynnfield |
ID Number: |
613163 |
Project Type: |
Bicycle and Pedestrian |
Cost: |
$5,829,514 |
Funding Source: |
Regional Target Funds |
This project is funded using Regional Target funds but was not scored using the MPO’s TIP project selection criteria for the Bicycle and Pedestrian program as it was programmed after the project evaluation period to utilize available funding in FFY 2026.
This project constructs the first section of the Wakefield/Lynnfield Rail Trail, starting from Ford Avenue to Nichols Lane in Lynnfield. The entire Wakefield/Lynnfield Rail Trail extends from the Galvin Middle School in Wakefield north to the Lynnfield/Peabody town line, a distance of approximately 4.4 miles. Approximately 1.9 miles of the trail is located within Wakefield and 2.5 miles in Lynnfield. The corridor is the southern section of the former Newburyport Railroad and will connect to Peabody and the regional Border to Boston Trail. This project was previously programmed under the Statewide Highway Program until the FFYs 2026-30 TIP.
Source |
(FFY) 2026 |
2027 |
2028 |
2029 |
2030 |
Total |
Federal Funds |
$4,663,611 |
– |
– |
– |
– |
$4,663,611 |
Non-Federal Funds |
$1,165,903 |
– |
– |
– |
– |
$1,165,903 |
Total Funds |
$5,829,514 |
— |
— |
— |
|
$5,829,514 |
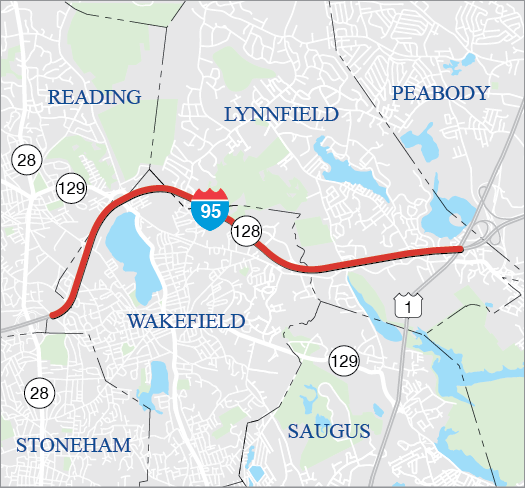
Proponent: |
MassDOT |
ID Number: |
613383 |
Project Type: |
Interstate Pavement |
Cost: |
$12,942,963 |
Funding Source: |
Statewide Highway Funds |
This is a MassDOT-prioritized project and is therefore not directly evaluated using the MPO’s TIP scoring criteria.
This project proposes to preserve the open-graded friction course on I-95 in Lynnfield and Wakefield.
Source |
(FFY) 2026 |
2027 |
2028 |
2029 |
2030 |
Total |
Federal Funds |
$10,354,370 |
– |
– |
– |
– |
$10,354,370 |
Non-Federal Funds |
$2,588,593 |
– |
– |
– |
– |
$2,588,593 |
Total Funds |
$12,942,963 |
— |
— |
— |
|
$12,942,963 |
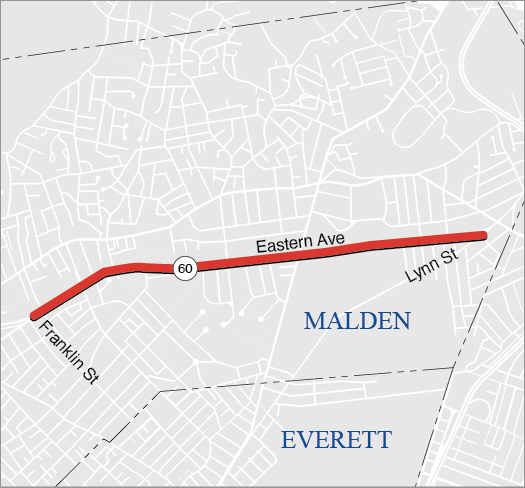
Proponent: |
Malden |
ID Number: |
S13294 |
Project Type: |
Complete Streets |
Cost: |
$800,000 |
Funding Source: |
Regional Target Funds |
Category |
Safety |
MR |
AC |
RES |
TE |
CA/HC |
Total |
Score |
14.5 out of 16 |
17 out of 19 |
10.5 out of 15 |
10 out of 14 |
9.5 out of 20 |
8 out of 16 |
69.1 out of 100 |
This project will design improvements to resurface Commercial Street in Malden. Sidewalks may be widened, and 9,000 feet of linear buffered bicycle facilities may be added. The project also aims to improve transit user experience for riders of MBTA buses, with roadway geometry improved for safer bus and commercial vehicle navigation. This design will include Phase 1 (Lynn Street to Broadway) and Phase 2 (Broadway to Franklin Street).
Source |
(FFY) 2026 |
2027 |
2028 |
2029 |
2030 |
Total |
Federal Funds |
$640,000 |
– |
– |
– |
– |
$640,000 |
Non-Federal Funds |
$160,000 |
– |
– |
– |
– |
$160,000 |
Total Funds |
$800,000 |
— |
— |
— |
|
$800,000 |
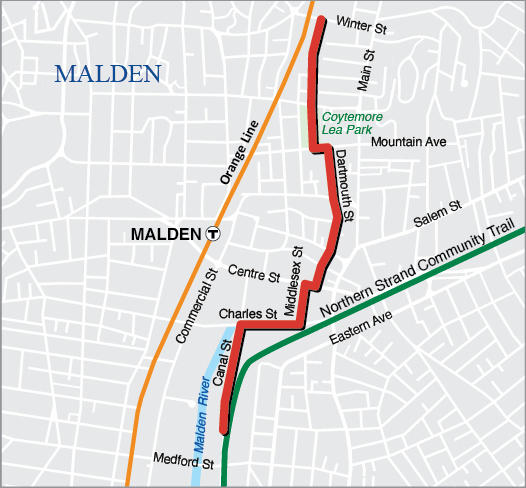
| Proponent: |
Malden |
|---|---|
ID Number: |
613088 |
Project Type: |
Bicycle and Pedestrian |
Cost: |
$4,858,127 |
Funding Source: |
Regional Target Funds |
| Category |
Safety |
Sys Pres |
CM/M |
CA/SC |
TE |
EV |
Total |
|---|---|---|---|---|---|---|---|
Score |
16.5 out of 30 |
10 out of 29 |
18 out of 29 |
5 out of 16 |
12 out of 12 |
11.5 out of 18 |
73 out of 134 |
This project will construct a 1.1 mile shared-use path connecting Coytemore Lea Park in Malden’s Oak Grove neighborhood with the Northern Strand Community Trail and Malden River via downtown Malden. The project will replace existing sidewalk infrastructure and adjust roadway widths to accommodate a new 11-foot-wide shared-use facility within the existing right-of-way.
Source |
(FFY) 2026 |
2027 |
2028 |
2029 |
2030 |
Total |
Federal Funds |
– |
– |
– |
$3,886,502 |
– |
$3,886,502 |
Non-Federal Funds |
– |
– |
– |
$971,625 |
– |
$971,625 |
Total Funds |
— |
— |
— |
$4,858,127 |
— |
$4,858,127 |
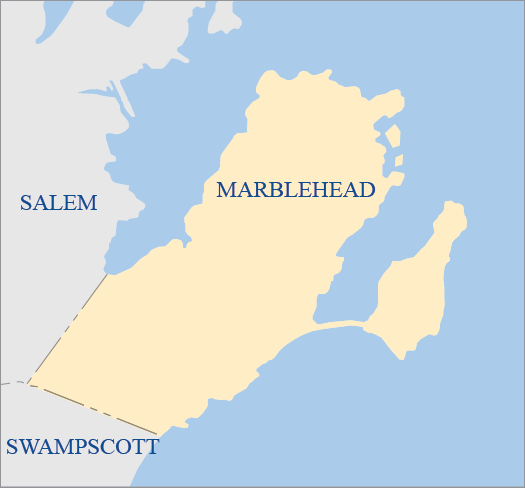
| Proponent: |
Marblehead |
|---|---|
ID Number: |
S13184 |
Project Type: |
Community Connections |
Cost: |
$6,250 |
Funding Source: |
Regional Target Funds |
| Category |
Conn |
Coord |
Plan |
TE |
CCM |
PM |
Total |
|---|---|---|---|---|---|---|---|
Score |
10 out of 18 |
10 out of 16 |
13 out of 18 |
7 out of 20 |
12 out of 18 |
9 out of 10 |
61 out of 100 |
This line item will procure and support installation of 22 bicycle racks with 117 total spaces across the Town of Marblehead.
| Source |
(FFY) 2026 |
2027 |
2028 |
2029 |
2030 |
Total |
|---|---|---|---|---|---|---|
Federal Funds |
$5,000 |
– |
– |
– |
– |
$5,000 |
Non-Federal Funds |
$1,250 |
– |
– |
– |
– |
$1,250 |
Total Funds |
$6,250 |
— |
— |
— |
— |
$6,250 |
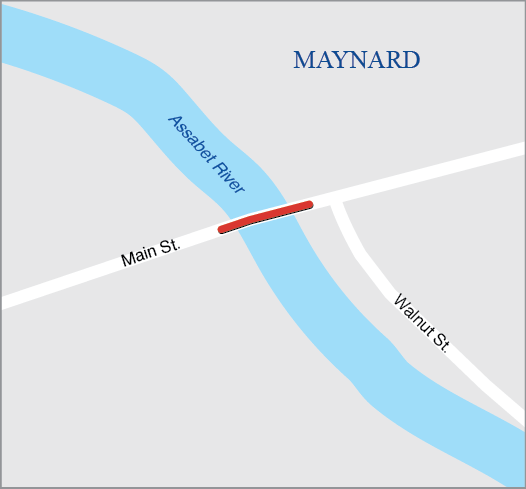
| Proponent: |
MassDOT |
|---|---|
ID Number: |
604564 |
Project Type: |
Bridge |
Cost: |
$8,410,036 |
Funding Source: |
Statewide Highway Funds |
This is a MassDOT-prioritized project and is therefore not directly evaluated using the MPO’s TIP scoring criteria.
The purpose of this project is to replace the bridge carrying Main Street (Route 62) over the Assabet River in the Town of Maynard. The existing bridge, which was built in 1922, has a curb-to-curb width of 36 feet with two 6.8-foot sidewalks. The proposed bridge curb-to-curb width will remain the same. Main Street is a two-lane, two-way, urban principal arterial. Work on the roadway will include full depth reconstruction of 300 feet beyond the bridge on both approaches. Once beyond the limits of reconstruction, the pavement will be cold planned to match the existing pavement on the two approaches. The demolition, removal, and replacement of the existing bridge will be completed in stages to allow two lanes of opposing traffic and pedestrian access at all times.
Source |
(FFY) 2026 |
2027 |
2028 |
2029 |
2030 |
Total |
Federal Funds |
– |
– |
$6,728,029 |
– |
– |
$6,728,029 |
Non-Federal Funds |
– |
– |
$1,682,007 |
– |
– |
$1,682,007 |
Total Funds |
— |
— |
$8,410,036 |
— |
— |
$8,410,036 |
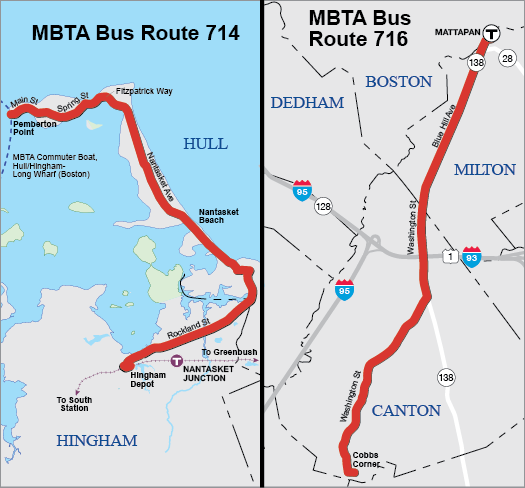
Proponent: |
MBTA |
ID Number: |
S13152 |
Project Type: |
Transit Transformation |
Cost: |
$3,216,897 |
Funding Source: |
Regional Target Funds |
Category |
Safety |
MR |
AC |
RES |
TE |
CA/HC |
Total |
Score |
10 out of 16 |
12 out of 16 |
11 out of 16 |
3 out of 16 |
5.6 out of 20 |
3 out of 15 |
44.6 out of 100 |
As part of the MBTA Better Bus Project, this project will make operational safety improvements at bus stops along the 714 and 716 bus routes. The MBTA will build or improve bus stop curbs, sidewalks, signage, markings, and shelters, accessibility and customer experience where conditions are unsafe, inaccessible, in poor state of operation or repair, or where bus stops do not exist at all.
Source |
(FFY) 2026 |
2027 |
2028 |
2029 |
2030 |
Total |
Federal Funds |
$2,573,518 |
– |
– |
– |
– |
$2,573,518 |
Non-Federal Funds |
$643,379 |
– |
– |
– |
– |
$643,379 |
Total Funds |
$3,216,897 |
— |
— |
— |
— |
$3,216,897 |
Proponent: |
MBTA |
ID Number: |
S13153 |
Project Type: |
Transit Transformation |
Cost: |
$7,000,000 |
Funding Source: |
Regional Target Funds |
Category |
Safety |
MR |
AC |
RES |
TE |
CA/HC |
Total |
Score |
11 out of 16 |
13 out of 16 |
13 out of 16 |
3 out of 16 |
6 out of 20 |
3 out of 15 |
48 out of 100 |
This project will address key priority areas for improving the accessibility and safety of the MBTA bus network. This project was funded with and additional $1,000,000 in FFY 2025.
Source |
(FFY) 2026 |
2027 |
2028 |
2029 |
2030 |
Total |
Federal Funds |
$4,800,000 |
– |
– |
– |
– |
$4,800,000 |
Non-Federal Funds |
$1,200,000 |
– |
– |
– |
– |
$1,200,000 |
Total Funds |
$6,000,000 |
— |
— |
— |
— |
$6,000,000 |

Proponent: |
MBTA |
ID Number: |
S13292 |
Project Type: |
Transit Transformation |
Cost: |
$1,875,000 |
Funding Source: |
Regional Target Funds |
This project was submitted for consideration following completion of the scoring process for Transit Transformation projects in the FFYs 2026–30 TIP.
This project will enable expanded service hours and frequency for MBTA bus routes 714 and 716, serving the communities of Boston (Mattapan), Canton, Hingham, Hull, and Milton. Improvements include reduced headways, Sunday service for the 716 bus, and improved first-and-last-mile connections to Commuter Rail Stations (Nantasket Junction, Canton Center, Route 128) and state parks.
Source |
(FFY) 2026 |
2027 |
2028 |
2029 |
2030 |
Total |
Federal Funds |
$1,500,000 |
– |
– |
– |
– |
$1,500,000 |
Non-Federal Funds |
$375,000 |
– |
– |
– |
– |
$375,000 |
Total Funds |
$1,875,000 |
— |
— |
— |
— |
$1,875,000 |

| Proponent: |
MassDOT |
|---|---|
ID Number: |
611974 |
Project Type: |
Intersection Improvements |
Cost: |
$10,303,377 |
Funding Source: |
Statewide Highway Funds |
This is a MassDOT-prioritized project and is therefore not directly evaluated using the MPO’s TIP scoring criteria.
This project will make safety improvements to the intersection of Main Street and South Street in Medford. This location has a 2010–19 pedestrian crash cluster and a 2017–19 top-200 crash location (statewide), making it a high-priority safety improvement location. The scope of this project involves reconstruction of the intersection either by constructing a roundabout or reconstructing and updating the signal control system and lane assignments. A detailed alternatives analysis will be conducted to identify the preferred traffic control for the intersection, in addition to improvements to accessibility, and bicycle and pedestrian accommodations. This project will build upon the analysis done in the Medford Square Priority Roadways Improvement Study published by the Boston Region MPO in December 2018.
Source |
(FFY) 2026 |
2027 |
2028 |
2029 |
2030 |
Total |
Federal Funds |
$8,242,702 |
– |
– |
– |
– |
$8,242,702 |
Non-Federal Funds |
$2,060,675 |
– |
– |
– |
– |
$2,060,675 |
Total Funds |
$10,303,377 |
— |
— |
— |
— |
$10,303,377 |
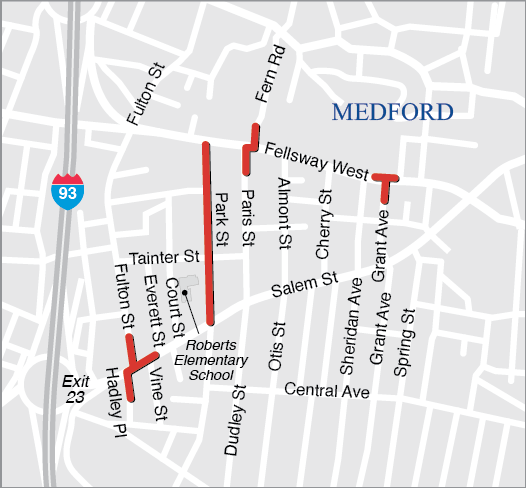
| Proponent: |
MassDOT |
|---|---|
ID Number: |
612001 |
Project Type: |
Safe Routes to School |
Cost: |
$1,186,065 |
Funding Source: |
Statewide Highway Funds |
This is a MassDOT-prioritized project and is therefore not directly evaluated using the MPO’s TIP scoring criteria.
This project includes pedestrian improvements at three key intersections for students approaching Roberts Elementary School. Improvements include the following: a full pedestrian signal, curb extensions, and improved lighting at the intersection of the Fellsway with Paris Street and Fern Road, and sidewalk improvements from this intersection to the Roberts School along Park Street; pedestrian realignment, curb bump-outs, and pedestrian rapid-flashing beacons at the intersection of Salem Street and Hadley Place; and pedestrian rapid-flashing beacons, curb extensions, and improved lighting at the intersection of the Fellsway and Grant Avenue.
| Source |
(FFY) 2026 |
2027 |
2028 |
2029 |
2030 |
Total |
|---|---|---|---|---|---|---|
Federal Funds |
– |
$948,852 |
– |
– |
– |
$948,852 |
Non-Federal Funds |
– |
$237,213 |
– |
– |
– |
$237,213 |
Total Funds |
— |
$1,186,065 |
— |
— |
— |
$1,186,065 |
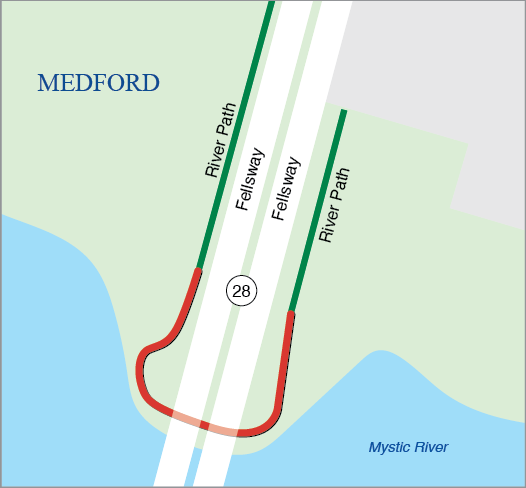
| Proponent: |
MassDOT |
|---|---|
ID Number: |
611982 |
Project Type: |
Bicycle and Pedestrian |
Cost: |
$5,488,945 |
Funding Source: |
Regional Target Funds |
This is a MassDOT-prioritized project and is therefore not directly evaluated using the MPO’s TIP scoring criteria.
This project will enhance bicycle and pedestrian travel in Medford by creating a shared-use path connection under Route 28 (Fellsway) along the Mystic River. This connection will be similar to a shared-use boardwalk on the opposite side of the Mystic River in Somerville, which also runs under Route 28. Once complete, this project will be a critical connection between existing riverfront pathways along the Mystic River in Medford, including the Wellington Greenway on the east side of Route 28 and the path system within the Mystic River State Reservation on the west side of Route 28.
Source |
(FFY) 2026 |
2027 |
2028 |
2029 |
2030 |
Total |
Federal Funds |
$4,391,156 |
– |
– |
– |
– |
$4,391,156 |
Non-Federal Funds |
$1,097,789 |
– |
– |
– |
– |
$1,097,789 |
Total Funds |
$5,488,945 |
— |
— |
— |
— |
$5,488,945 |
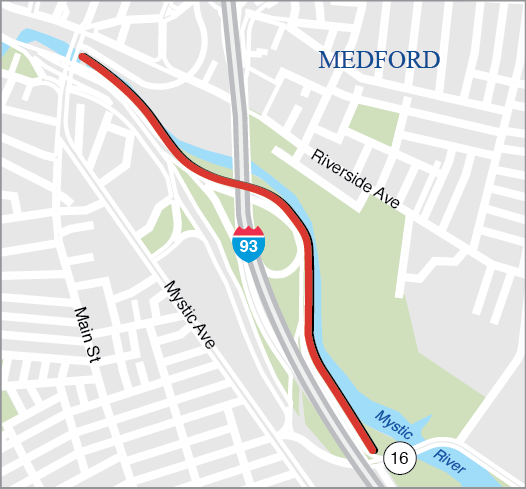
| Proponent: |
MassDOT |
|---|---|
ID Number: |
612499 |
Project Type: |
Bicycle and Pedestrian |
Cost: |
$7,903,743 |
Funding Source: |
Statewide Highway Funds |
This is a MassDOT-prioritized project and is therefore not directly evaluated using the MPO’s TIP scoring criteria.
This project will enhance bicycle and pedestrian connectivity in Medford by creating a shared-use path along the south side of the Mystic River. This project aims to provide a critical link in the regional transportation network by connecting two existing Department of Conservation and Recreation paths and supporting bicycle commuter access throughout the region. This project will construct an 8- to 10-foot wide pathway approximately one mile long primarily within the existing right-of-way of Route 16.
Source |
(FFY) 2026 |
2027 |
2028 |
2029 |
2030 |
Total |
Federal Funds |
– |
– |
– |
$6,322,994 |
– |
$6,322,994 |
Non-Federal Funds |
– |
– |
– |
$1,580,749 |
– |
$1,580,749 |
Total Funds |
— |
— |
— |
$7,903,743 |
— |
$7,903,743 |
.png)
| Proponent: |
MassDOT |
|---|---|
ID Number: |
613082 |
Project Type: |
Bicycle and Pedestrian |
Cost: |
$2,091,712 |
Funding Source: |
Statewide Highway Funds |
This is a MassDOT-prioritized project and is therefore not directly evaluated using the MPO’s TIP scoring criteria.
This project will construct the last phase of the Wellington Greenway, a 0.3-mile path along the Malden River connecting Wellington Station to existing trails such as the Northern Strand.
| Source |
(FFY) 2026 |
2027 |
2028 |
2029 |
2030 |
Total |
|---|---|---|---|---|---|---|
Federal Funds |
– |
– |
$1,673,370 |
– |
– |
$1,673,370 |
Non-Federal Funds |
– |
– |
$418,342 |
– |
– |
$418,342 |
Total Funds |
— |
— |
$2,091,712 |
— |
— |
$2,091,712 |
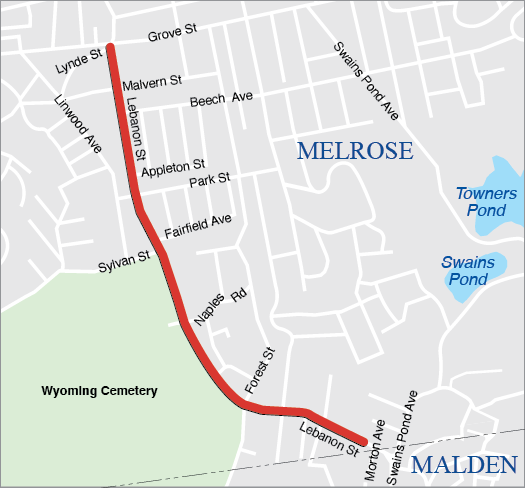
| Proponent: |
Melrose |
|---|---|
ID Number: |
612534 |
Project Type: |
Complete Streets |
Cost: |
$10,528,000 |
Funding Source: |
Regional Target Funds |
| Category |
Safety |
MR |
AC |
RES |
TE |
CA/HC |
Total |
|---|---|---|---|---|---|---|---|
Score |
12 out of 16 |
13 out of 19 |
12 out of 15 |
6 out of 14 |
4.4 out of 20 |
9 out of 16 |
56.4 out of 100 |
This project will improve roadway condition, ADA accessibility, and pedestrian and bicycle infrastructure on Lebanon Street from Lynde Street to the Malden City Line.
| Source |
(FFY) 2026 |
2027 |
2028 |
2029 |
2030 |
Total |
|---|---|---|---|---|---|---|
Federal Funds |
– |
– |
– |
– |
$8,422,400 |
$8,422,400 |
Non-Federal Funds |
– |
– |
– |
– |
$2,105,600 |
$2,105,600 |
Total Funds |
— |
— |
— |
— |
$10,528,000 |
$10,528,000 |
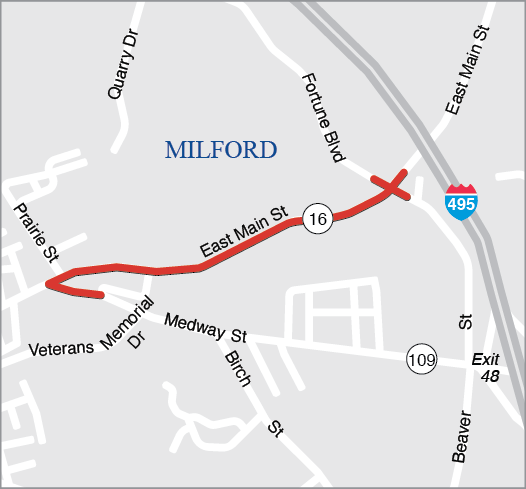
| Proponent: |
MassDOT |
|---|---|
ID Number: |
608045 |
Project Type: |
Complete Streets |
Cost: |
$13,548,565 |
Funding Source: |
Regional Target Funds |
| Category |
Safety |
Sys Pres |
CM/M |
CA/SC |
TE |
EV |
Total |
|---|---|---|---|---|---|---|---|
Score |
20 out of 20 |
7 out of 29 |
9 out of 29 |
-1 out of 16 |
3 out of 12 |
5 out of 18 |
43 out of 134 |
This project supports enhanced vehicular safety and traffic flow through the implementation of a road diet, additional roadway reconstruction, and enhanced signalization on the Route 16 (East Main Street) corridor from Route 109 (Medway Road) to Beaver Street. In addition, the project also addresses pedestrian and bicyclist safety through the addition of pavement markings for shared-use bike lanes and the construction of new six-foot sidewalks along both sides of the roadway.
Source |
(FFY) 2026 |
2027 |
2028 |
2029 |
2030 |
Total |
Federal Funds |
– |
$10,838,852 |
– |
– |
– |
$10,838,852 |
Non-Federal Funds |
– |
$2,709,713 |
– |
– |
– |
$2,709,713 |
Total Funds |
— |
$13,548,565 |
— |
— |
— |
$13,548,565 |

Proponent: |
MassDOT |
ID Number: |
612616 |
Project Type: |
Intersection Improvements |
Cost: |
$3,082,352 |
Funding Source: |
Statewide Highway Funds |
This is a MassDOT-prioritized project and is therefore not directly evaluated using the MPO’s TIP scoring criteria.
This project will reconstruct the five-legged intersection at Route 138 and Bradlee Road into a roundabout.
Source |
(FFY) 2026 |
2027 |
2028 |
2029 |
2030 |
Total |
Federal Funds |
– |
– |
– |
$2,465,882 |
– |
$2,465,882 |
Non-Federal Funds |
– |
– |
– |
$616,470 |
– |
$616,470 |
Total Funds |
— |
— |
— |
$3,082,352 |
— |
$3,082,352 |
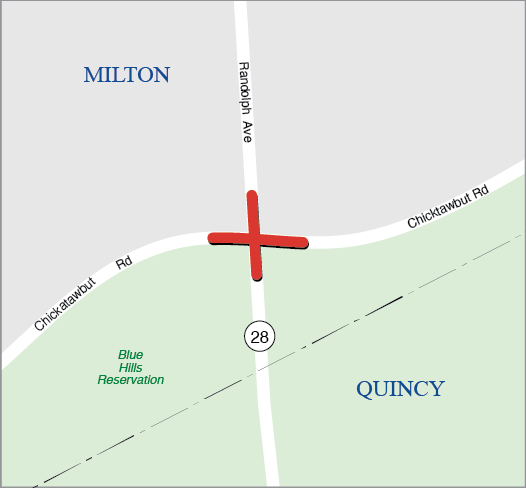
| Proponent: |
MassDOT |
|---|---|
ID Number: |
607342 |
Project Type: |
Intersection Improvements |
Cost: |
$11,597,752 |
Funding Source: |
Statewide Highway Funds |
This is a MassDOT-prioritized project and is therefore not directly evaluated using the MPO’s TIP scoring criteria.
The purpose of this project is to improve the existing signalized intersection by proposing a roundabout. Additional improvements include reducing the vertical curves along Randolph Avenue to improve sight distance, providing improved pedestrian accommodations to provide better connectivity to the surrounding neighborhoods and Blue Hills reservation parking lot, reducing impacts to sensitive parkland, and improving existing utilities in the project's footprint.
| Source |
(FFY) 2026 |
2027 |
2028 |
2029 |
2030 |
Total |
|---|---|---|---|---|---|---|
Federal Funds |
$9,278,202 |
– |
– |
– |
– |
$9,278,202 |
Non-Federal Funds |
$2,319,550 |
– |
– |
– |
– |
$2,319,550 |
Total Funds |
$11,597,752 |
— |
— |
— |
— |
$11,597,752 |
![]()
Proponent: |
MWRTA |
ID Number: |
S12807 |
Project Type: |
Community Connections |
Cost: |
$503,125 |
Funding Source: |
Regional Target Funds |
Category |
Conn |
Coord |
Plan |
TE |
CCM |
PM |
Total |
Score |
6 out of 18 |
2 out of 15 |
9 out of 15 |
9 out of 18 |
22 out of 24 |
10 out of 10 |
58 out of 100 |
This project will expand the MetroWest Regional Transit Authority’s (MWRTA) CatchConnect mictrotransit program within the municipalities of Framingham and Natick. The expanded service will improve weeknight mobility in evening hours between 7:30 PM and 10:30 PM Monday through Friday to provide a supplemental public transportation resource following the conclusion of traditional fixed-route service. This project is funded between FFYs 2024 and 2026.
Source |
(FFY) 2026 |
2027 |
2028 |
2029 |
2030 |
Total |
Federal Funds |
$130,000 |
– |
– |
– |
– |
$130,000 |
Non-Federal Funds |
$32,500 |
– |
– |
– |
– |
$32,500 |
Total Funds |
$162,500 |
— |
— |
— |
— |
$162,500 |
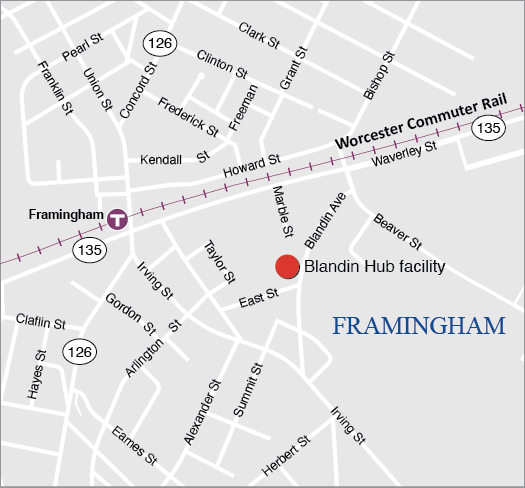
| Proponent: |
MWRTA |
|---|---|
ID Number: |
S12971 |
Project Type: |
Transit Transformation |
Cost: |
$8,500,000 |
Funding Source: |
Regional Target Funds |
Category |
Safety |
MR |
AC |
RES |
TE |
CA/HC |
Total |
Score |
8 out of 16 |
13 out of 16 |
16 out of 16 |
9 out of 16 |
12 out of 20 |
6 out of 15 |
64 out of 100 |
This project will design and engineer improvements to the MetroWest Regional Transit Authority’s Blandin Hub facility, the MWRTA’s primary operations and maintenance building and a key passenger transportation hub. The Blandin Hub may be upgraded to feature an ADA-accessible driver dispatch and driver area within the operations facility. The project includes upgrades to electrical systems and HVAC energy recovery, restrooms, and driver amenities for a new training facility and expanded vehicle bays. The design will expand the customer waiting and transfer area to include a weather-enclosed waiting space in addition to other rider amenities. This project was funded with $7,750,000 in FFY 2025 to support design and construction work.
| Source |
(FFY) 2026 |
2027 |
2028 |
2029 |
2030 |
Total |
|---|---|---|---|---|---|---|
Federal Funds |
$600,000 |
– |
– |
– |
– |
$600,000 |
Non-Federal Funds |
$150,000 |
– |
– |
– |
– |
$150,000 |
Total Funds |
$750,000 |
— |
— |
— |
— |
$750,000 |
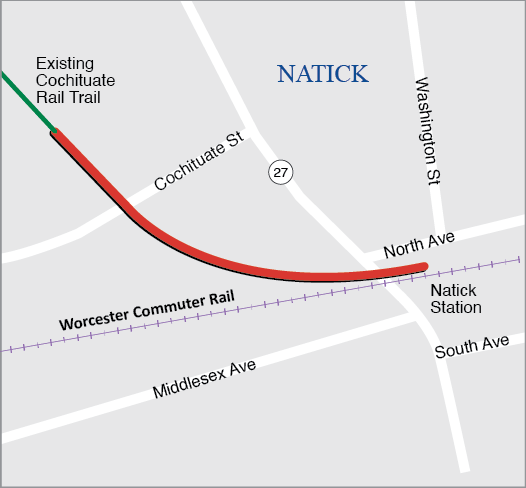
| Proponent: |
Natick |
|---|---|
ID Number: |
610691 |
Project Type: |
Bicycle Network and Pedestrian Connections |
Cost: |
$11,085,739 |
Funding Source: |
Regional Target Funds |
| Category |
Safety |
Sys Pres |
CM/M |
CA/SC |
TE |
EV |
Total |
|---|---|---|---|---|---|---|---|
Score |
12 out of 20 |
11 out of 14 |
18 out of 18 |
5 out of 14 |
8 out of 20 |
13 out of 14 |
67 out of 100 |
This project will extend the Cochituate Rail Trail in Natick from its current terminus at Mechanic Street southward via a shared-use bridge to connect to the Natick Center Commuter Rail Station and Route 27.
| Source |
(FFY) 2026 |
2027 |
2028 |
2029 |
2030 |
Total |
|---|---|---|---|---|---|---|
Federal Funds |
– |
– |
$8,868,591 |
– |
– |
$8,868,591 |
Non-Federal Funds |
– |
– |
$2,217,148 |
– |
– |
$2,217,148 |
Total Funds |
— |
— |
$11,085,739 |
— |
— |
$11,085,739 |
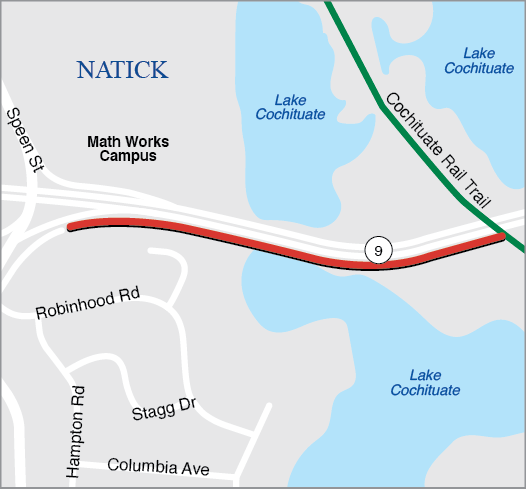
| Proponent: |
MassDOT |
|---|---|
ID Number: |
610680 |
Project Type: |
Bicycle and Pedestrian |
Cost: |
$6,084,913 |
Funding Source: |
Statewide Highway Funds |
This is a MassDOT-prioritized project and is therefore not directly evaluated using the MPO’s TIP scoring criteria.
This project includes a 0.4-mile segment of shared-used path along Route 9 in Natick. The project limits are from Archer Drive to the Cochituate Rail Trail. No roadway crossings are proposed, and the shared-use path will provide a bicycle and pedestrian connection between the Cochituate Rail Trail and the robust residential and commercial area that is located in close proximity to the project’s western terminus, filling a critical gap in the multimodal network.
Source |
(FFY) 2026 |
2027 |
2028 |
2029 |
2030 |
Total |
Federal Funds |
– |
$4,867,930 |
– |
– |
– |
$4,867,930 |
Non-Federal Funds |
– |
$1,216,983 |
– |
– |
– |
$1,216,983 |
Total Funds |
— |
$6,084,913 |
— |
— |
— |
$6,084,913 |
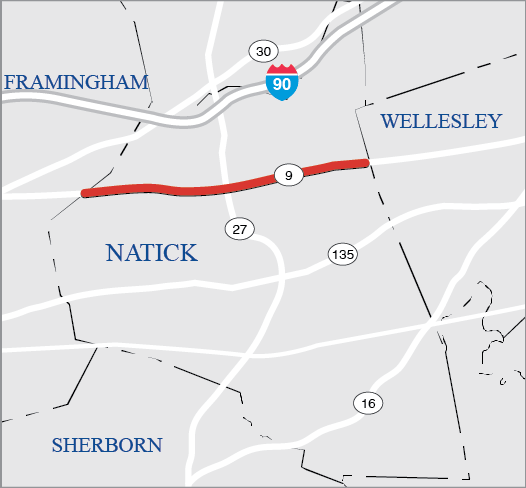
| Proponent: |
MassDOT |
|---|---|
ID Number: |
613640 |
Project Type: |
Roadway Reconstruction |
Cost: |
$4,019,400 |
Funding Source: |
Statewide Highway Funds |
This is a MassDOT-prioritized project and is therefore not directly evaluated using the MPO’s TIP scoring criteria.
This project proposes to rehabilitate a section of the pavement on Route 9 in Natick. The project will also address some safety and ADA issues within the scope of a pavement resurfacing project. The project was formerly consolidated into one project under Project ID 609402 in the FFYs 2024–28 TIP, which also included sections of Route 9 in Framingham. Please refer to Project #613639 for the section of Route 9 in Framingham.
| Source |
(FFY) 2026 |
2027 |
2028 |
2029 |
2030 |
Total |
|---|---|---|---|---|---|---|
Federal Funds |
– |
– |
– |
$3,215,520 |
– |
$3,215,520 |
Non-Federal Funds |
– |
– |
– |
$803,880 |
– |
$803,880 |
Total Funds |
— |
— |
— |
$4,019,400 |
— |
$4,019,400 |
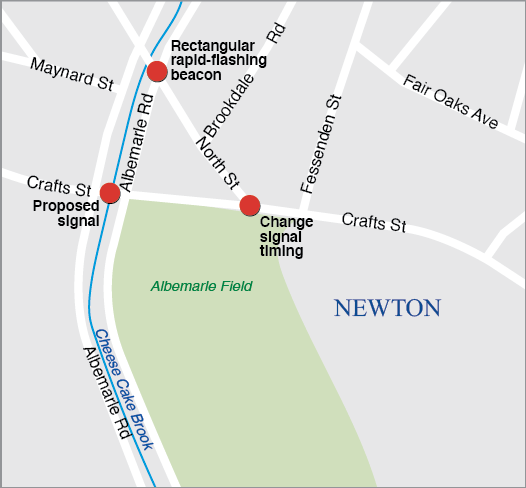
| Proponent: |
MassDOT |
|---|---|
ID Number: |
611997 |
Project Type: |
Safe Routes to School |
Cost: |
$1,519,171 |
Funding Source: |
Statewide Highway Funds |
This is a MassDOT-prioritized project and is therefore not directly evaluated using the MPO’s TIP scoring criteria.
This project will upgrade the intersections of Crafts Street and Albemarle Road and Albemarle Road and North Street, to improve bicycle and pedestrian accommodations near the Horace Mann Elementary School, FA Day Middle School, and the Newton Early Childhood Program. The project as proposed includes installing a fully actuated traffic signal at the Crafts Street and Albemarle Road intersection and a rapid-flashing-beacon crosswalk system at the Albemarle Road and North Street intersection. It will also require signal modifications to the existing traffic signal at Crafts Street at North Street.
| Source |
(FFY) 2026 |
2027 |
2028 |
2029 |
2030 |
Total |
|---|---|---|---|---|---|---|
Federal Funds |
$1,215,337 |
– |
– |
– |
– |
$1,215,337 |
Non-Federal Funds |
$303,834 |
– |
– |
– |
– |
$303,834 |
Total Funds |
$1,519,171 |
— |
— |
— |
— |
$1,519,171 |
.png)
| Proponent: |
MassDOT |
|---|---|
ID Number: |
613468 |
Project Type: |
Safe Routes to School |
Cost: |
$1,547,435 |
Funding Source: |
Statewide Highway Funds |
This is a MassDOT-prioritized project and is therefore not directly evaluated using the MPO’s TIP scoring criteria.
This project will implement bike and pedestrian safety improvements at the Parker Road and Route 9 intersection in support of students at the Oak Hill and Brown Middle Schools, Bowen Elementary School, and Newton South High School.
| Source |
(FFY) 2026 |
2027 |
2028 |
2029 |
2030 |
Total |
|---|---|---|---|---|---|---|
Federal Funds |
– |
– |
– |
$1,237,948 |
– |
$1,237,948 |
Non-Federal Funds |
– |
– |
– |
$309,487 |
– |
$309,487 |
Total Funds |
— |
— |
— |
$1,547,435 |
— |
$1,547,435 |
Proponent: |
Newton |
ID Number: |
S13183 |
Project Type: |
Community Connections |
Cost: |
$473,132 |
Funding Source: |
Regional Target Funds |
Category |
Conn |
Coord |
Plan |
TE |
CCM |
PM |
Total |
Score |
12 out of 18 |
7 out of 16 |
16 out of 18 |
9 out of 20 |
11 out of 18 |
9 out of 10 |
64 out of 100 |
This project will purchase and install 67 bicycle racks, two bicycle shelters, and 12 Rectangular Rapid Flashing Beacons (RRFBs) for locations across the City of Newton.
Source |
(FFY) 2026 |
2027 |
2028 |
2029 |
2030 |
Total |
Federal Funds |
$378,506 |
– |
– |
– |
– |
$378,506 |
Non-Federal Funds |
$94,626 |
– |
– |
– |
– |
$94,626 |
Total Funds |
$473,132 |
— |
— |
— |
— |
$473,132 |
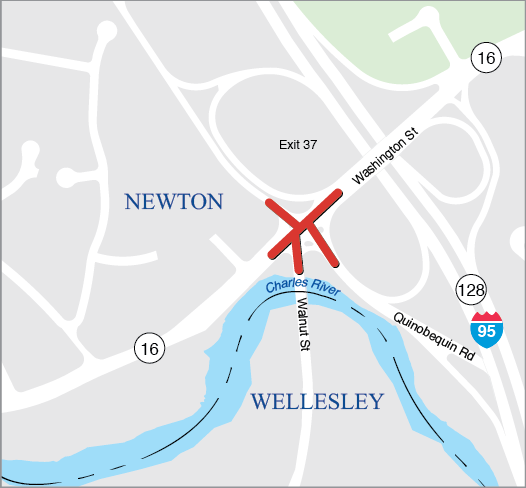
| Proponent: |
MassDOT |
|---|---|
ID Number: |
612613 |
Project Type: |
Intersection Improvements |
Cost: |
$4,872,000 |
Funding Source: |
Statewide Highway Funds |
This is a MassDOT-prioritized project and is therefore not directly evaluated using the MPO’s TIP scoring criteria.
Project will improve safety and pedestrian and bicycle access at the intersection of Route 16, Washington St, and Quinobequin Road.
| Source |
(FFY) 2026 |
2027 |
2028 |
2029 |
2030 |
Total |
|---|---|---|---|---|---|---|
Federal Funds |
– |
– |
– |
$3,897,600 |
– |
$3,897,600 |
Non-Federal Funds |
– |
– |
– |
$974,400 |
– |
$974,400 |
Total Funds |
— |
— |
— |
$4,872,000 |
— |
$4,872,000 |
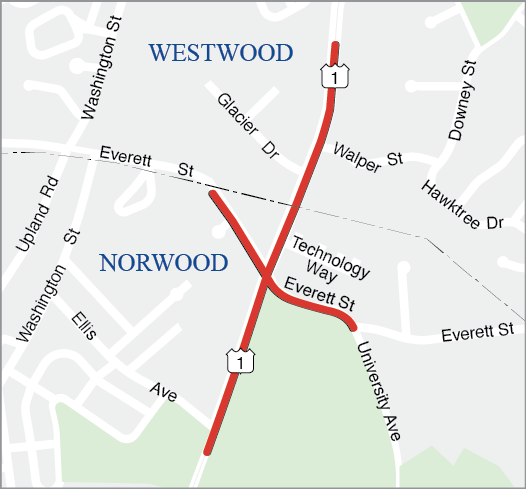
| Proponent: |
Norwood |
|---|---|
ID Number: |
605857 |
Project Type: |
Major Infrastructure |
Cost: |
$27,636,336 |
Funding Source: |
Regional Target Funds |
| Category |
Safety |
Sys Pres |
CM/M |
CA/SC |
TE |
EV |
Total |
|---|---|---|---|---|---|---|---|
Score |
11 out of 30 |
12 out of 29 |
15 out of 29 |
11 out of 16 |
2 out of 12 |
4 out of 18 |
55 out of 134 |
This project includes traffic signal upgrades and associated geometric improvements at the intersection of Route 1 with University Avenue and Everett Street. Related improvements include constructing an additional travel lane in each direction on Route 1, upgrading of traffic signals, lengthening of left-turn lanes on Route 1, upgrading of pedestrian crossings at each leg of the intersection, and upgrading of bicycle amenities (loop detectors) at the intersection. The project also includes the addition of a twin culvert underneath Route 1. Rehabilitation of sidewalks, curbing, median structures, lighting, and guard rails are also proposed.
| Source |
(FFY) 2026 |
2027 |
2028 |
2029 |
2030 |
Total |
|---|---|---|---|---|---|---|
Federal Funds |
– |
$22,109,069 |
– |
– |
– |
$22,109,069 |
Non-Federal Funds |
– |
$5,527,267 |
– |
– |
– |
$5,527,267 |
Total Funds |
— |
$27,636,336 |
— |
— |
— |
$27,636,336 |
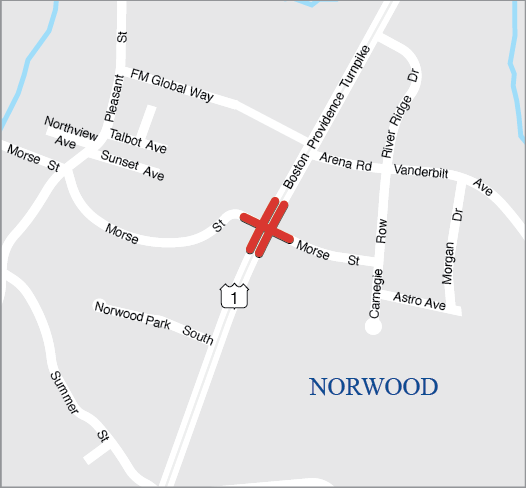
| Proponent: |
MassDOT |
|---|---|
ID Number: |
608052 |
Project Type: |
Intersection Improvements |
Cost: |
$14,087,774 |
Funding Source: |
Statewide Highway Funds |
This is a MassDOT-prioritized project and is therefore not directly evaluated using the MPO’s TIP scoring criteria.
Work will consist of improving the intersection and signals at US Route 1 (Providence Highway) and Morse Street.
| Source |
(FFY) 2026 |
2027 |
2028 |
2029 |
2030 |
Total |
|---|---|---|---|---|---|---|
Federal Funds |
– |
– |
– |
$11,270,219 |
– |
$11,270,219 |
Non-Federal Funds |
– |
– |
– |
$2,817,555 |
– |
$2,817,555 |
Total Funds |
— |
— |
— |
$14,087,774 |
— |
$14,087,774 |
| Proponent: |
Peabody |
|---|---|
ID Number: |
610544 |
Project Type: |
Bicycle and Pedestrian |
Cost: |
$19,127,610 |
Funding Source: |
Regional Target Funds |
| Category |
Safety |
MR |
AC |
RES |
TE |
CA/HC |
Total |
|---|---|---|---|---|---|---|---|
Score |
15 out of 30 |
14 out of 29 |
11 out of 29 |
4 out of 16 |
4 out of 12 |
6 out of 18 |
53 out of 134 |
The project includes construction of a new 12-foot-wide multi-use paved path along the abandoned railbed between two existing segments of the Independence Greenway in Peabody. The project also includes a connection to the existing Border to Boston trailhead at Lowell Street. The work includes full-depth pavement construction, minor drainage improvements, vegetative privacy screening, new and reset granite curb, new cement concrete sidewalk and hot mix asphalt, signal upgrades at the intersections of Lowell and Bourbon Streets and Route 1 northbound and Lowell Street, a new two-span steel pedestrian bridge, and various curb, walking, and parking improvements to the existing parking lot at 215 Newbury Street.
| Source |
(FFY) 2026 |
2027 |
2028 |
2029 |
2030 |
Total |
|---|---|---|---|---|---|---|
Federal Funds |
$11,172,879 |
– |
– |
– |
– |
$11,172,879 |
Non-Federal Funds |
$3,825,522 |
– |
– |
– |
– |
$3,825,522 |
Total Funds |
$19,127,610 |
— |
— |
— |
— |
$19,127,610 |
Proponent: |
Regionwide |
ID Number: |
S13145 |
Project Type: |
Administrative |
Cost: |
$11,000,000 |
Funding Source: |
Regional Target Funds |
This line item sets aside funding to be programmed for projects that will be scored separately using the relevant criteria for the project type.
This line item programs funding to be utilized in future TIPs for municipalities to conduct design work on projects. Municipalities will provide the 20% matching funding for the projects. Projects funded through this set-aside will be included in the TIP as separate line items.
Source |
(FFY) 2026 |
2027 |
2028 |
2029 |
2030 |
Total |
Federal Funds |
– |
$1,600,000 |
$2,400,000 |
$2,400,000 |
$2,400,000 |
$8,800,000 |
Non-Federal Funds |
– |
$400,000 |
$600,000 |
$600,000 |
$600,000 |
$2,200,000 |
Total Funds |
— |
$2,000,000 |
$3,000,000 |
$3,000,000 |
$3,000,000 |
$11,000,000 |
Proponent: |
MassDOT |
ID Number: |
608498 |
Project Type: |
Roadway Reconstruction |
Cost: |
$11,911,069 |
Funding Source: |
Statewide Highway Funds |
This is a MassDOT-prioritized project and is therefore not directly evaluated using the MPO’s TIP scoring criteria.
This project involves resurfacing on Route 53 from 500 feet northwest of the intersection with East Howard and West Howard Streets in Quincy to 100 feet northwest of the intersection with Linden Ponds Way in Weymouth.
Source |
(FFY) 2026 |
2027 |
2028 |
2029 |
2030 |
Total |
Federal Funds |
– |
– |
– |
– |
$9,528,855 |
$9,528,855 |
Non-Federal Funds |
– |
– |
– |
– |
$2,382,214 |
$2,382,214 |
Total Funds |
— |
— |
— |
— |
$11,911,069 |
$11,911,069 |
| Proponent: |
Quincy |
|---|---|
ID Number: |
610823 |
Project Type: |
Intersection Improvements |
Cost: |
$3,700,546 |
Funding Source: |
Regional Target Funds |
| Category |
Safety |
MR |
AC |
RES |
TE |
CA/HC |
Total |
|---|---|---|---|---|---|---|---|
Score |
16.5 out of 25 |
11 out of 18 |
4.5 out of 14 |
-1 out of 12 |
5.1 out of 12 |
5 out of 11 |
41.1 out of 100 |
This project will signalize the off-ramps for Interstate 93 at Willard Street and Ricciuti Drive to improve safety for all roadway users. The design of the project is currently at 75 percent. Construction of a small shared-use path connection is proposed on Willard Street to connect to future bicycle accommodations planned by the City of Quincy along Ricciuti Drive to provide connections to Quincy Quarries and multifamily residential developments. In addition to the shared-use path, the project will also upgrade all sidewalks to meet current ADA standards and improve the safety of pedestrian crossings.
| Source |
(FFY) 2026 |
2027 |
2028 |
2029 |
2030 |
Total |
|---|---|---|---|---|---|---|
Federal Funds |
– |
$2,960,437 |
– |
– |
– |
$2,960,437 |
Non-Federal Funds |
– |
$740,109 |
– |
– |
– |
$740,109 |
Total Funds |
— |
$3,700,546 |
— |
— |
— |
$3,700,546 |
| Proponent: |
MassDOT |
|---|---|
ID Number: |
609399 |
Project Type: |
Non-Interstate Pavement |
Cost: |
$6,231,315 |
Funding Source: |
Statewide Highway Funds |
This is a MassDOT-prioritized project and is therefore not directly evaluated using the MPO’s TIP scoring criteria.
This project will provide no significant expansion of bike/pedestrian facilities and is being advanced as a pavement preservation project. If needed, accessible pedestrian ramps should be provided at existing sidewalk infrastructure, existing sidewalks should be repaired if necessary, and cross-sectional distribution should be investigated through pavement marking changes for crosswalks/bicycle accommodations.
| Source |
(FFY) 2026 |
2027 |
2028 |
2029 |
2030 |
Total |
|---|---|---|---|---|---|---|
Federal Funds |
$4,985,052 |
– |
– |
– |
– |
$4,985,052 |
Non-Federal Funds |
$1,246,263 |
– |
– |
– |
– |
$1,246,263 |
Total Funds |
$6,321,315 |
— |
— |
— |
— |
$6,321,315 |
.png)
| Proponent: |
MassDOT |
|---|---|
ID Number: |
613564 |
Project Type: |
Safe Routes to School |
Cost: |
$2,486,024 |
Funding Source: |
Statewide Highway Funds |
This is a MassDOT-prioritized project and is therefore not directly evaluated using the MPO’s TIP scoring criteria.
The proposed project implements a road diet on Oakland Road by reducing the width of the existing travel lanes and creating space for a shared use path with hardscape buffer as well as intersection safety improvements at Hillside Road and Birch Meadow Drive, including but not limited to, new sidewalks, curbing, curb extensions, roadway resurfacing, signage, crosswalk improvements, and pavement markings.
| Source |
(FFY) 2026 |
2027 |
2028 |
2029 |
2030 |
Total |
|---|---|---|---|---|---|---|
Federal Funds |
– |
– |
$1,988,819 |
– |
– |
$1,988,819 |
Non-Federal Funds |
– |
– |
$497,205 |
– |
– |
$497,205 |
Total Funds |
— |
— |
$2,486,024 |
— |
— |
$2,486,024 |
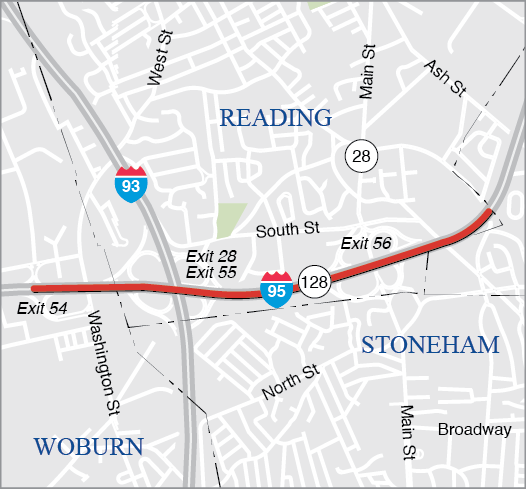
| Proponent: |
MassDOT |
|---|---|
ID Number: |
609527 |
Project Type: |
Freight |
Cost: |
$9,848,216 |
Funding Source: |
Statewide Highway Funds |
This is a MassDOT-prioritized project and is therefore not directly evaluated using the MPO’s TIP scoring criteria.
The project consists of adding a 5th lane on I-95 Northbound between the on-ramp from I 93 NB and the off-ramp to Route 28 NB, and a 4th lane between Route 28 and the (I-95) off-ramp to North Avenue, a total distance of approximately 1.85 miles.
| Source |
(FFY) 2026 |
2027 |
2028 |
2029 |
2030 |
Total |
|---|---|---|---|---|---|---|
Federal Funds |
– |
– |
– |
$7,878,573 |
– |
$7,878,573 |
Non-Federal Funds |
– |
– |
– |
$1,969,643 |
– |
$1,969,643 |
Total Funds |
— |
— |
— |
$9,848,216 |
— |
$9,848,216 |
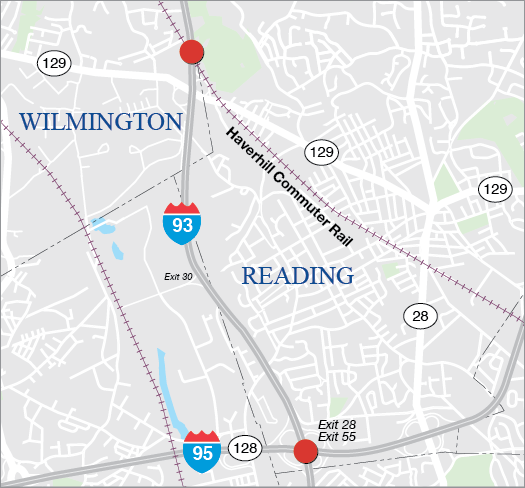
| Proponent: |
MassDOT |
|---|---|
ID Number: |
613276 |
Project Type: |
Bridge |
Cost: |
$18,601,526 |
Funding Source: |
Statewide Highway Funds |
This is a MassDOT-prioritized project and is therefore not directly evaluated using the MPO’s TIP scoring criteria.
This project will do preservation of the deck, superstructure, and substructure of the bridges carrying I-93 (NB/SB) over the MBTA railroad and I-95/Route 128.
| Source |
(FFY) 2026 |
2027 |
2028 |
2029 |
2030 |
Total |
|---|---|---|---|---|---|---|
Federal Funds |
$8,000,000 |
$6,881,221 |
– |
– |
– |
$14,881,221 |
Non-Federal Funds |
$2,000,000 |
$1,720,305 |
– |
– |
– |
$3,720,305 |
Total Funds |
$10,000,000 |
$8,601,526 |
— |
— |
— |
$18,601,526 |
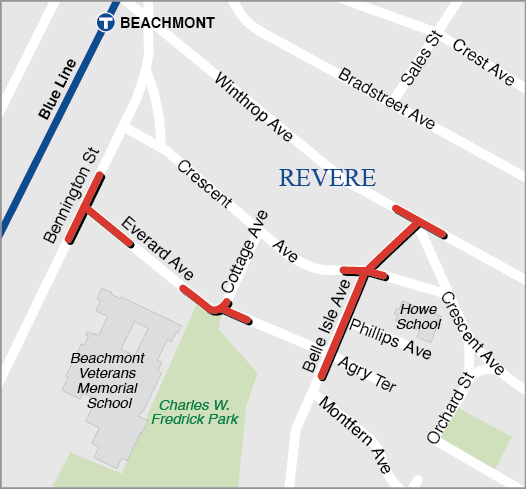
| Proponent: |
MassDOT |
|---|---|
ID Number: |
612100 |
Project Type: |
Safe Routes to School |
Cost: |
$801,656 |
Funding Source: |
Statewide Highway Funds |
This is a MassDOT-prioritized project and is therefore not directly evaluated using the MPO’s TIP scoring criteria.
This Safe Routes to School project proposes pedestrian improvements at several intersections surrounding Beachmont Veterans Elementary School in Revere. This project will reconstruct sections of sidewalk and curbing, improve markings at several crosswalks, and add tactile warning panels at some locations.
| Source |
(FFY) 2026 |
2027 |
2028 |
2029 |
2030 |
Total |
|---|---|---|---|---|---|---|
Federal Funds |
– |
$641,325 |
– |
– |
– |
$641,325 |
Non-Federal Funds |
– |
$160,331 |
– |
– |
– |
$160,331 |
Total Funds |
— |
$801,656 |
— |
— |
— |
$801,656 |
-01.png)
| Proponent: |
MassDOT |
|---|---|
ID Number: |
610543 |
Project Type: |
Roadway Reconstruction |
Cost: |
$9,430,400 |
Funding Source: |
Statewide Highway Funds |
This is a MassDOT-prioritized project and is therefore not directly evaluated using the MPO’s TIP scoring criteria.
The purpose of this project is to add-a-lane on Route 1 north bound between Copeland Circle and Salem Street offramp to improve the traffic operations and safety at this bottleneck.
| Source |
(FFY) 2026 |
2027 |
2028 |
2029 |
2030 |
Total |
|---|---|---|---|---|---|---|
Federal Funds |
– |
– |
– |
$7,544,320 |
– |
$7,544,320 |
Non-Federal Funds |
– |
– |
– |
$1,886,080 |
– |
$1,886,080 |
Total Funds |
— |
— |
— |
$9,430,400 |
— |
$9,430,400 |
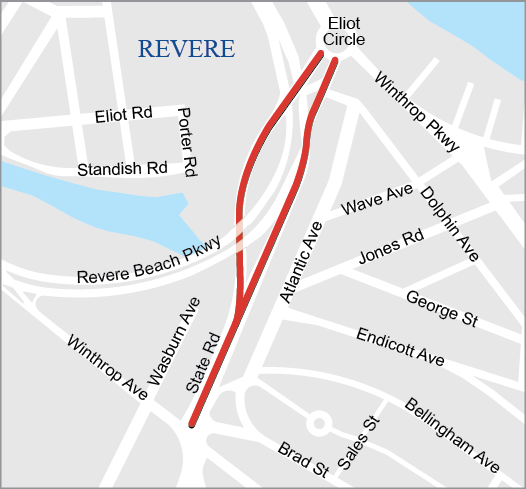
| Proponent: |
MassDOT |
|---|---|
ID Number: |
612523 |
Project Type: |
Bicycle and Pedestrian |
Cost: |
$7,957,331 |
Funding Source: |
Statewide Highway Funds |
This is a MassDOT-prioritized project and is therefore not directly evaluated using the MPO’s TIP scoring criteria.
The primary goal of this project is to provide a safe path for bicyclists and improve pedestrian and vehicular safety along State Road between Donnelly Square and Eliot Circle in Revere. The proposed scope will reduce both northbound and southbound travel on State Road from two lanes to a single lane to provide bicycle and pedestrian facilities, including a two-way, separated bicycle lane on the west side of the corridor and a one-way, parking-protected bicycle lane along the east side of the corridor. This project will improve the sidewalk along both sides of State Road, providing a direct connection for pedestrians to the Beachmont MBTA Blue Line station that is comfortable, safe, and accessible. Crosswalks with accessible ramps are proposed across all side streets and there is a proposed crossing of State Road just south of Ocean Avenue that will connect proposed facilities to the existing sidewalk on Revere Beach Parkway.
| Source |
(FFY) 2026 |
2027 |
2028 |
2029 |
2030 |
Total |
|---|---|---|---|---|---|---|
Federal Funds |
– |
$6,365,865 |
– |
– |
– |
$6,365,865 |
Non-Federal Funds |
– |
$1,591,466 |
– |
– |
– |
$1,591,466 |
Total Funds |
— |
$7,957,331 |
— |
— |
— |
$7,957,331 |

| Proponent: |
Salem |
|---|---|
ID Number: |
S13129 |
Project Type: |
Complete Streets |
Cost: |
$1,068,780 |
Funding Source: |
Regional Target Funds |
| Category |
Safety |
MR |
AC |
RES |
TE |
CA/HC |
Total |
|---|---|---|---|---|---|---|---|
Score |
12.5 out of 16 |
15 out of 19 |
13 out of 15 |
10 out of 14 |
6.2 out of 20 |
8 out of 16 |
68.1 out of 100 |
The proposed design for the project would right-size 2,065 linear feet of roadway to improve multimodal accommodations, including the addition of bicycle facilities where none currently exist. The intersections of Broad and Flint Streets and Broad and Jackson Streets will also be improved for better accessibility and safety for vulnerable users near Collins Middle School.
| Source |
(FFY) 2026 |
2027 |
2028 |
2029 |
2030 |
Total |
|---|---|---|---|---|---|---|
Federal Funds |
$855,024 |
– |
– |
– |
– |
$855,024 |
Non-Federal Funds |
$213,756 |
– |
– |
– |
– |
$213,756 |
Total Funds |
$1,068,780 |
— |
— |
— |
— |
$1,068,780 |
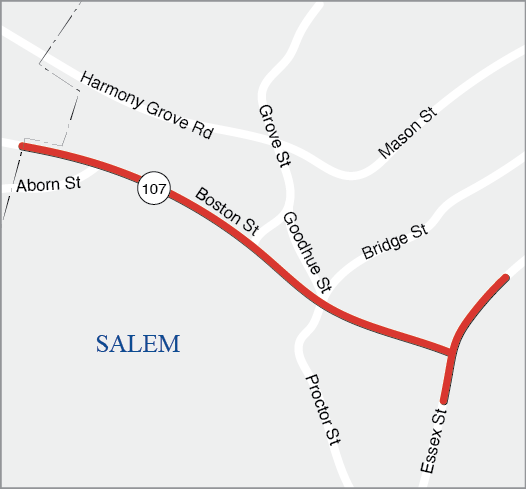
| Proponent: |
Salem |
|---|---|
ID Number: |
609437 |
Project Type: |
Complete Streets |
Cost: |
$25,155,213 |
Funding Source: |
Regional Target Funds |
| Category |
Safety |
Sys Pres |
CM/M |
CA/SC |
TE |
EV |
Total |
|---|---|---|---|---|---|---|---|
Score |
12 out of 18 |
15 out of 20 |
11 out of 18 |
8 out of 12 |
11 out of 20 |
11 out of 12 |
68 out of 100 |
This project aims to improve mobility for vehicles, bicycles, and pedestrians between Salem and Peabody and create separated bicycle facilities between the two municipalities. In addition to off-street bicycle facilities, major improvements to the corridor include incorporating Complete Streets design elements such as ADA/AAB-compliant sidewalks, pedestrian ramps, and crosswalks. This project will add a new traffic signal at the intersection of Boston Street and Aborn Street and will upgrade existing traffic signals at the intersections of Boston Street and Essex Street, Boston Street and Bridge Street/Proctor Street/Goodhue Street, and Boston Street and Grove Street/Nichols Street.
| Source |
(FFY) 2026 |
2027 |
2028 |
2029 |
2030 |
Total |
|---|---|---|---|---|---|---|
Federal Funds |
– |
$20,124,170 |
– |
– |
– |
$20,124,170 |
Non-Federal Funds |
– |
$5,031,043 |
– |
– |
– |
$5,031,043 |
Total Funds |
— |
$25,155,213 |
— |
— |
— |
$25,155,213 |
, FROM FLINT STREET TO 150 FEET WEST OF WASHINGTON STREET.png)
| Proponent: |
MassDOT |
|---|---|
ID Number: |
612990 |
Project Type: |
Roadway Reconstruction |
Cost: |
$11,667,590 |
Funding Source: |
Statewide Highway Funds |
This is a MassDOT-prioritized project and is therefore not directly evaluated using the MPO’s TIP scoring criteria.
The proposed project consists of a Complete Street design that is context-sensitive and compatible with local planning initiatives. A separated shared-use-path is proposed on the northerly side of Bridge Street and full pedestrian and bicycle accommodations along the southerly side, providing a valuable multimodal connection within the community, including to the MBTA garage.
| Source |
(FFY) 2026 |
2027 |
2028 |
2029 |
2030 |
Total |
|---|---|---|---|---|---|---|
Federal Funds |
– |
$9,334,072 |
– |
– |
– |
$9,334,072 |
Non-Federal Funds |
– |
$2,333,518 |
– |
– |
– |
$2,333,518 |
Total Funds |
— |
$11,667,590 |
— |
— |
— |
$11,667,590 |
.png)
| Proponent: |
MassDOT |
|---|---|
ID Number: |
612889 |
Project Type: |
Safe Routes to School |
Cost: |
$4,258,649 |
Funding Source: |
Statewide Highway Funds |
This is a MassDOT-prioritized project and is therefore not directly evaluated using the MPO’s TIP scoring criteria.
This project will make upgrades to promote safety along the roadways surrounding Cottage Street Elementary School in Sharon through the Safe Routes to School program. This project proposes to create continuous sidewalks along the entirety of Cottage Street, from Billings Street to Ames Street. Work will involve reconstructing all existing sidewalks and adding new sidewalks where none exist today. The project also proposes the addition of rectangular rapid-flashing beacons at five crosswalks along Cottage Street.
| Source |
(FFY) 2026 |
2027 |
2028 |
2029 |
2030 |
Total |
|---|---|---|---|---|---|---|
Federal Funds |
– |
– |
– |
$3,406,919 |
– |
$3,406,919 |
Non-Federal Funds |
– |
– |
– |
$851,730 |
– |
$851,730 |
Total Funds |
— |
— |
— |
$4,258,649 |
— |
$4,258,649 |
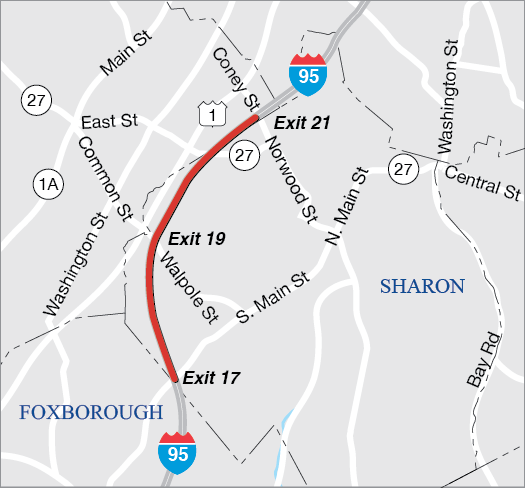
| Proponent: |
MassDOT |
|---|---|
ID Number: |
613356 |
Project Type: |
Interstate Pavement |
Cost: |
$16,228,800 |
Funding Source: |
Statewide Highway Funds |
This is a MassDOT-prioritized project and is therefore not directly evaluated using the MPO’s TIP scoring criteria.
This project involves resurfacing on I-95 in Sharon from the exit 17 on-ramp on I-95 North (the northern terminus of the project limits of project 613343) to about a quarter-mile southwest of the Coney Street overpass.
| Source |
(FFY) 2026 |
2027 |
2028 |
2029 |
2030 |
Total |
|---|---|---|---|---|---|---|
Federal Funds |
– |
– |
– |
$12,983,040 |
– |
$12,983,040 |
Non-Federal Funds |
– |
– |
– |
$3,245,760 |
– |
$3,245,760 |
Total Funds |
— |
— |
— |
$16,228,800 |
— |
$16,228,800 |
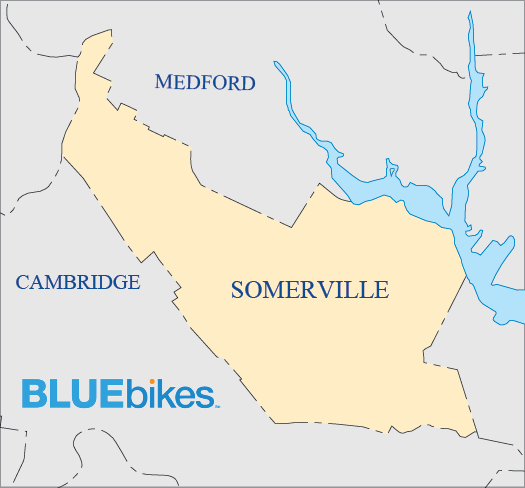
| Proponent: |
Somerville |
|---|---|
ID Number: |
S13181 |
Project Type: |
Community Connections |
Cost: |
$107,417 |
Funding Source: |
Regional Target Funds |
| Category |
Conn |
Coord |
Plan |
TE |
CCM |
PM |
Total |
|---|---|---|---|---|---|---|---|
Score |
11.5 out of 18 |
10 out of 16 |
14 out of 18 |
11 out of 16 |
15 out of 18 |
6 out of 10 |
67.5 out of 100 |
This project will replace five stations in Somerville, including stations in the neighborhoods of Magoun Square, Winter Hill, Spring Hill, Union Square, and Davis Square.
| Source |
(FFY) 2026 |
2027 |
2028 |
2029 |
2030 |
Total |
|---|---|---|---|---|---|---|
Federal Funds |
$85,934 |
– |
– |
– |
– |
$222,502 |
Non-Federal Funds |
$21,483 |
– |
– |
– |
– |
$55,625 |
Total Funds |
$107,417 |
— |
— |
— |
— |
$278,127 |
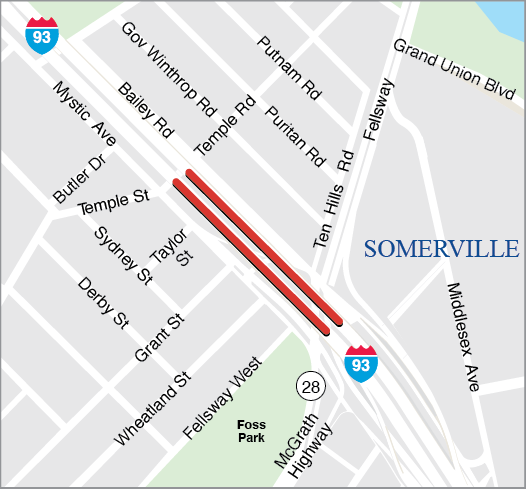
| Proponent: |
MassDOT |
|---|---|
ID Number: |
612496 |
Project Type: |
Bridge |
Cost: |
$217,509,197 |
Funding Source: |
Statewide Highway Funds |
This is a MassDOT-prioritized project and is therefore not directly evaluated using the MPO’s TIP scoring criteria.
This project will rehabilitate bridge S-17-031, which carries an elevated portion of Interstate 93 between Route 28 and Temple Street in Somerville. This is a continuation of a bridge preservation project on the same portion of Interstate 93 (Project #606528), which began construction in late 2021.
| Source |
(FFY) 2026 |
2027 |
2028 |
2029 |
2030 |
Total |
|---|---|---|---|---|---|---|
Federal Funds |
– |
$16,000,000 |
$56,000,000 |
$56,000,000 |
$46,007,358 |
$174,007,358 |
Non-Federal Funds |
– |
$4,000,000 |
$14,000,000 |
$14,000,000 |
$11,501,839 |
$43,501,839 |
Total Funds |
— |
$20,000,000 |
$70,000,000 |
$70,000,000 |
$57,509,197 |
$217,509,197 |

| Proponent: |
MassDOT |
|---|---|
ID Number: |
612634 |
Project Type: |
Bridge |
Cost: |
$93,854,208 |
Funding Source: |
Statewide Highway Funds |
This is a MassDOT-prioritized project and is therefore not directly evaluated using the MPO’s TIP scoring criteria.
This project is to replace the Squire's Bridge carrying McGrath Hwy (Route 28) over Somerville Ave Extension & MBTA in Somerville, MA. The bridge will be replaced with a functional equivalent that also incorporates multi-modal accommodations. The project includes approach work along McGrath Hwy on either side of the bridge, including vaults, median barrier, curb, sidewalk, lighting, guardrail, curb ramps, stairways and/or pedestrian ramps, and other related work.
| Source |
(FFY) 2026 |
2027 |
2028 |
2029 |
2030 |
Total |
|---|---|---|---|---|---|---|
Federal Funds |
– |
– |
– |
$39,326,694 |
$35,756,672 |
$75,083,366 |
Non-Federal Funds |
– |
– |
– |
$9,831,674 |
$8,939,168 |
$18,770,842 |
Total Funds |
— |
— |
— |
$49,158,368 |
$44,695,840 |
$93,854,208 |
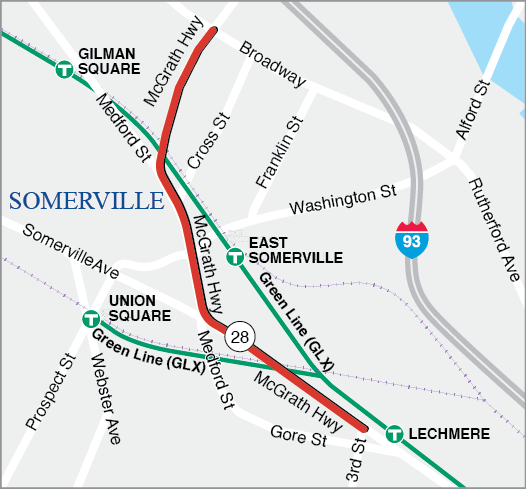
| Proponent: |
MassDOT |
|---|---|
ID Number: |
607981 |
Project Type: |
Major Infrastructure |
Cost: |
$128,385,573 |
Funding Source: |
Regional Target Funds |
| Category |
Safety |
Sys Pres |
CM/M |
CA/SC |
TE |
EV |
Total |
|---|---|---|---|---|---|---|---|
Score |
13 out of 18 |
19 out of 20 |
13 out of 18 |
8 out of 12 |
9.2 out of 20 |
10 out of 12 |
72.2 out of 100 |
This project will remove the existing McCarthy Viaduct along McGrath Boulevard in Somerville and replace it with an at-grade urban boulevard, approximately 1.5 miles long, from Broadway in the north to Third Street in the south. The project will result in more conventional intersection configurations at Washington Street and Somerville Avenue, which are currently under or next to the viaduct. Removing the viaduct will physically reconnect the neighborhoods of Somerville with more direct vehicle, pedestrian, bicycle, and transit networks. The project will enhance transit access along the corridor, improving bus operations and the bus rider experience with the installation of floating/in-lane bus stops, transit signal priority, and bus queue-jump lanes at key intersections. New sidewalks and bicycle facilities will be provided for the length of the proposed McGrath Boulevard and will connect with the extended Somerville Community Path, creating access to the regional bicycle network. The proposed facilities will provide direct intermodal connections to existing bus routes and the new Green Line station in East Somerville. This project is anticipated to be funded over four fiscal years, with the first year of funding in FFY 2027.
| Source |
(FFY) 2026 |
2027 |
2028 |
2029 |
2030 |
Total |
|---|---|---|---|---|---|---|
Federal Funds |
– |
$24,000,000 |
$26,460,568 |
$24,248,000 |
$28,000,000 |
$102,708,458 |
Non-Federal Funds |
– |
$6,000,000 |
$6,615,115 |
$6,062,000 |
$7,000,000 |
$25,677,115 |
Total Funds |
— |
$30,000,000 |
$33,075,753 |
$30,310,000 |
$35,000,000 |
$128,385,573 |
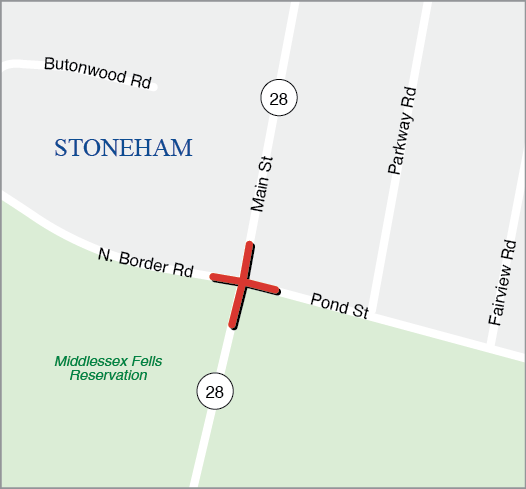
| Proponent: |
MassDOT |
|---|---|
ID Number: |
610665 |
Project Type: |
Intersection Improvements |
Cost: |
$6,618,858 |
Funding Source: |
Statewide Highway Funds |
This is a MassDOT-prioritized project and is therefore not directly evaluated using the MPO’s TIP scoring criteria.
The project will include intersection improvements that will increase operational efficiency while enhancing safety and reducing crashes at the intersection of Route 28 (Main Street), North Border Road, and Pond Street in Stoneham.
| Source |
(FFY) 2026 |
2027 |
2028 |
2029 |
2030 |
Total |
|---|---|---|---|---|---|---|
Federal Funds |
– |
– |
$5,295,086 |
– |
– |
$5,295,086 |
Non-Federal Funds |
– |
– |
$1,323,772 |
– |
– |
$1,323,772 |
Total Funds |
— |
— |
$6,618,858 |
— |
— |
$6,618,858 |
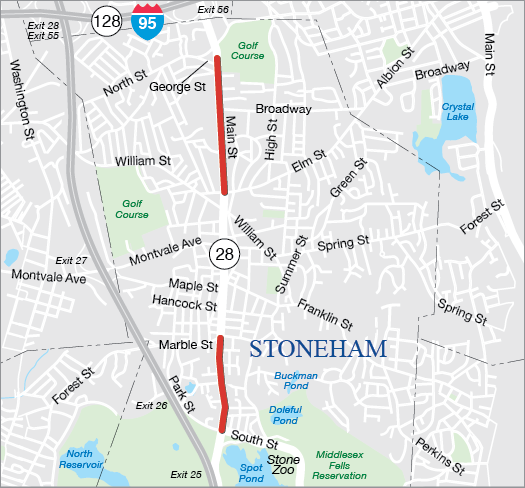
| Proponent: |
MassDOT |
|---|---|
ID Number: |
612026 |
Project Type: |
Non-Interstate Pavement |
Cost: |
$1,896,496 |
Funding Source: |
Statewide Highway Funds |
This is a MassDOT-prioritized project and is therefore not directly evaluated using the MPO’s TIP scoring criteria.
This project involves resurfacing on two sections of Route 28 in Stoneham: from North Border Road/South Street to Marble Street and from Elm Street to about 50 feet north of George Street.
| Source |
(FFY) 2026 |
2027 |
2028 |
2029 |
2030 |
Total |
|---|---|---|---|---|---|---|
Federal Funds |
– |
– |
– |
$1,517,197 |
– |
$1,517,197 |
Non-Federal Funds |
– |
– |
– |
$379,299 |
– |
$379,299 |
Total Funds |
— |
— |
— |
$1,896,496 |
— |
$1,896,496 |
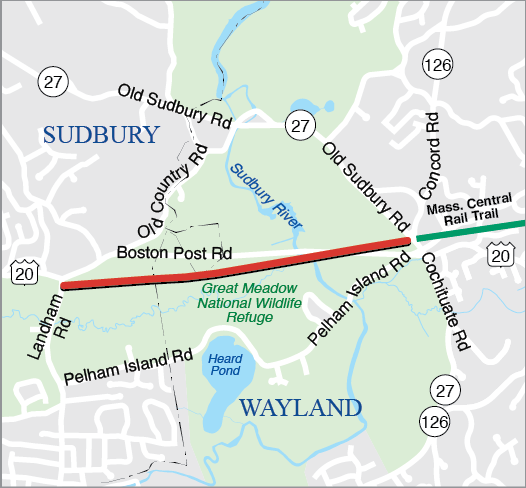
| Proponent: |
MassDOT |
|---|---|
ID Number: |
610660 |
Project Type: |
Bicycle and Pedestrian |
Cost: |
$6,583,786 |
Funding Source: |
Statewide Highway Funds |
This is a MassDOT-prioritized project and is therefore not directly evaluated using the MPO’s TIP scoring criteria.
This project will extend the Mass Central Rail Trail from its existing terminus at Andrew Road in Wayland to Landham Road in Sudbury, a distance of approximately 1.6 miles.
| Source |
(FFY) 2026 |
2027 |
2028 |
2029 |
2030 |
Total |
|---|---|---|---|---|---|---|
Federal Funds |
– |
– |
$3,133,090 |
– |
– |
$3,133,090 |
Non-Federal Funds |
– |
– |
$783,273 |
– |
– |
$783,273 |
Total Funds |
— |
— |
$3,916,363 |
— |
— |
$3,916,363 |
Proponent: |
MassDOT |
ID Number: |
613319 |
Project Type: |
Bicycle and Pedestrian |
Cost: |
$8,628,506 |
Funding Source: |
Regional Target Funds |
Category |
Safety |
MR |
AC |
RES |
TE |
CA/HC |
Total |
Score |
12 out of 16 |
8.5 out of 15 |
10.5 out of 17 |
7 out of 16 |
3.5 out of 20 |
9 out of 16 |
50.5 out of 100 |
Phase 3 of the Bruce Freeman Rail Trail (BFRT) spans approximately 1.3 miles from Eaton Road W in Framingham to the Sudbury Diamond Railroad Crossing. The proposed trail will be a 10-foot, paved shared-use path along the former railroad corridor with two-foot-dense graded crushed stone shoulders. Sidewalks and pedestrian curb ramps at the at-grade intersection of the trail and Route 20 are proposed to be updated to create an ADA compliant and accessible crossing at the existing signalized intersection of Nobscot Road/Route 20. A parking lot is also being proposed along Nobscot Road, approximately 550 feet south of Route 20. Other work includes fixing or replacing culverts and stream crossings where necessary and implementing safety fencing along the trail where necessary. This project is funded across two federal fiscal years starting in FFY 2029.
Source |
(FFY) 2026 |
2027 |
2028 |
2029 |
2030 |
Total |
Federal Funds |
– |
– |
– |
$6,902,805 |
– |
$6,902,805 |
Non-Federal Funds |
– |
– |
– |
$1,725,701 |
– |
$1,725,701 |
Total Funds |
— |
— |
— |
$8,628,506 |
— |
$8,628,506 |
| Proponent: |
Swampscott |
|---|---|
ID Number: |
610666 |
Project Type: |
Bicycle and Pedestrian |
Cost: |
$8,624,000 |
Funding Source: |
Regional Target Funds |
| Category |
Safety |
Sys Pres |
CM/M |
CA/SC |
TE |
EV |
Total |
|---|---|---|---|---|---|---|---|
Score |
13 out of 20 |
5 out of 14 |
18 out of 18 |
12 out of 14 |
7.4 out of 20 |
11 out of 14 |
66.4 out of 100 |
This project will construct a new 2.1-mile-long multi-use linear park running the length of Swampscott and connecting with the existing Marblehead Rail Trail and the larger East Coast Greenway. This project will provide safe, accessible connections to the Town’s schools, recreation areas, MBTA commuter rail station, and natural resources for people walking and bicycling. The project will feature a 10-foot-wide trail with a two-foot sloping shoulder on each side. The trail will cross Paradise Road (Route 1A) with a pedestrian bridge using the existing railroad abutments from the former rail line. Trail amenities will be located at the Swampscott Middle School, including bathrooms, vehicle parking for trail users, bicycle parking, and a public bike repair station.
| Source |
(FFY) 2026 |
2027 |
2028 |
2029 |
2030 |
Total |
|---|---|---|---|---|---|---|
Federal Funds |
– |
– |
– |
$6,899,200 |
– |
$6,899,200 |
Non-Federal Funds |
– |
– |
– |
$1,724,800 |
– |
$1,724,800 |
Total Funds |
— |
— |
— |
$8,624,000 |
— |
$8,624,000 |
| Proponent: |
MassDOT |
|---|---|
ID Number: |
612076 |
Project Type: |
Bridge |
Cost: |
$5,896,563 |
Funding Source: |
Statewide Highway Funds |
This is a MassDOT-prioritized project and is therefore not directly evaluated using the MPO’s TIP scoring criteria.
This project will replace T-06-013, which carries Perkins Row over Mile Brook in Topsfield.
| Source |
(FFY) 2026 |
2027 |
2028 |
2029 |
2030 |
Total |
|---|---|---|---|---|---|---|
Federal Funds |
– |
$4,717,250 |
– |
– |
– |
$4,717,250 |
Non-Federal Funds |
– |
$1,179,313 |
– |
– |
– |
$1,179,313 |
Total Funds |
— |
$5,896,563 |
— |
— |
— |
$5,896,563 |
![]()
| Proponent: |
Regionwide |
|---|---|
ID Number: |
S12113 |
Project Type: |
Community Connections |
Cost: |
$19,500,000 |
Funding Source: |
Regional Target Funds |
The scoring criteria for the Transit Transformation Program are listed in Appendix A. Scores for projects funded in the FFYs 2026-30 TIP through this program are available on those projects’ pages within this chapter.
The MPO’s Transit Transformation Program was established in Destination 2050, the MPO’s current Long-Range Transportation Plan. This program will allocate a portion of the MPO’s Regional Target Highway funds to transit projects that advance the MPO’s goals in the region, including upgrades to stations and facilities and the purchase of vehicles for transit providers. Specific projects will be funded using these reserved funds in future TIP cycles.
| Source |
(FFY) 2026 |
2027 |
2028 |
2029 |
2030 |
Total |
|---|---|---|---|---|---|---|
Federal Funds |
– |
– |
$4,800,000 |
$5,200,000 |
$5,600,000 |
$15,600,000 |
Non-Federal Funds |
– |
– |
$1,200,000 |
$1,300,000 |
$1,400,000 |
$3,900,000 |
Total Funds |
— |
— |
$6,000,000 |
$6,500,000 |
$7,000,000 |
$19,500,000 |
Proponent: |
Wakefield |
ID Number: |
610545 |
Project Type: |
Complete Streets |
Cost: |
$28,492,560 |
Funding Source: |
Regional Target Funds |
Category |
Safety |
Sys Pres |
CM/M |
CA/SC |
TE |
EV |
Total |
Score |
12 out of 18 |
14.5 out of 20 |
9 out of 18 |
6 out of 12 |
8.8 out of 20 |
11 out of 12 |
61.8 out of 100 |
This Complete Streets project redesigns Route 129 (Main Street) in downtown Wakefield to integrate comprehensive multimodal facilities through the addition of shared-use-paths, median refuges, curb bump outs, and other geometric improvements. The project improves safety for all users with upgrades to lighting and turn radii, including for emergency response vehicles. This project may be coordinated for additional improvements to the Wakefield-Lynnfield Rail Trail Extension in MassDOT's Statewide Highway program.
Source |
(FFY) 2026 |
2027 |
2028 |
2029 |
2030 |
Total |
Federal Funds |
– |
– |
$22,794,048 |
– |
– |
$22,794,048 |
Non-Federal Funds |
– |
– |
$5,698,512 |
– |
– |
$5,698,512 |
Total Funds |
— |
— |
$28,492,560 |
– |
– |
$28,492,560 |
Proponent: |
MassDOT |
ID Number: |
S13230 |
Project Type: |
Bicycle and Pedestrian |
Cost: |
$14,732,000 |
Funding Source: |
Statewide Highway Funds |
This is a MassDOT-prioritized project and is therefore not directly evaluated using the MPO’s TIP scoring criteria.
This project will construct the northern section of the Wakefield Rail Trail, which will eventually connect to the Lynnfield Rail Trail.
Source |
(FFY) 2026 |
2027 |
2028 |
2029 |
2030 |
Total |
Federal Funds |
– |
– |
– |
– |
$11,785,600 |
$11,785,600 |
Non-Federal Funds |
– |
– |
– |
– |
$2,946,400 |
$2,946,400 |
Total Funds |
— |
— |
— |
— |
$14,732,000 |
$14,732,000 |
Proponent: |
MassDOT |
ID Number: |
613154 |
Project Type: |
Roadway Reconstruction |
Cost: |
$11,252,815 |
Funding Source: |
Statewide Highway Funds |
This is a MassDOT-prioritized project and is therefore not directly evaluated using the MPO’s TIP scoring criteria.
The project aims to replace an existing 42" reinforced concrete culvert under Route 9 and assess alternatives on the culvert replacement within Cochituate Aqueduct. Additionally, the project will assess drainage improvements. The culvert under Route 9 that spans over Boulder Brook in Cochituate Aqueduct is owned by the Town of Wellesley. MassDOT has jurisdiction on Route 9 along with the culvert under Route 9.
Source |
(FFY) 2026 |
2027 |
2028 |
2029 |
2030 |
Total |
Federal Funds |
– |
– |
$9,002,252 |
– |
– |
$9,002,252 |
Non-Federal Funds |
– |
– |
$2,250,563 |
– |
– |
$2,250,563 |
Total Funds |
— |
— |
$11,252,815 |
— |
– |
$11,252,815 |
| Proponent: |
Wenham |
|---|---|
ID Number: |
609388 |
Project Type: |
Intersection Improvements |
Cost: |
$4,941,812 |
Funding Source: |
Statewide Highway Funds |
| Category |
Safety |
MR |
AC |
RES |
TE |
CA/HC |
Total |
|---|---|---|---|---|---|---|---|
Score |
17 out of 25 |
9 out of 18 |
7.5 out of 14 |
-4 out of 12 |
2.4 out of 20 |
2.5 out of 11 |
34.4 out of 100 |
The project will include a redesign of the existing roadway by installing signage designated turning lanes at key locations and two fully signalized intersections This project will also include improvements to the existing sidewalks, the installation of new sidewalks and the redesign and relocation of existing pedestrian crosswalks.
Source |
(FFY) 2026 |
2027 |
2028 |
2029 |
2030 |
Total |
Federal Funds |
$3,953,450 |
– |
– |
– |
– |
$183,151 |
Non-Federal Funds |
$988,362 |
– |
– |
– |
– |
$45,788 |
Total Funds |
$4,941,812 |
— |
— |
— |
— |
$4,941,812 |
| Proponent: |
Weston |
|---|---|
ID Number: |
608940 |
Project Type: |
Intersection Improvements |
Cost: |
$3,966,586 |
Funding Source: |
Regional Target Funds |
| Category |
Safety |
Sys Pres |
CM/M |
CA/SC |
TE |
EV |
Total |
|---|---|---|---|---|---|---|---|
Score |
13 out of 20 |
5 out of 14 |
18 out of 18 |
12 out of 14 |
7.4 out of 20 |
11 out of 14 |
66.4 out of 100 |
This project aims to address the safety concerns and crash incidents that contribute to the intersection’s inclusion on the state’s HSIP eligibility list as a high-crash location while also seeking to alleviate traffic congestion in the area. The project scope includes the installation of a new traffic signal system, reconfiguring the intersection to address documented safety issues, consolidating pavement area, and the simplification of turning movements. Proposed pedestrian improvements include replacement of sidewalks along the north side of Route 20 and the east side of Boston Post Road. New sidewalk is proposed on the south side of Route 20, the west side of Boston Post Road, and on both sides of Wellesley Street within the immediate intersection limits. The proposed traffic signal system includes protected pedestrian crossings and crosswalks are proposed on all approaches to the intersection. The project also includes the addition of bicycle lanes and improvements to a school bus stop on adjacent Windsor Way.
Source |
(FFY) 2026 |
2027 |
2028 |
2029 |
2030 |
Total |
Federal Funds |
$3,173,269 |
– |
– |
– |
– |
$3,173,269 |
Non-Federal Funds |
$793,317 |
– |
– |
– |
– |
$793,317 |
Total Funds |
$3,966,586 |
— |
— |
— |
— |
$3,966,586 |
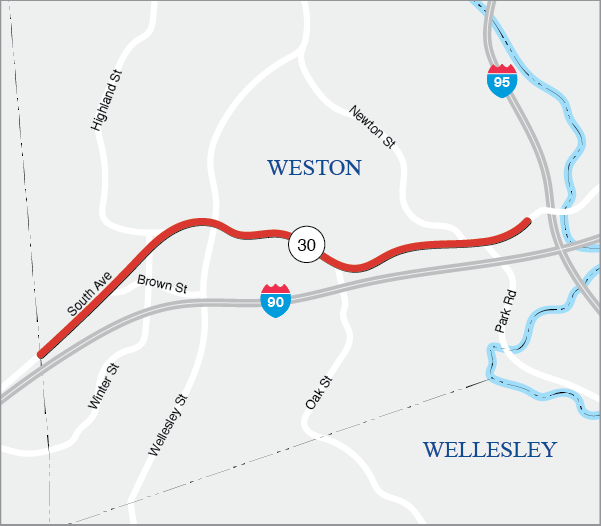
| Proponent: |
Weston |
|---|---|
ID Number: |
608954 |
Project Type: |
Complete Streets |
Cost: |
$19,999,712 |
Funding Source: |
Regional Target Funds |
| Category |
Safety |
Sys Pres |
CM/M |
CA/SC |
TE |
EV |
Total |
|---|---|---|---|---|---|---|---|
Score |
11 out of 18 |
10 out of 10 |
0 out of 18 |
9 out of 12 |
6.2 out of 20 |
3 out of 12 |
49.2 out of 100 |
This project will improve pavement and roadway conditions along a 3.7-mile segment of Route 30 and make geometric and safety improvements at intersections along the corridor. A key goal of the project is to create a corridor that better serves all users, especially those who are walking and bicycling. To that end, this project will construct a 10-foot off-road shared-use path along the full length of the project. The path will run along the south side of the roadway from the Natick town line to the intersection at Newton Street, crossing to the north side at Newton Street to continue to the end of the project limits. This path will connect with other proposed bicycle and pedestrian accommodations in the area, including on the Route 30 bridge over the Charles River (Project# 110980, funded by the MPO in FFY 2024) and on Route 30 in Newton (Project# 610674, funded by MassDOT in FFY 2023).
Source |
(FFY) 2026 |
2027 |
2028 |
2029 |
2030 |
Total |
Federal Funds |
– |
– |
$15,999,770 |
– |
– |
$15,999,770 |
Non-Federal Funds |
– |
– |
$3,999,942 |
– |
– |
$3,999,942 |
Total Funds |
— |
— |
$19,999,712 |
— |
— |
$19,999,712 |
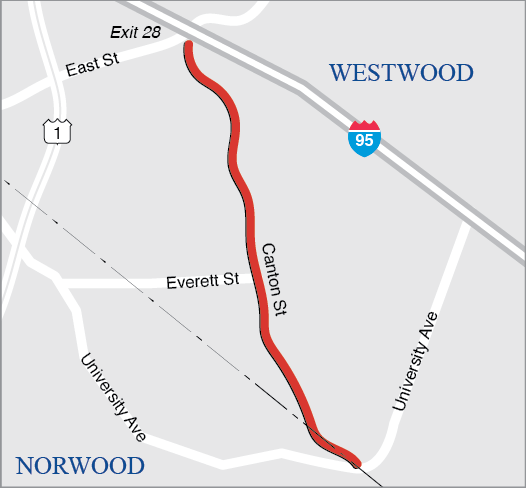
Proponent: |
Westwood |
ID Number: |
608158 |
Project Type: |
Complete Streets |
Cost: |
$22,038,602 |
Funding Source: |
Regional Target Funds |
Category |
Safety |
Sys Pres |
CM/M |
CA/SC |
TE |
EV |
Total |
Score |
12 out of 18 |
14.5 out of 20 |
9 out of 18 |
3.75 out of 16 |
5 out of 20 |
9 out of 12 |
53.3 out of 100 |
This project will reconstruct Canton Street and install pedestrian and bicycle facilities where none currently exist. A sidewalk will be constructed along the southbound side of the roadway and a shared-use path along along the northbound side. The project will improve visibility at five curves along the corridor to improve stopping sight distances, and it includes the addition of apron turn lanes and medians for improved navigation. High visibility crosswalks and beacons will be added at seven locations.
Source |
(FFY) 2026 |
2027 |
2028 |
2029 |
2030 |
Total |
Federal Funds |
– |
– |
$9,630,882 |
$8,000,000 |
– |
$17,630,881 |
Non-Federal Funds |
– |
– |
$2,407,720 |
$2,000,000 |
– |
$4,407,721 |
Total Funds |
— |
— |
$12,038,602 |
$10,000,000 |
– |
$22,038,602 |
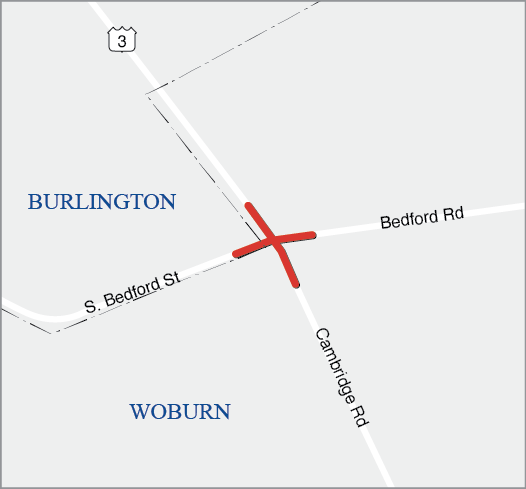
| Proponent: |
MassDOT |
|---|---|
ID Number: |
608067 |
Project Type: |
Intersection Improvements |
Cost: |
$4,883,750 |
Funding Source: |
Regional Target Funds |
| Category |
Safety |
Sys Pres |
CM/M |
CA/SC |
TE |
EV |
Total |
|---|---|---|---|---|---|---|---|
Score |
9 out of 30 |
11 out of 29 |
19 out of 29 |
7 out of 16 |
2 out of 12 |
4 out of 18 |
52 out of 134 |
The intersection of U.S. Route 3 (Cambridge Street) at South Bedford Street and Bedford Road has been identified as a high-crash location in the Boston region. The existing geometry and traffic operations can often present challenges for motorists, pedestrians, and bicyclists. This project will reconstruct the intersection and all traffic signal equipment. Geometry enhancements will be made to accommodate exclusive turn lanes for all approaches to the intersection. The project will include reconstruction of the sidewalk along the east side of Cambridge Street and both sides of the Bedford Road westbound approach, and new sidewalk will be constructed on the south side of South Bedford Street. Bicycle accommodations consisting of five-foot wide bicycle lanes (with two-foot wide buffers where feasible) will be provided, as will ADA-compliant MBTA bus stops on Cambridge Street.
Source |
(FFY) 2026 |
2027 |
2028 |
2029 |
2030 |
Total |
Federal Funds |
$3,907,000 |
– |
– |
– |
– |
$3,907,000 |
Non-Federal Funds |
$976,750 |
– |
– |
– |
– |
$976,750 |
Total Funds |
$4,883,750 |
— |
— |
— |
— |
$4,883,750 |
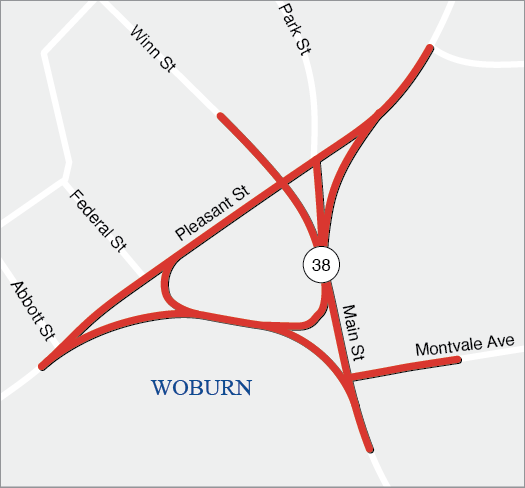
| Proponent: |
Woburn |
|---|---|
ID Number: |
610662 |
Project Type: |
Complete Streets |
Cost: |
$18,026,400 |
Funding Source: |
Regional Target Funds |
| Category |
Safety |
Sys Pres |
CM/M |
CA/SC |
TE |
EV |
Total |
|---|---|---|---|---|---|---|---|
Score |
22 out of 30 |
15 out of 29 |
16 out of 29 |
10 out of 16 |
4 out of 12 |
8 out of 18 |
75 out of 134 |
This project will improve safety and congestion within the Woburn Common area by making safety and operational improvements on Pleasant Street, reconfiguring the Woburn Common rotary, and reconstructing and realigning roadways. The project will also reconstruct sidewalks, add bike lanes, and upgrade or add signals in the area.
Source |
(FFY) 2026 |
2027 |
2028 |
2029 |
2030 |
Total |
Federal Funds |
– |
– |
– |
$7,468,160 |
$6,952,960 |
$14,421,120 |
Non-Federal Funds |
– |
– |
– |
$1,867,040 |
$1,738,240 |
$3,605,280 |
Total Funds |
— |
— |
— |
$9,335,200 |
$8,691,200 |
$18,026,400 |
Proponent: |
MassDOT |
ID Number: |
610676 |
Project Type: |
Intersection Improvements |
Cost: |
$6,712,937 |
Funding Source: |
Statewide Highway Funds |
This is a MassDOT-prioritized project and is therefore not directly evaluated using the MPO’s TIP scoring criteria.
The project will construct improvements at the intersection of Route 1A at North and Winter Street. Improvements will include providing adequate signage and pavement markings.
Source |
(FFY) 2026 |
2027 |
2028 |
2029 |
2030 |
Total |
Federal Funds |
– |
– |
$5,370,350 |
– |
– |
$5,370,350 |
Non-Federal Funds |
– |
– |
$1,342,587 |
– |
– |
$1,342,587 |
Total Funds |
— |
— |
$6,712,937 |
— |
– |
$6,712,937 |
Performance-based planning and programming (PBPP) applies data and performance management principles to inform transportation decision-making. The purpose of PBPP is to ensure that transportation investment decisions are oriented toward meeting established goals. PBPP activities include the following:
● Setting goals and objectives for the transportation system
● Selecting performance measures and setting performance targets
● Gathering data and information to monitor and analyze trends
● Using performance measures and data to make investment decisions
● Monitoring, analyzing, and reporting performance outcomes
The Boston Region Metropolitan Planning Organization’s (MPO) PBPP process is shaped by both federal transportation performance management requirements and the MPO’s goals and objectives, which are established as part of the MPO’s Long-Range Transportation Plan (LRTP). This chapter discusses how these two frameworks shape the MPO’s PBPP process and describes the MPO’s current set of performance measures and targets. It also explains how the MPO anticipates the projects funded in the Federal Fiscal Years (FFYs) 2026–30 Transportation Improvement Program (TIP) will support improvements in various performance areas and make progress toward performance targets.
PBPP requirements originated with the enactment of the Moving Ahead for Progress in the 21st Century Act (MAP-21) in 2012. MAP-21 directed states, MPOs, and public transportation providers to carry out a performance and outcome-based surface transportation program. (MAP-21 identified seven national goals for the nation’s highway system, which are described in Appendix E.) Table 4-1 shows the relationship between these national goal areas and the MPO’s goal areas. The MPO’s goals and related objectives, which help shape the MPO’s PBPP process, are listed in Chapter 1 and Figure 1-3.
Table 4-1
National and Boston Region MPO Goal Areas
National Goal Area |
Boston Region MPO Goal Areas |
Safety |
Safety |
Infrastructure Condition |
Mobility and Reliability |
System Reliability |
Access and Connectivity, Mobility and Reliability |
Congestion Reduction |
Clean Air and Healthy Communities, Mobility and Reliability |
Environmental Sustainability |
Clean Air and Healthy Communities, Resiliency |
Freight Movement/Economic Vitality |
Access and Connectivity, Clean Air and Healthy Communities |
Reduced Project Delivery Delays |
Not Applicable |
Sources: Boston Region MPO staff and Federal Highway Administration.
The US Department of Transportation (USDOT) has established performance measures in areas relevant to the national goals. Table 4-2 lists these measures for the transit system. Table 4-3 lists measures for the roadway system.
Table 4-2
Federally Required Transit Performance Measures
National Goal Area |
Transit Performance Area or Asset Category |
Performance Measures |
Relevant MPO Goal Area |
Safety |
Fatalities |
|
Safety |
Safety |
Injuries |
|
Safety |
Safety |
Safety Events |
|
Safety |
Safety |
System Reliability |
Mean distance between major mechanical failures |
Safety |
Safety |
Transit Workers |
|
|
Infrastructure Condition |
Equipment |
Percent of vehicles that have met or exceeded their ULB |
Mobility and Reliability |
Infrastructure Condition |
Rolling Stock |
Percent of revenue vehicles within a particular asset class that have met or exceeded their ULB |
Mobility and Reliability |
Infrastructure Condition |
Infrastructure |
Percent of track segments with performance restrictions |
Accessibility and Connectivity, Mobility and Reliability |
Infrastructure Condition |
Facilities |
Percent of facilities within an asset class rated below 3.0 on the FTA Transit Economic Requirements Model scale |
Mobility and Reliability |
FTA = Federal Transit Administration. MPO = metropolitan planning organization. ULB = useful life benchmark. VRM = vehicle-revenue miles.
Sources: National Public Transportation Safety Plan (January 2017), the Public Transportation Agency Safety Plan Rule (49 CFR Part 673), and the Transit Asset Management Rule (49 CFR Part 625).
Table 4-3
Federally Required Roadway Performance Measures
| National Goal Area |
Roadway |
Performance Measures |
Relevant MPO Goal Area |
|---|---|---|---|
Safety |
Injuries and Fatalities |
• Number of fatalities |
Safety |
Infrastructure Condition |
Pavement Condition |
• Percent of pavements on the Interstate System in good condition |
Mobility and Reliability |
Infrastructure Condition |
Bridge Condition |
• Percent of NHS bridges by deck area classified as in good condition |
Mobility and Reliability |
System Reliability |
Performance of the National Highway System |
• Percent of the person-miles traveled on the Interstate System that are reliable |
Access and Connectivity, Mobility and Reliability |
System Reliability, Freight Movement and Economic Vitality |
Freight Movement on the Interstate System |
• Truck Travel Time Reliability Index (for truck travel on Interstate highways) |
Access and Connectivity, Mobility and Reliability |
Congestion Reduction |
Congestion Mitigation and Air Quality |
• Annual hours of peak hour excessive delay per capita (for travel on NHS roadways) |
Clean Air and Healthy Communities |
Environmental Sustainability |
Congestion Mitigation and Air Quality |
• Total emissions reduction for applicable pollutants and precursors for CMAQ-funded projects in designated nonattainment and maintenance areas |
Clean Air and Healthy Communities, Resiliency |
CMAQ = Congestion Mitigation and Air Quality Improvement Program. MPO = metropolitan planning organization. NHS = National Highway System.
Sources: Highway Safety Improvement Program Rule (23 CFR 924), National Performance Management Measures Rule (23 CFR 490), and the Boston Region MPO staff.
The MPO’s PBPP framework is also used to inform decision-making in other areas that relate to its federally mandated responsibilities, or to the MPO’s goals and objectives. For example, the MPO goals includefacilitating an inclusive and transparent transportation-planning process and making investments that eliminate transportation-related disparities.
The MPO’s work in this area includes assessing the community level implications of each project proposed for funding in the TIP as well as analyzing the impacts of regionally prioritized projects, as a group. Regular performance monitoring enables the MPO to better understand how local stakeholders may be affected by transportation investment decisions, so that it can decide whether and how to refine its investment approach. These activities for the FFYs 2026−30 TIP are described in Chapter 6.
Setting federally required performance measures involves three phases: (1) planning, (2) investing, and (3) monitoring and evaluating performance outcomes.
In the planning phase, agencies set goals and objectives for the transportation system, identify performance measures, and set performance targets. They identify and acquire data and conduct analyses needed to support these processes. They also outline the frameworks they will use to make decisions in key planning documents.
The Commonwealth of Massachusetts creates performance-based plans, such as the Strategic Highway Safety Plan (SHSP) for improving roadway safety and the Transportation Asset Management Plan (TAMP) for improving infrastructure condition, particularly for roads and bridges on the National Highway System (NHS). Similarly, transit providers create Transit Asset Management (TAM) plans and Public Transportation Agency Safety Plans (PTASPs) that describe the data and processes these agencies will use to address transit state-of-good repair and safety needs. The Commonwealth is responsible for setting performance targets for the federally required roadway performance measures described in Table 4-3, while transit agencies must set targets for the measures described in Table 4-2.
The MPO’s activities in the planning phase include creating a goals-and-objectives framework in its LRTP and other performance-based plans—such as the Congestion Management Process Plan—as necessary. The MPO also establishes targets for federally required performance measures. It may support performance targets set by the Massachusetts Department of Transportation (MassDOT) or public transit providers, or it may set separate targets for the MPO’s planning area.
Table 4-4
MPO Performance Targets by Lead Target-Setting Agency
National Goal Area |
MPO Performance Area |
Lead Target Setting Agency |
Safety |
Roadway Safety |
MassDOT |
Safety |
Transit Safety |
RTAs: CATA, MBTA, MWRTA |
Infrastructure Condition |
Bridge Condition |
MassDOT |
Infrastructure Condition |
Pavement Condition |
MassDOT |
Infrastructure Condition |
Transit Asset Management |
RTAs: CATA, MBTA, MWRTA |
System Reliability, Freight Movement and Economic Vitality |
Truck Travel Time Reliability |
MassDOT |
System Reliability, Freight Movement and Economic Vitality |
Travel Time Reliability |
MassDOT |
Congestion Reduction |
Congestion Mitigation and Air Quality |
Boston Region MPO |
Environmental Sustainability |
Congestion Mitigation and Air Quality |
Boston Region MPO |
CATA = Cape Ann Transportation Authority. MPO = metropolitan planning organization. MWRTA = MetroWest Regional Transit Authority. RTA = regional transit authority.
Source: Boston Region MPO staff.
In the investing phase, agencies use the framework established in the planning phase to create strategies for investing transportation funds. When updating the LRTP, the MPO creates investment programs and funding guidelines to help direct project investments to meet the MPO’s goals. In each TIP cycle, the MPO selects projects to fund in these programs. MPO members rely on several sets of information when selecting projects:
Meanwhile, MassDOT, the Massachusetts Bay Transportation Authority (MBTA), Cape Ann Transportation Authority (CATA), and MetroWest Regional Transit Authority (MWRTA) follow their respective processes to select projects and programs for inclusion in the MassDOT Capital Investment Plan (CIP). The federally funded investments that are included in the CIP are also documented in the MPO’s TIP.
After making plans and investments, state DOTs, MPOs, and regional transit authorities (RTAs) report on performance outcomes. This reporting includes tracking trends, collecting data to understand the results of investment decisions, and comparing targets to actual performance. A before-and-after study comparing TIP project expectations to actual outcomes was released during state fiscal year (SFY) 2024 and laid the foundation for future efforts to incorporate this into the PBPP as a regular process.
In addition, the MPO describes performance on various transportation metrics through its Congestion Management Process and tools such as the MPO’s Performance Dashboard. MassDOT reports on performance targets and progress to the Federal Highway Administration (FHWA) and posts the information on the MassDOT Performance Management Tracker website. Public transit providers report their targets and performance progress to the Federal Transit Administration (FTA).
Federal transportation agencies require states, public transit operators, and MPOs to share information to ensure processes are consistent. In Massachusetts, these coordination responsibilities are outlined in the 2019 Performance-Based Planning and Programming Agreement between MassDOT, Massachusetts MPOs and transportation planning organizations, the MBTA, and RTAs operating in Massachusetts.
Staff from Massachusetts MPOs, MassDOT staff, and other stakeholders coordinate on PBPP implementation through the Transportation Program Managers Group (TMG), including through its subcommittee on performance measures. For performance measures that state and MPOs track at the urbanized area (UZA) level, coordination responsibilities are documented in the 2024 Boston MA-NH Metropolitan Area Memorandum of Understanding (MOU).1 The Boston Region MPO is also a signatory to the Providence RI-MA UZA MOU and the Worcester MA-CT UZA MOU. These agreements define intergovernmental coordination responsibilities and activities that may support PBPP.
This section discusses investments in the FFYs 2026−30 TIP and how they relate to elements of the MPO’s PBPP framework.2
Through its Safety goal area, the MPO has committed to investing in projects and programs that aim to reduce the number and severity of crashes for all modes, and the number of serious injuries and fatalities occurring on the transportation system. Similarly, the Massachusetts SHSP and National Roadway Safety Strategy include a long-term “Vision Zero” goal to move “towards zero deaths” by eliminating fatalities and serious injuries, and they provide a comprehensive framework for improving safety on all public roads in the Commonwealth.3 The Commonwealth’s Bicycle Transportation and Pedestrian Transportation Plans also include initiatives and actions intended to make walking and biking safer.4 And to complement the Commonwealth’s efforts, the MPO is drafting a grant-funded Comprehensive Safety Action Plan to help boost roadway safety performance in the region.
The MBTA, MWRTA, and CATA produce PTASPs that describe how they will implement safety management systems (SMS). Transit providers support SMS through safety management policies, safety risk management strategies, safety assurance methods (which include performance monitoring), and safety promotion. PTASPs also describe the performance targets these agencies set for measures outlined in the National Public Transportation Safety Plan.
For each calendar year (CY), as required by FHWA, the Commonwealth and the MPO must set targets for five federally required roadway safety performance measures:
Values are expressed as five-year rolling annual averages and are tracked using information from the Massachusetts Crash Data System and the National Highway Traffic Safety Administration’s (NHTSA’s) Fatality Analysis and Reporting System (FARS).
The Commonwealth adopted targets in August 2024 for CY 2025 based on data that were available in summer 2024, when the Commonwealth was setting CY 2025 targets. Table 4-5 shows the Commonwealth’s CY 2025 roadway safety performance targets for 2021–25 and 2023–27, and long-term targets, all of which were adopted by the MPO. All values are written as five-year averages.
Table 4-5
Massachusetts Safety Performance Targets
Performance Measure |
CY 2021–25 Target* |
CY 2023–27 Target) |
Massachusetts Long-Term Target |
Number of Fatalities |
365.00 |
315.00 |
0.00 |
Fatality Rate (per 100M VMT) |
0.58 |
0.48 |
0.00 |
Number of Serious Injuries |
2,622.00 |
2,258.00 |
0.00 |
Serious Injury Rate (per 100M VMT) |
4.17 |
3.48 |
0.00 |
Number of Nonmotorized Fatalities and Serious Injuries |
497.00 |
445.00 |
0.00 |
* These targets are expressed as five-year rolling annual averages.
CY = calendar year. M = million. VMT = vehicle-miles traveled.
Sources: Federal Highway Administration, Commonwealth of Massachusetts, Boston Region MPO staff.
Figures 4-1 through 4-5 display past performance data and CY 2025 and 2027 targets for Massachusetts for each roadway safety performance measure. In February 2025, the MPO endorsed the Commonwealth’s CY 2025 roadway safety performance targets as the targets for the Boston region. This approach reflects the way the MPO collaborates with the Commonwealth on safety strategies to reduce fatalities and injuries in the Boston region.
Figure 4-1 shows five-year rolling averages for fatalities for past years as well as past and future five-year rolling average targets for Massachusetts, as adopted by the Commonwealth and MPO. Both the Commonwealth and MPO continue to have a long-term goal of zero fatalities and injuries on Massachusetts’ roadways.
Figure 4-1
Number of Fatalities

MA = Massachusetts. MPO = Metropolitan Planning Organization.
Sources: National Highway Traffic Safety Administration Fatality Analysis and Reporting System, Massachusetts Department of Transportation, and Boston Region MPO staff.
Figure 4-2 shows rolling five-year averages of the fatality rate per 100 million VMT for past performance and past and future performance targets, as adopted by the Commonwealth and MPO.
Figure 4-2
Fatality Rate per 100 Million VMT

MA = Massachusetts. MPO = Metropolitan Planning Organization. VMT = vehicle-miles traveled.
Sources: National Highway Traffic Safety Administration Fatality Analysis and Reporting System, Massachusetts Department of Transportation, and Boston Region MPO staff.
Figure 4-3 shows rolling five-year averages of past performance and past and future performance targets for the number of serious injuries, as adopted by the Commonwealth and MPO.
Figure 4-3
Number of Serious Injuries

MA = Massachusetts. MPO = Metropolitan Planning Organization.
Sources: Massachusetts Department of Transportation and Boston Region MPO Staff.
Figure 4-4 shows rolling five-year averages of past performance and past and future performance targets for the rate of serious injuries per 100 million VMT, as adopted by the Commonwealth and MPO.
Figure 4-4
Serious Injury Rate per 100 Million VMT

MA = Massachusetts. MPO = Metropolitan Planning Organization. VMT = vehicle-miles traveled.
Sources: Massachusetts Department of Transportation and Boston Region MPO staff.
Figure 4-5 shows rolling five-year averages of past performance and past and future performance targets for the combined number of nonmotorized fatalities and serious injuries, as adopted by the Commonwealth and MPO.
Figure 4-5
Number of Nonmotorized Fatalities and Serious Injuries

MA = Massachusetts. MPO = Metropolitan Planning Organization.
Sources: Massachusetts Department of Transportation and Boston Region MPO staff.
By endorsing the Commonwealth’s roadway safety targets for the Boston region, the MPO agreed to program projects that help achieve those targets. When selecting projects to fund, the MPO identifies projects likely to improve safety outcomes through its TIP project selection criteria. Criteria account for crash activity within the project area and the types of safety countermeasures included in the proposed project.
All projects funded by the MPO include safety countermeasures or features that are expected to improve safety for people traveling by motor vehicle, bicycle, and walking or rolling. Projects in the Intersection Improvement, Complete Streets, and Major Infrastructure programs are expected to improve safety on roadways for multiple travel modes, while Bicycle Network and Pedestrian Connections and Transit Transformation projects will improve safety for those traveling by nonmotorized means.
Table 4-6 lists performance metrics that assess how FFYs 2026–30 corridor, intersection, and bicycle and pedestrian projects may improve safety.5 The information shown indicates the number of projects that have safety countermeasures and improvements focused on high-crash locations. Table A-2 in Appendix A summarizes the impacts each Regional Target project is expected to have on performance areas discussed throughout this chapter, including safety performance.
Table 4-6
FFYs 2026–30 Projects: Roadway Safety Performance Metrics
Metric |
Value |
Regional Target projects that address all-mode HSIP clusters |
8 projects |
Regional Target projects that address HSIP Pedestrian clusters |
8 projects |
Regional Target projects that address HSIP bicycle clusters |
2 projects |
Project areas where fatal crashes have occurred |
2 areas |
Project areas where injury crashes have occurred |
4 areas |
Note: The group of projects reflected in this table does not include Community Connections investments or Transit Transformation investments. All types of HSIP clusters and project areas are based on data available at the time of project scoring.
HSIP = Highway Safety Improvement Program.
Sources: Massachusetts Crash Data System, Massachusetts Department of Transportation, and the Boston Region MPO.
Other MassDOT-funded TIP projects in the FFYs 2026–30 TIP will also improve safety and reduce fatalities and serious injuries on the region’s roadways. MassDOT’s Intersection Improvements, Roadway Improvements, Roadway Reconstruction, Safe Routes to School, and Safety Improvements programs most directly address safety considerations. The Commonwealth conducted a Vulnerable Road Users assessment in 2023 to focus on reducing nonmotorized fatalities and serious injuries. This led to the development and upcoming deployment of improvements near local-priority locations with high incidences of these injuries, such as bus stops.
At the MPO level, the Reliability and Modernization programs focus on maintaining and upgrading infrastructure, which help make roadway travel safer. The various bridge and pavement improvement programs may also improve safety by supporting asset maintenance and state of good repair. The Bicycle and Pedestrian projects may reduce nonmotorized fatalities and injuries by improving separated facilities for people bicycling, walking, and rolling.
The National Public Transportation Safety Plan details performance measures for which transit agencies subject to the PTASP rule must set targets. Transit agencies revisit their performance targets when updating their PTASPs each year. Required performance measures are shown in Table 4-7.6
Table 4-7
Number of Nonmotorized Fatalities and Serious Injuries
Measure Category |
Measure |
Desired Direction |
Safety Events |
Total number of reportable safety events by mode |
Decrease |
Safety Events |
Rate of safety events per total VRM by mode |
Decrease |
Safety Events |
Collision Rate by mode (new) |
Decrease |
Safety Events |
Pedestrian Collision Rate by mode (new) |
Decrease |
Safety Events |
Vehicular Collision Rate by mode (new) |
Decrease |
Fatalities |
Total number of reportable fatalities by mode |
Decrease |
Fatalities |
Fatality rate per total VRM by mode |
Decrease |
Injuries |
Total number of reportable injuries by mode |
Decrease |
Injuries |
Injury rate per total VRM by mode |
Decrease |
Transit Worker Safety |
Transit Worker Fatality Rate by mode (new) |
Decrease |
Transit Worker Safety |
Transit Worker Injury Rate by mode (new) |
Decrease |
Transit Worker Safety |
Assaults on Transit Workers by mode (new) |
Decrease |
Transit Worker Safety |
Rate of Assaults on Transit Workers by mode (new) |
Decrease |
System Reliability |
Mean distance between major mechanical failures by mode |
Increase |
VRM = vehicle revenue-miles.
Source: Federal Transit Administration, “Safety Performance Targets Guide,” accessed February 4, 2025,https://www.transit.dot.gov/sites/fta.dot.gov/files/2024-11/SPTs-Guide-v3-11-06-2024.pdf.
MPOs have their own responsibilities pertaining to transit safety measures. MPOs must set regional targets for these transit safety performance measures in coordination with transit agencies and states. MPOs document these targets in the LRTPs and TIPs and consider proposed transit investments in the context of how they may improve transit safety. The Boston Region MPO updated its set of transit safety performance targets on February 20, 2025. This update includes the MBTA’s, MWRTA’s, and CATA’s safety targets. Each agency’s targets are presented separately to reflect the local context, including the characteristics of the local operating environments and planned investments, policies, and safety-management activities.
MBTA Safety Targets
The MBTA sets targets for four modes: heavy rail (Red, Orange, and Blue Lines), light rail (Green Line and the Mattapan High Speed Line), bus, and The RIDE paratransit system. The MBTA’s commuter rail network and ferry service are not subject to these FTA requirements and are addressed outside of the PTASP process. For data display purposes in this chapter, the 14 measures are divided into three categories: fatalities and injuries, transit worker safety, and safety events and reliability.
Table 4-8 shows averages for fatalities and injuries for CYs 2021 to 2023, which were the most recent data available at the time of performance target development.
Table 4-8
MBTA Performance on Fatalities and Injuries
(CYs 2021–23 Averages)
MBTA Mode |
Average Fatalities |
Average Fatality Rate |
Average Injuries |
Average Injury Rate |
Heavy Rail |
0.67 |
0.03 |
184 |
9.5 |
Light Rail |
0.33 |
0.06 |
97 |
17.0 |
Bus |
0 |
0 |
309 |
14.3 |
The RIDE |
0 |
0 |
26 |
3.0 |
Notes: All rates are expressed per one million vehicle revenue-miles.
CY = calendar year. MBTA = Massachusetts Bay Transportation Authority.
Source: MBTA and the Boston Region MPO staff.
The MBTA’s safety performance targets on fatalities and injuries for CY 2025 are shown in Table 4-9. When setting targets, the MBTA varied its approach by measure:
Table 4-9
MBTA CY 2025 Performance Targets on Fatalities and Injuries
MBTA Mode |
Fatalities Target |
Fatality Rate Target |
Injuries Target |
Injury Rate Target |
Heavy Rail |
0 |
0 |
180 |
9.31 |
Light Rail |
0 |
0 |
95 |
16.7 |
Bus |
0 |
0 |
303 |
14.0 |
The RIDE |
0 |
0 |
25 |
3 |
Notes: All rates are expressed per one million vehicle revenue-miles.
CY = calendar year. MBTA = Massachusetts Bay Transportation Authority.
Source: MBTA and the Boston Region MPO staff.
Table 4-10 shows averages for transit worker safety measures for CYs 2021 to 2023, which were the most recent data available at the time of performance target development.
Table 4-10
MBTA Performance on Transit Worker Safety
(CYs 2021–23 Averages)
MBTA Mode |
Average Fatality Rate |
Rate |
Average Assaults on Transit Workers |
Assault on Transit Worker Rate |
Heavy Rail |
0 |
3.09 |
47 |
1.52 |
Light Rail |
0 |
10.8 |
27 |
5.26 |
Bus |
0 |
10.1 |
239 |
4.85 |
The RIDE |
0 |
1 |
4 |
0 |
Notes: All rates are expressed per one million vehicle revenue-miles.
CY = calendar year. MBTA = Massachusetts Bay Transportation Authority.
Source: MBTA and the Boston Region MPO staff.
The MBTA’s safety performance targets for CY 2024 are shown in Table 4-11. When setting targets, the MBTA varied its approach by measure:
Table 4-11
MBTA CY 2025 Transit Worker Safety Performance Targets
MBTA Mode |
Average Fatality Rate |
Average Injury Rate |
Average Assaults on Transit Workers |
Assault on Transit Worker Rate |
Heavy Rail |
0 |
3.03 |
28 |
1.49 |
Light Rail |
0 |
10.6 |
29 |
5.15 |
Bus |
0 |
9.94 |
103 |
4.75 |
The RIDE |
0 |
1 |
1 |
0 |
Notes: All rates are expressed per one million vehicle revenue-miles.
CY = calendar year. MBTA = Massachusetts Bay Transportation Authority.
Source: MBTA and the Boston Region MPO staff.
Table 4-12 shows averages for safety events and reliability for CYs 2021 to 2023, which were the most recent data available at the time of performance target development.
Table 4-12
MBTA Performance on Safety Events and Reliability
(CYs 2021–23 Averages)
MBTA Mode |
Average Collision Rate |
Average Pedestrian Collision Rate |
Average Vehicular Collision Rate |
Average Safety Events |
Average Safety Event Rate |
Average System Reliability (miles) |
Heavy Rail |
0.52 |
0.38 |
0 |
29 |
1.52 |
N/A |
Light Rail |
2.81 |
0.94 |
3.27 |
30 |
5.26 |
N/A |
Bus |
4.45 |
1.65 |
59 |
105 |
4.85 |
N/A |
The RIDE |
3 |
0 |
2 |
29 |
3.23 |
N/A |
Notes: All rates are expressed per one million vehicle revenue-miles.
CY = calendar year. MBTA = Massachusetts Bay Transportation Authority.
Source: MBTA and the Boston Region MPO staff.
The MBTA’s safety performance targets for CY 2025 are shown in Table 4-13. When setting targets, the MBTA varied its approach by measure:
Table 4-13
MBTA CY 2025 Safety Events and Reliability Performance Targets
MBTA Mode |
Average Collision Rate |
Average Pedestrian Collision Rate |
Average Vehicular Collision Rate |
Average Safety Events |
Average Safety Event Rate |
Average System Reliability (miles) |
|
Heavy Rail |
0.51 |
0.37 |
0 |
28 |
1.49 |
49,000 |
|
Light Rail |
2.75 |
0.92 |
3.2 |
29 |
5.15 |
8,216 |
|
Bus |
4.36 |
1.62 |
57.8 |
103 |
4.75 |
28,500 |
|
The RIDE |
3 |
0 |
2 |
28 |
3 |
25,900 |
|
Notes: All rates are expressed per one million vehicle revenue-miles.
CY = calendar year. MBTA = Massachusetts Bay Transportation Authority.
Source: MBTA and the Boston Region MPO staff.
CATA Safety Targets
CATA monitors safety performance and sets targets for its fixed-route bus service and its demand response service. For data display purposes in this chapter, the 14 measures are divided into three categories: fatalities and injuries, transit worker safety, and safety events and reliability.
Table 4-14 shows averages for fatalities and injuries for CYs 2020 to 2024, which were the most recent data available at the time of performance target development.
Table 4-14
CATA Performance on Fatalities and Injuries
(CY 2020–24 Averages)
CATA Mode |
Average Fatalities |
Average Fatality Rate |
Average Injuries |
Average Injury Rate |
Fixed- Route Bus |
0 |
0 |
0 |
0 |
Demand Response |
0 |
0 |
0 |
0 |
Note: All rates are expressed per one hundred thousand vehicle revenue-miles.
CATA = Cape Ann Transportation Authority. CY = calendar year.
Sources: CATA, the National Transit Database, and the Boston Region MPO staff.
Table 4-15 provides a summary of CATA’s CY 2025 performance targets. Having no reportable fatalities nor injuries from 2020 to 2024, CATA set CY 2025 targets of zero for all transit worker safety measures.
Table 4-15
CATA CY 2025 Performance Targets on Fatalities and Injuries
CATA Mode |
Average Fatalities |
Average Fatality Rate |
Average Injuries |
Average Injury Rate |
Fixed- Route Bus |
0 |
0 |
0 |
0 |
Demand Response |
0 |
0 |
0 |
0 |
Note: All rates are expressed per one hundred thousand vehicle revenue-miles.
CATA = Cape Ann Transportation Authority. CY = calendar year.
Sources: CATA, the National Transit Database, and the Boston Region MPO staff.
Table 4-16 shows averages for transit worker safety measures for CYs 2020 to 2024, which were the most recent data available at the time of performance target development.
Table 4-16
CATA Performance on Transit Worker Safety
(CY 2020–24 Averages)
CATA Mode |
Average Fatality Rate |
Average Injury Rate |
Average Assaults on Transit Workers |
Assault on Transit Worker Rate |
Fixed- Route Bus |
0 |
0 |
0 |
0 |
Demand Response |
0 |
0 |
0 |
0 |
Note: All rates are expressed per one hundred thousand vehicle revenue-miles.
CATA = Cape Ann Transportation Authority. CY = calendar year.
Sources: CATA, the National Transit Database, and the Boston Region MPO staff.
CATA’s transit worker safety performance targets for CY 2025 are shown in Table 4-17. Having no reportable transit worker fatalities nor injuries from 2020 to 2024, CATA set CY 2025 targets of zero for all transit worker safety measures.
Table 4-17
CATA CY 2025 Performance Targets on Transit Worker Safety
CATA Mode |
Average Fatality Rate |
Average Injury Rate |
Average Assaults on Transit Workers |
Assault on Transit Worker Rate |
Fixed- Route Bus |
0 |
0 |
0 |
0 |
Demand Response |
0 |
0 |
0 |
0 |
Note: All rates are expressed per one hundred thousand vehicle revenue-miles.
CATA = Cape Ann Transportation Authority. CY = calendar year.
Sources: CATA, the National Transit Database, and the Boston Region MPO staff.
Table 4-18 shows averages for safety events and reliability for CYs 2020 to 2024, which were the most recent data available at the time of performance target development.
Table 4-18
CATA Performance on Safety Events and Reliability
(CYs 2020–24 Averages)
CATA Mode |
Average Collision Rate |
Average Pedestrian Collision Rate |
Average Vehicular Collision Rate |
Average Safety Events |
Average Safety Event Rate |
Average System Reliability (miles) |
Fixed-Route Bus |
2.36 |
0 |
2.36 |
2.2 |
0.61 |
117,129 |
Demand Response |
2.41 |
0 |
2.41 |
1 |
0.58 |
156,199 |
Note: All rates are expressed per one hundred thousand vehicle revenue-miles.
CATA = Cape Ann Transportation Authority. CY = calendar year.
Sources: CATA, the National Transit Database, and the Boston Region MPO staff.
CATA’s safety performance targets for safety events and reliability for CY 2025 are shown in Table 4-19. When setting targets, CATA varied its approach by measure:
Table 4-19
CATA CY 2025 Safety Events and Reliability Performance Targets
CATA Mode |
Average Collision Rate |
Average Pedestrian Collision Rate |
Average Vehicular Collision Rate |
Average Safety Events |
Average Safety Event Rate |
Average System Reliability (miles) |
Fixed-Route Bus |
2.0 |
0 |
2.0 |
2.0 |
0.5 |
96,775 |
Demand Response |
2.0 |
0 |
2.0 |
1.0 |
0.5 |
203,908 |
Note: All rates are expressed per one hundred thousand vehicle revenue-miles.
CATA = Cape Ann Transportation Authority. CY = calendar year.
Sources: CATA, the National Transit Database, and the Boston Region MPO staff.
MWRTA Safety Targets
MWRTA monitors safety performance and sets targets for its fixed-route bus service and its demand response service. For data display purposes in this chapter, the 14 measures are divided into three categories: fatalities and injuries, transit worker safety, and safety events and reliability.
Table 4-20 shows averages for fatalities and injuries for CYs 2020 to 2024, which were the most recent data available at the time of performance target development.
Table 4-20
MWRTA Performance on Fatalities and Injuries
(CY 2020–24 Averages)
MWRTA Mode |
Average Fatalities |
Average Fatality Rate |
Average Injuries |
Average Injury Rate |
Fixed- Route Bus |
0 |
0 |
1.0 |
0.09 |
Demand Response |
0 |
0 |
0.6 |
0.07 |
Note: All rates are expressed per one hundred thousand vehicle revenue-miles.
CY = calendar year. MWRTA = MetroWest Regional Transit Authority.
Sources: MWRTA, the National Transit Database, and the Boston Region MPO staff.
Table 4-21 provides a summary of MWRTA’s CY 2025 performance targets. Targets are expressed per 100,000 VRM.
Table 4-21
MWRTA CY 2025 Performance Targets on Fatalities and Injuries
MWRTA Mode |
Average Fatalities |
Average Fatality Rate |
Average Injuries |
Average Injury Rate |
Fixed- Route Bus |
0 |
0 |
9 |
0.8 |
Demand Response |
0 |
0 |
7 |
0.7 |
Note: All rates are expressed per one hundred thousand vehicle revenue-miles.
CY = calendar year. MWRTA = MetroWest Regional Transit Authority.
Sources: MWRTA, the National Transit Database, and the Boston Region MPO staff.
Table 4-22 shows averages for transit worker safety measures for CYs 2020 to 2024, which were the most recent data available at the time of performance target development.
Table 4-22
MWRTA Performance on Transit Workers Safety
(CY 2020–24 Averages)
MWRTA Mode |
Average Fatality Rate |
Average Injury Rate |
Average Assaults on Transit Workers |
Assault on Transit Worker Rate |
Fixed- Route Bus |
0 |
0.02 |
0 |
0 |
Demand Response |
0 |
0 |
0 |
0 |
Note: All rates are expressed per one hundred thousand vehicle revenue-miles.
CY = calendar year. MWRTA = MetroWest Regional Transit Authority.
Sources: MWRTA, the National Transit Database, and the Boston Region MPO staff.
MWRTA’s safety performance targets for CY 2025 are shown in Table 4-23. With the exception of transit worker fatality rate, MWRTA set more conservative transit worker injury and transit worker assault targets for CY 2025 than CY 2020–24 performance to account for increased encouragement to report incidents.
Table 4-23
MWRTA CY 2025 Performance Targets on Transit Workers Safety
MWRTA Mode |
Average Fatality Rate |
Average Injury Rate |
Average Assaults on Transit Workers |
Assault on Transit Worker Rate |
Fixed- Route Bus |
0 |
0.44 |
6 |
0.53 |
Demand Response |
0 |
0.5 |
5 |
0.5 |
Note: All rates are expressed per one hundred thousand vehicle revenue-miles.
CY = calendar year. MWRTA = MetroWest Regional Transit Authority.
Sources: MWRTA, the National Transit Database, and the Boston Region MPO staff.
Table 4-24 shows averages for safety events and reliability for CYs 2020 to 2024, which were the most recent data available at the time of performance target development.
Table 4-24
MWRTA Performance on Safety Events and Reliability
(CYs 2020–24 Averages)
MWRTA Mode |
Average Collision Rate |
Average Pedestrian Collision Rate |
Average Vehicular Collision Rate |
Average Safety Events |
Average Safety Event Rate |
Average System Reliability (miles) |
Fixed-Route Bus |
0.07 |
0 |
0.07 |
1.2 |
0.11 |
171,428 |
Demand Response |
0.02 |
0 |
0.02 |
0.8 |
0.10 |
112,346 |
Note: All rates are expressed per one hundred thousand vehicle revenue miles. Average system reliability includes data from CY 2020–23 only.
CY = calendar year. MWRTA = MetroWest Regional Transit Authority.
Sources: MWRTA, the National Transit Database, and the Boston Region MPO staff.
MWRTA’s safety performance targets for safety events and reliability for CY 2025 are shown in Table 4-25. When setting targets, the MWRTA varied its approach by measure. MWRTA set CY 2025 targets for pedestrian and vehicular collision rates for both modes to less than 0.5 collisions per 100,000 VRM for both fixed-route and demand response service. MWRTA set CY 2025 targets on collision-related and safety events that are more conservative than past performance to account for increased encouragement to report incidents. For system reliability, MWRTA set CY 2025 targets to 75,000 per mechanical failure for both modes, which is a significant improvement compared to CY 2020–24 performance.
Table 4-25
MWRTA CY 2025 Safety Events and Reliability Performance Targets
MWRTA Mode |
Average Collision Rate |
Average Pedestrian Collision Rate |
Average Vehicular Collision Rate |
Average Safety Events |
Average Safety Event Rate |
Average System Reliability (miles) |
Fixed-Route Bus |
6 |
0.08 |
0.44 |
9 |
0.8 |
75,000 |
Demand Response |
4 |
0.1 |
0.5 |
7 |
0.7 |
75,000 |
Note: All rates are expressed per one hundred thousand vehicle revenue-miles.
CY = calendar year. MWRTA = MetroWest Regional Transit Authority.
Sources: MWRTA, the National Transit Database, and the Boston Region MPO staff.
MassDOT and the transit agencies in the Boston region account for safety when selecting transit projects for capital investment programs, including the TIP. Safety is part of MassDOT’s Reliability priority area and investment programs are sized to support MBTA and RTA asset condition. Safety issues are also considered at the level of individual investments. For example, members of the MBTA Safety team review all candidate projects to determine whether they may address documented existing or potential safety hazards.
MPO-funded corridor and intersection projects can also help improve safety outcomes for bus and paratransit services by making the region’s roadways safer. Also, the MPO will spend $30 million on its Transit Transformation Program in the FFY 2026-30 TIP. In October 2020, the MPO established baseline transit safety evaluation criteria for this program, which mirror the evaluation criteria used by the MBTA. The MPO continues to work with MassDOT and the region’s transit agencies to define the scope of this program.
The MBTA’s planned capital investments are intended to improve safety outcomes, asset condition, and system reliability. The MBTA is currently undergoing an aggressive plan to improve track segments on heavy and light rail systems.
CATA and MWRTA also plan to make investments that will support safety. CATA will continue to use its federal and state dollars to fund preventative maintenance activities, improve its administration and maintenance facility, and purchase new revenue vehicles to replace those that have reached the end of their useful life. Similarly, MWRTA will continue to purchase replacement vehicles and invest in facility modernization and expansion to its Blandin terminal facility and the intermodal center at the commuter rail station in Framingham. In addition, MWRTA is expanding its vehicle fleet to include larger 29-foot, low-floor buses. Transit agency investments are also discussed in the Mobility and Reliability Performance section of this chapter and additional details about these investments are available in Chapter 3.
In 2023, the MPO was awarded a federal Safe Streets and Roads for All discretionary grant of $2.1 million. The MPO is using this grant money to create an action plan, and the MPO will continue to work with its planning partners and other stakeholders to better understand roadway and transit risk, measure safety outcomes, and invest in projects that will reduce fatalities and injuries. As part of the planning process, the MPO board is required to adopt a resolution committing to the eventual goal of zero roadway fatalities and serious injuries that is associated with either (1) a target date for achieving zero roadway fatalities and serious injuries, or (2) an ambitious reduction of fatalities and serious injuries by a specific date with an eventual goal of zero deaths and serious injuries. The goals and targets will be based upon the planning efforts and recommendations from the Regional Comprehensive Safety Action Plan study efforts. The action plan is expected to be complete during FFY 2025.
Aligned with the national goal of System Reliability, the MPO goal of Mobility and Reliability aims to maintain and modernize the transportation system in addition to planning for its resiliency. There is a need to address existing maintenance and state-of-good-repair needs for roads, sidewalks, and transit assets, update infrastructure to meet traveler needs, and prepare for existing and future extreme conditions such as sea level rise and flooding.
Projects funded in the FFYs 2026–30 TIP support asset condition improvements, which complement MassDOT’s and transit agencies’ more extensive state-of-good-repair and modernization projects. MassDOT uses information from its asset management systems to guide decisions about asset maintenance and modernization to boost mobility and reliability, and considers roadway investment priorities from its Transportation Asset Management Plan.7 Similarly, transit agencies that receive FTA funding must produce Transit Asset Management plans that describe transit system assets and their condition, along with the tools and investment strategies these agencies will use to improve these assets. Additionally, MassDOT’s Freight Plan guides its vision for moving goods around the Commonwealth.8
Bridge Condition Measures and Targets
To meet federal performance monitoring requirements, states and MPOs must track and set performance targets for the condition of bridges on the National Highway System. Bridge condition performance measures include the following:
NHS bridge condition is classified based on the condition ratings of three bridge components: the deck, the superstructure, substructure, and culvert. The lowest rating of the three components determines the overall bridge condition. The measures express the share of NHS bridges in a certain condition by deck area, divided by the total deck area of NHS bridges in the MPO region or state.
Table 4-26 shows the performance baselines for NHS bridge condition in Massachusetts and the Boston region. MassDOT determined that Massachusetts has 2,246 NHS bridges and analyzed those bridges to understand their current condition with respect to the federal bridge-condition performance measures. In 2022, MassDOT analyzed the 844 NHS bridges in the region. According to these baseline values, the Boston region had a smaller share of NHS bridge deck area considered to be in good condition and a slightly larger share of NHS bridge deck area considered to be in poor condition, compared to Massachusetts overall.
Table 4-26
NHS Bridge Condition Baselines for Massachusetts and the Boston Region
Geographic Area |
Total NHS Bridges |
Total NHS Bridge Deck Area |
Percent of NHS Bridge Deck Area in Good Condition |
Percent of NHS Bridge Deck Area in PoorCondition |
Massachusetts1 |
2,246 |
28,689,888 |
16.9% |
11.2% |
Boston Region |
844 |
13,916,199 |
15.7% |
12.9% |
1Massachusetts baseline data is based on a MassDOT analysis conducted in 2022.
NHS = National Highway System.
Source: Massachusetts Department of Transportation.
States must set performance targets for NHS bridge and pavement condition measures at two-year and four-year intervals. Table 4-27 shows the baseline Massachusetts value calculated in 2022 and MassDOT’s current NHS bridge performance targets established in 2023. The two-year target reflects conditions as of the end of CY 2023, and the four-year target reflects conditions as of the end of CY 2025. These targets reflect the bridge condition MassDOT anticipated based on historic trends and planned bridge investments. As shown in the table, MassDOT anticipated that the share of NHS bridge deck area in good condition and poor condition would be nearly identical to the baseline.
Table 4-27
Massachusetts NHS Bridge Condition Targets
Federally Required Bridge Condition Performance Measure |
Baseline (CY 2022) |
Two-Year Target |
Four-Year Target |
MA Long Term Target |
Percent of NHS Bridges [by deck area] that are in good condition |
16% |
16% |
16% |
>18% |
Percent of NHS Bridges [by deck area] that are in poor condition |
12% |
16% |
12% |
< 10% |
CY = calendar year. MA = Massachusetts. NHS = National Highway System.
Sources: Massachusetts Department of Transportation and the Boston Region MPO staff.
The Boston Region MPO elected to support MassDOT’s four-year bridge performance targets in February 2023. This approach reflects the ways that each entity supports bridge improvements in the Boston region. The MPO’s Regional Target program typically makes modest contributions to bridge improvements in the Boston region, while the MassDOT Bridge Program remains the region’s primary funding source for the replacement or rehabilitation of substandard bridges.
Within the Boston region, 3,692 lane-miles (16 percent all of roadway lane miles) are part of the NHS. Of these, there are 1,160 lane miles (37 percent) on the Interstate System, which is owned by MassDOT, and 2,532 non-Interstate NHS roadway lane miles.
Federal NHS pavement performance measures include the following:
Interstate pavement is classified as in good or poor condition using the International Roughness Index (IRI) and one or more pavement distress metrics (cracking and/or rutting and faulting) depending on the pavement type (asphalt, jointed concrete, or continuous concrete). FHWA sets thresholds for each metric that determine whether the metric value is good, fair, or poor, along with thresholds that determine whether the pavement segment as a whole is in good or poor condition.
In 2023, MassDOT established performance targets for NHS pavement condition performance measures. The two-year target reflects conditions as of the end of CY 2023, and the four-year target reflects conditions as of the end of CY 2025. The other types of distress data have not previously been required as part of MassDOT’s pavement-monitoring programs.10 At the time of target setting, MassDOT noted that setting targets for these pavement-condition measures is challenging given the lack of complete historical data. MassDOT’s approach when setting targets was to use past pavement indicators to identify trends and to set conservative targets. Table 4-28 shows MassDOT’s performance targets for these measures along with baseline data as of 2021.
Table 4-28
Massachusetts NHS Pavement Condition Targets
Federally Required Pavement Condition Performance Measure1 |
Baseline |
Two-Year Target |
Four-Year Target |
Percent of Interstate Highway System pavements that are in good condition2 |
72% |
70% |
70% |
Percent of Interstate Highway System pavements that are in poor condition |
0% |
2% |
2% |
Percent of non-Interstate NHS pavements that are in good condition |
33.9% |
30% |
30% |
Percent of non-Interstate NHS pavements that are in poor condition |
2.9% |
5% |
5% |
1 The 2021 values for pavement condition are as of January 1, 2021.
2 These values reflect the International Roughness Index only.
CY = calendar year. NHS = National Highway System.
Source: Massachusetts Department of Transportation.
MPOs are required to set four-year Interstate and non-Interstate NHS pavement-condition performance targets by either supporting state targets or setting separate quantitative targets for the region. The Boston Region MPO elected to support MassDOT’s four-year targets for these NHS pavement-condition measures in March 2023. This approach reflects the ways that each entity supports NHS and other pavement improvements in the Boston region. MassDOT’s pavement-improvement programs, along with its other corridor and intersection improvement programs, provide the majority of funding for pavement improvements in the Boston region. While the MPO’s policy has been to not use Regional Target funds for projects that only resurface pavement, the MPO does fund roadway reconstruction projects that include pavement improvements in addition to other design elements. Through this process the MPO will work with MassDOT to make progress towards these NHS pavement-condition targets.
When prioritizing capital investments for the TIP, the MPO uses its project evaluation criteria to assess how well each project funded with Regional Target dollars may help maintain or prevent damage to the Boston region’s roadway infrastructure. The MPO’s criteria prioritize projects that improve poor condition bridges, pavement, sidewalks, and signals, and projects that improve the network’s ability to support emergency response, continue functioning during extreme weather events, enhance the natural environment, and improve regional coordination, among other resilience elements. In October 2020, the MPO adopted an updated set of project selection criteria that
More information about the MPO’s current TIP criteria is available in Appendix A.
Table 4-29 displays metrics and information about how the MPO’s FFYs 2026–30 Regional Target projects are expected to improve infrastructure on the region’s roadways. MPO staff developed estimated values for these metrics using available data from MassDOT’s Bridge Inventory and Road Inventory files; project proponent information such as functional design reports; results from TIP project evaluations; and other sources. The MPO expects that these FFYs 2026–30 investments will help make progress towards statewide NHS bridge and pavement condition targets, help improve the overall condition of the region’s roadways and bridges, and address resiliency needs.
Table 4-29
Regional Target Projects: Roadway Asset Condition Performance Metrics
Metric |
Value |
Bridge structures improved |
4 structures |
NHS bridge structures improved |
2 structures |
New bridge structures to be constructed |
7 structures |
Lane miles of substandard pavement improved1 |
62.4 lane miles |
Lane miles of substandard NHS pavement improved1 |
34.0 lane miles |
Miles of substandard sidewalk improved |
25.7 miles |
Note: Community Connections projects do not include system preservation and modernization elements and are not included in this table.
1 Substandard pavement and sidewalk designations are based on data provided by MassDOT and project proponents and on MPO assessments conducted for TIP evaluations. The estimated lane miles of substandard NHS pavement improved is based on the pavement condition assessment for the project and the MPO’s assessment of the portion of the project on the NHS. The IRI thresholds used to classify pavement are based on TIP criteria approved in October 2020: less than 95 (good), 95 to 170 (fair or substandard), greater than 170 (poor or substandard).
NHS = National Highway System.
Source: Massachusetts Department of Transportation and the Boston Region MPO staff.
Travel Time Reliability
FHWA requires states and MPOs to monitor and set targets for two performance measures that pertain to all travelers on NHS roadways:
These measures capture (1) whether travel times on an NHS segment are consistent (reliability); and (2) the extent to which NHS users’ travel may be affected by those conditions (percent of person miles). Several component metrics make up this measure:
States and MPOs identify the person-miles of travel for each NHS segment and divide the total person-miles on the relevant NHS network that are reliable by the total person-miles on the relevant NHS network. To support this analysis, FHWA provides travel-time and traffic-volume data as part of the National Performance Management Research Data Set (NPMRDS), in which travel-time data are reported by traffic messaging channel (TMC) segments. These data, along with a set of analysis tools, are available through the Regional Integrated Transportation Information System (RITIS), which is developed and maintained by the Center for Advanced Transportation Technology Laboratory at the University of Maryland. MassDOT has obtained access to the RITIS platform and grants access to MPOs and transportation planning organizations in the Commonwealth.
States are required to set two-year and four-year targets for these measures. In 2022, MassDOT calculated baselines and established targets for these measures for the Massachusetts Interstate and non-Interstate NHS networks. MassDOT considered FHWA guidance and recommendations for establishing initial targets with this limited historic data, and it set initial targets for Massachusetts equal to CY 2021 baseline values.12
Table 4-30 shows MassDOT’s CY 2021 baselines and two-year and four-year targets for these measures. The Boston Region MPO was required to establish four-year targets for these measures by either supporting state targets or setting its own quantitative targets for the Boston region. In 2023, the MPO board voted to support the state’s four-year targets. As noted in previous sections, MassDOT owns and manages the Interstate network in Massachusetts and implements strategies to improve its performance. As with the roadway safety performance targets previously discussed, this approach reflects the way MassDOT and the MPO will need to collaborate to make and keep the non-interstate NHS in the region reliable. Relevant strategies may include designing and funding roadway infrastructure improvements and supporting signal retiming, which are the purview of both the MPO and MassDOT. Others include regulating vehicle volumes using approaches such as ramp metering or managed lanes, which are MassDOT’s purview.
Table 4-30 also shows CY 2021 baselines for the Boston region’s Interstate and non-Interstate NHS networks for comparison. As the table shows, the Boston region’s share of reliable person-miles traveled on its Interstate and non-Interstate NHS networks was lower than statewide values for Massachusetts in 2021.
Table 4-30
Baseline Values and Targets for Travel Time Reliability
Network |
Measure |
2021 Measure |
Two-Year Target |
Four-Year Target |
Massachusetts—Interstate Highway System |
Percent of person-miles on the |
84.2% |
74.0% |
76.0% |
Massachusetts—Non-Interstate NHS System |
Percent of person-miles on the |
87.9% |
85.0% |
87.0% |
Boston Region—Interstate Highway System1 |
Percent of person-miles on the |
71.4% |
N/A2 |
N/A2 |
Boston Region—Non-Interstate NHS System1 |
Percent of person-miles on the |
81.7% |
N/A2 |
N/A2 |
Note: The two-year target reflects conditions as of the end of CY 2023, and the four-year target reflects conditions as of the end of CY 2025.
1 The baseline values for the Boston region that are shown in this table were calculated in 2022.
2 The N/A values indicate that the MPO adopted state, not regional targets.
CY = calendar year. MPO = metropolitan planning organization. N/A = not applicable. NHS = National Highway System.
Sources: National Performance Management Research Data Set, Cambridge Systematics, Massachusetts Department of Transportation, and the Boston Region MPO staff.
Actual travel time reliability values for the Interstate Highway System and the non-Interstate NHS in Massachusetts were better than the Commonwealth’s two-year and four-year targets, as shown in the following figures. Figures 4-6 and 4-7 show the change in the percent of person-miles on the Interstate Highway System and non-Interstate NHS, respectively, that were reliable for both Massachusetts and the Boston region between 2017 and 2022.
The share of reliable person-miles on the NHS network increased significantly in 2020 for both the Boston region and Massachusetts as a whole, primarily because of reduced travel in response to the COVID-19 pandemic, though the percentage of reliable person-miles decreased for both geographies in 2021 and 2022 as travel increased. As the region and the Commonwealth adjust to post-pandemic travel patterns and levels of demand, the MPO will work with the Commonwealth, municipalities, and other stakeholders to support reliable travel on the NHS and other roadways. The Commonwealth and MPO will adopt new targets and release new performance data in FFY 2027.
Figure 4-6
Performance Values and Targets for the Percent of Person-Miles that are Reliable on the Interstate Highway System

Note: The number of municipalities in the Boston Region MPO area decreased from 101 to 97 in 2018. This change may have affected 2017 values calculated using the RITIS platform in April 2022 as compared to baselines determined when targets were initially set in 2018.
MPO = metropolitan planning organization. RITIS = Regional Integrated Transportation Information System.
Sources: National Performance Management Research Data Set and the Boston Region MPO staff.
Figure 4-7
Performance Values and Targets for the Percent of Person-Miles that are Reliable on the Non-Interstate NHS

Note: The number of municipalities in the Boston Region MPO area decreased from 101 to 97 in 2018. This change may have affected 2017 values calculated using the RITIS platform in April 2022 as compared to baselines determined when targets were initially set in 2018.
MPO = metropolitan planning organization. NHS = National Highway System. RITIS = Regional Integrated Transportation Information System.
Sources: National Performance Management Research Data Set, Massachusetts Department of Transportation, and the Boston Region MPO staff.
FHWA requires states and MPOs to track truck travel time reliability on the Interstate System to better understand the performance of the nation’s freight system. The applicable measure in this case is the Truck Travel Time Reliability Index (TTTR). This measure compares longer (95th percentile) truck travel times to average (50th percentile) truck travel times. The greater the difference between these two travel times on an Interstate segment, the less reliable truck travel on that segment is considered to be.
For each Interstate segment, states and MPOs calculate TTTR values for different day-and-time periods and weight the segment length by the maximum applicable TTTR value.13 They then sum these weighted segment lengths for all Interstate segments and divide that total value by the length of the full Interstate network for the applicable geographic area. Like segment-specific TTTR values, the greater this aggregate value is, the more unreliable the network is with respect to truck travel.
In 2022, MassDOT calculated baseline TTTR Index values and established performance targets using CY 2021 truck travel-time data included in the NPMRDS. MassDOT staff considered past travel time reliability measure values, as well as uncertain future travel demand following the COVID-19 pandemic and related public and private sector responses, when setting its two-year and four-year targets. MPOs also are required to set four-year targets for this measure, and the Boston Region MPO board voted to support MassDOT’s two-year and four-year TTTR targets in January 2023.
As shown in Table 4-31, the Boston region’s TTTR baseline value is higher than the one for Massachusetts, indicating that truck travel times on the region’s Interstate highway network have been generally less reliable than on Massachusetts’s full Interstate network.
Table 4-31
Baseline Values and Targets for Truck Travel Time Reliability
Network |
Measure |
2021 Measure |
Two-Year Target |
Four-Year Target |
Massachusetts—Interstate Highway System |
Truck Travel Time Reliability Index |
1.61 |
1.80 |
1.75 |
Boston Region—Interstate Highway System1 |
Truck Travel Time Reliability Index |
2.03 |
N/A2 |
N/A2 |
Note: The two-year target reflects conditions as of the end of CY 2023, and the four-year target reflects conditions as of the end of CY 2025.
1 The baseline values for the Boston region that are shown in this table were calculated in 2022.
2 The N/A values indicate that the MPO adopted state, not regional targets.
CY = calendar year. MPO = metropolitan planning organization. N/A = not applicable. RITIS = Regional Integrated Transportation Information System.
Sources: National Performance Management Research Data Set, RITIS, the Massachusetts Department of Transportation, and the Boston Region MPO staff.
TTTR Index values for the Interstate Highway System in Massachusetts were better than the Commonwealth’s two-year and four-year targets between 2017 and 2022, as shown in Figure 4-8. TTTR values improved for both Massachusetts and the Boston region in 2020, although reliability worsened for both geographies in 2021 and 2022. Performance monitoring will enable the Commonwealth, the MPO, and other stakeholders to respond to post-pandemic changes in truck travel time reliability. The Commonwealth and MPO will adopt new targets and release new performance data in FFY 2027.
Figure 4-8
Performance Values and Targets for Truck Travel Time Reliability on the Interstate Highway System

Note: The number of municipalities in the Boston Region MPO area decreased from 101 to 97 in 2018. This change may have affected 2017 values calculated using the RITIS platform in April 2022 as compared to baselines determined when targets were initially set in 2018.
MPO = metropolitan planning organization. RITIS = Regional Integrated Transportation Information System.
Sources: National Performance Management Research Data Set, Massachusetts Department of Transportation, and the Boston Region MPO staff.
The MPO seeks to make investments that help manage capacity on the transportation network and improve mobility options for travelers in a variety of ways, including the following:
When prioritizing projects for funding with Regional Target dollars, the MPO uses evaluation criteria to assess how well each project expands transportation options and mode choice and how it supports mobility. These sets of criteria include items that award points to projects that enhance bicycle and pedestrian accommodations and connections to transit, and that support truck movement. The MPO’s criteria prior to October 2020 granted points to projects that reduced vehicle congestion and delay for transit vehicles. In October 2020, the MPO adopted an updated set of project selection criteria that
The MPO’s Community Connections investment program, which funds first- and last-mile solutions, community transportation, and other related projects, has its own set of evaluation criteria. These criteria focus on connectivity to transit and key destinations and supporting shifts in travel to non-SOV modes.
By electing to support the Commonwealth’s targets for federally required reliability measures and agreeing to the Boston MA-NH UZA targets for the federally required annual hours of peak hour excessive delay (PHED) per capita and non-SOV travel measures, the MPO agrees to plan and program projects so that they contribute to achieving those targets. It can be challenging to anticipate how transportation projects may affect these performance measures, as they track outcomes that are not only affected by transportation investments but also traveler choices and demand, among other factors.
Table 4-32 summarizes these metrics and expected results for Regional Target-funded corridor, intersection, bicycle and pedestrian, and Community Connections projects. MPO staff developed estimated values for these metrics using available data from functional design reports and other materials provided by project proponents; results from the MPO’s TIP evaluations; NPMRDS data available in the RITIS platform; and other sources. These estimates aggregate changes in vehicle hours of delay using project-level information on vehicle volumes and changes in delay times at intersections from project improvements.
Table 4-32
Regional Target Projects: Freight and Travel Time Performance Metrics
Metric |
Value |
The project addresses an unreliable corridor with significant travel time delay |
3 projects |
The project improves travel time reliability by investing in measures that reduce dependence on single-occupancy-vehicle trips |
19 projects |
Projects near to or on a primary thoroughfare for regional freight travel |
8 projects |
Source: Boston Region MPO staff.
MassDOT, MBTA, and RTA projects, which are described in Chapter 3, also address capacity management and mobility in the Boston region and may also support improvements on federally required reliability, congestion, and non-SOV travel performance measures.
Transit agencies must update performance targets for federally required TAM performance measures. These targets relate to transit rolling stock, nonrevenue service vehicles, facilities, and rail fixed-guideway infrastructure. They are developed based on the agencies’ most recent asset inventories and condition assessments, and capital investment and procurement expectations, which are informed by the agencies’ TAM plans. MBTA, MWRTA, and CATA share their asset inventory and condition data and their performance targets with the Boston Region MPO so that the MPO can monitor and set TAM targets for the Boston region. The MPO revisits its targets in these performance areas each year when updating its TIP.
The following sections discuss the MPO’s current performance targets for each of the TAM performance measures. They reflect fiscal year (FY) 2025 targets: the MBTA’s targets are for SFY 2025 and CATA’s and MWRTA’s targets are for FFY 2025. The MPO adopted these targets on March 6, 2025. When compared to FY 2024 performance, the FY 2025 TAM targets described in Tables 4-33, 4-34, 4-36, and 4-37 may reflect changes in the overall number of assets in each transit category, past or planned asset replacement or repair, other factors depending on the asset type, or a combination of these factors.
FTA’s TAM performance measure for evaluating whether rolling stock and equipment vehicles are in a state of good repair is the percentage of vehicles that meet or exceed their useful life benchmark (ULB). This measure uses vehicle age as a proxy for its state of good repair, and the goal is to bring this value as close to zero as possible. FTA defines ULB as “the expected lifecycle of a capital asset for a particular transit provider’s operating environment, or the acceptable period of use in service for a particular transit provider’s operating environment.”14
For its FY 2025 targets, the MBTA used FTA default ULBs for all vehicle types except for paratransit autos and vans, and some articulated buses, which are measured using MBTA-defined ULBs. The MWRTA uses FTA default ULBs for vans and equipment vehicles (excluding automobiles) and ULBs from MassDOT’s Fully Accessible Vehicle Guide for its cutaway vehicles and automobiles.15 CATA uses useful life criteria as defined in FTA Circular 5010.1F for ULB values for its vehicles.16
Table 4-33 describes past performance and the MPO’s FY 2025 targets for rolling stock. The MBTA, CATA, and MWRTA are improving performance for a variety of rolling-stock-vehicle classes. Transit agencies can make improvements on this measure by expanding their rolling-stock fleets or replacing vehicles within those fleets.
Table 4-33
FY 2024 Performance and FY 2025 Targets for Transit Rolling Stock
|
|
FY 2024 Performance |
FY 2025 Targets |
Agency |
Asset Type |
Percent of Vehicles |
Target Percent of Vehicles |
MBTA |
Articulated Buses |
21% |
21% |
MBTA |
Buses |
16% |
16% |
MBTA |
Light Rail Vehicles |
39% |
39% |
MBTA |
Vintage Trolleys |
100% |
100% |
MBTA |
Heavy Rail Vehicles |
29% |
46% |
MBTA |
Commuter Rail Locomotives |
22% |
22% |
MBTA |
Commuter Rail Coaches |
8% |
7% |
MBTA |
Ferry Boats |
0% |
0% |
MBTA |
Paratransit Automobiles |
0% |
27% |
MBTA |
Paratransit Vans |
25% |
25% |
CATA |
Buses |
19% |
18% |
CATA |
Cutaway Vehicles |
65% |
0% |
MWRTA |
Automobiles |
100% |
100% |
MWRTA |
Cutaway Vehicles |
27% |
29% |
MWRTA |
Vans |
0% |
0% |
Note: CATA and MWRTA follow the federal fiscal year of October 1 to September 30. MBTA figures follow the state fiscal year of July 1 to June 30.
CATA = Cape Ann Transportation Authority. FY = fiscal year. MBTA = Massachusetts Bay Transportation Authority. MWRTA = MetroWest Regional Transit Authority. NTD = National Transit Database. ULB = Useful Life Benchmark.
Source: CATA, MBTA, MWRTA, and Boston Region MPO staff.
The MBTA continues to implement several major revenue-vehicle capital programs in FY 2025, including the ongoing replacement and modernization of the Red and Orange Line heavy rail fleets. CATA improved its cutaway vehicle fleet by adding new vehicles that had been delayed due to supply chain issues. Additionally, the MPO has programmed funds for CATA bus replacements as well as funds for MWRTA to purchase two buses for use where cutaway vehicles are currently used.
Table 4-34 shows FY 2024 performance and the MPO’s FY 2025 targets for transit equipment vehicles. Transit agencies can make progress toward these targets by expanding their fleets or replacing vehicles within those fleets. The MBTA and MWRTA continue to monitor equipment vehicle needs across the system by investing in the maintenance and replacement of nonrevenue equipment. CATA has set an improved target of 25 percent of equipment vehicles exceeding ULB, due to expected acquisitions of vehicles in FFY 2025.
Table 4-34
FY 2024 Performance and FY 2025 Targets for Equipment (Nonrevenue Vehicles)
|
|
FY 2024 Performance |
FY 2025 Targets |
Agency |
Asset Type |
Percent of Vehicles |
Target Percent of Vehicles |
MBTA |
All Equipment |
25% |
22% |
CATA |
All Equipment |
100% |
25% |
MWRTA |
All Equipment |
40% |
40% |
Note: CATA and MWRTA follow the federal fiscal year of October 1 to September 30. MBTA figures follow the state fiscal year of July 1 to June 30.
CATA = Cape Ann Transportation Authority. FY = Fiscal year. MBTA = Massachusetts Bay Transportation Authority. MWRTA = MetroWest Regional Transit Authority. ULB = Useful Life Benchmark.
Source: CATA, MBTA, MWRTA, and Boston Region MPO staff.
FTA assesses the condition of passenger stations, parking facilities, and administrative and maintenance facilities to determine if they are in a state of good repair by using the FTA Transit Economic Requirements Model (TERM) scale, which generates a composite score based on assessments of facility components. Facilities with scores below three are considered to be in marginal or poor condition (though this score is not a measure of facility safety or operational performance). The goal is to bring the share of facilities that meet this criterion to zero. Infrastructure projects focused on individual systems may improve performance gradually, while more extensive facility improvement projects may have a more dramatic effect on a facility’s TERM scale score.
Table 4-35
FTA TERM Condition Assessment Scale
Rating |
Condition |
Description |
|
5 |
Excellent |
No visible defects |
|
4 |
Good |
Good condition, but no longer new |
|
3 |
Adequate |
Moderately deteriorated or defective but has not exceeded useful life |
|
2 |
Marginal |
Defective or deteriorated, in need of replacement |
|
1 |
Poor |
Critically damaged or in need of immediate repair |
|
FTA TERM = Federal Transit Administration’s Transit Economic Requirements Model.
Source: Federal Transit Administration.
Table 4-36 shows FY 2024 performance and the MPO’s FY 2025 targets for MBTA, CATA, and MWRTA facilities.
Table 4-36
FY 2024 Performance and FY 2025 Targets for Facilities
|
|
FY 2024 Performance |
FY 2025 Targets |
Agency |
Asset Type |
Percent of Facilities |
Target Percent of Facilities Rated Less Than 3.0 on the FTA’s TERM Scale |
MBTA |
Passenger/ |
3% |
3% |
MBTA |
Administrative/ Maintenance Facilities |
21% |
21% |
CATA |
Administrative/Maintenance Facilities |
0% |
0% |
MWRTA |
Administrative/Maintenance Facilities |
0% |
0% |
Note: CATA and MWRTA follow the federal fiscal year of October 1 to September 30. MBTA figures follow the state fiscal year of July 1 to June 30.
CATA = Cape Ann Transportation Authority. FTA TERM = Federal Transit Administration’s Transit Economic Requirements Model. FY = fiscal year. MBTA = Massachusetts Bay Transportation Authority. MWRTA = MetroWest Regional Transit Authority.
Source: CATA, MBTA, MWRTA, and Boston Region MPO staff.
The MBTA expects no change to its facility ratings in 2025, and so it set FY 2025 targets equivalent to its FY 2024 performance. However, per FTA guidance, given the large number of MBTA’s facility assets, MBTA facility inspections are completed on four-year cycles. Due to the four-year assessment cycle, recent capital investments that have significantly improved the condition of facility assessments may not yet be reflected in the condition assessment data for FY 2025.
Table 4-37 describes FY 2024 performance and FY 2025 targets for rail fixed-guideway condition. The MBTA is the only transit agency in the Boston region with this asset type. Rail fixed-guideway condition is measured by the percentage of track that is subject to performance or speed restrictions. Performance restrictions reflect the condition of track, signal, and other supporting systems, which the MBTA can improve through maintenance, upgrades, and replacement and renewal projects. The MBTA is pursuing an aggressive program, as mandated by FTA, to improve track condition and reduce performance restrictions across the transit system. The work on track improvements, which aims to improve long-term performance, has negatively impacted fixed-guideway performance during the past couple of years.
Table 4-37
FY 2024 Performance and FY 2025 MBTA Targets for Infrastructure (Fixed Guideway)
|
FY 2024 Performance |
FY 2025 Targets |
Asset Type |
Percent of Miles with Performance Restrictions |
Target Percent of Miles with Performance Restrictions |
Light Rail |
9.4% |
7.0% |
Heavy Rail |
17.8% |
13.0% |
Commuter Rail |
1.2% |
4.0% |
Note: For this performance measure, the term “miles” refers to “directional route miles,” which represents the miles managed and maintained by the MBTA with respect to each direction of travel (for example, northbound and southbound), and excludes nonrevenue tracks such as yards, turnarounds, and storage tracks. The baseline and target percentages represent the percentage of annual average revenue track miles with performance restrictions from the total revenue miles.
MBTA figures follow the state fiscal year of July 1 to June 30.
FY = Fiscal Year. MBTA = Massachusetts Bay Transportation Authority.
Source: MBTA and Boston Region MPO staff.
TIP Investments Supporting Transit System Asset Condition
Many types of transit investments may affect the TAM vehicle, facility, and fixed-guideway performance measures described in the previous section because these investments may either improve or replace assets already included in transit agency inventories, or because they may expand those inventories. These investments may improve assets gradually over time by upgrading specific asset subsystems, or they may generate more dramatic changes in performance by overhauling or replacing assets.
The FFYs 2026–30 TIP includes a variety of transit infrastructure improvement initiatives, funded both by the MPO’s Regional Targets and dollars that the MBTA, MWRTA, and CATA program in coordination with MassDOT. Many of the MBTA and CATA investments appear in the priority investment lists these agencies include in their TAM plans.
During FFYs 2026 to 2030, the MBTA will be investing in vehicles to replace or expand its fleets through its Vehicles program. These procurements will support more efficient, reliable, and sustainable operations and include the following:
Meanwhile, CATA plans to purchase four low-floor buses to replace those that have reached the end of their useful life. The MPO has programmed funds for MWRTA to acquire three new 29-foot buses to replace cutaway vehicles that have reached the end of their useful life. Expected purchases include compressed-natural-gas-powered vehicles and electric vehicles. MWRTA will also continue pursuing opportunities to migrate its fleet to fully electric vehicles. Collectively, these investments will help improve the condition of the fleets and make progress with respect to the TAM rolling stock performance measure.
While funding for equipment vehicles is not expressly part of the FFYs 2026–30 TIP, the MBTA continues to monitor needs for support vehicles across the system and invest in the maintenance and replacement of nonrevenue equipment. This includes the procurement of first response vehicles, service cars, service trucks, tow trucks, spot tampers, swing masters, crane cars, and other support vehicles. Meanwhile, CATA and MWRTA are continuously evaluating their service fleets, and CATA expects major improvements in FFY 2025.
Funding for MBTA facility improvements is not expressly part of the FFY 2026–30 TIP. In FFY 2025, the MPO programmed funding for accessibility improvements at Jackson Square Station and the Nubian Square bus facility. While CATA’s and MWRTA’s administration and maintenance facilities are currently in a state of good repair, these agencies will continue to maintain and upgrade those facilities during FFYs 2026 to 2030. And while both facilities have scored 3.0 or above on the FTA TERM scale for several years, the MPO programmed funds for facility modernization at both CATA and MWRTA facilities in FFY 2025.
The MBTA is making continued investments in track signals and systems during FFYs 2026 to 2030 to help reduce the need for performance restrictions on fixed guideways. On track-related infrastructure, the MBTA is currently undergoing an aggressive plan to improve track segments on heavy and light rail systems that will likely extend into FFY 2026, and possibly beyond. Track segment improvements on heavy and light rail track will allow the MBTA to remove designated slow zone areas.
During the development of the FFYs 2026–30 TIP, the MPO formally solicited transit projects as candidates for funding. The MPO programmed funding for six transit projects in FFYs 2026, and continued to set aside funding for future application cycles with $5.5 million in FFY 2027, $6 million in FFY 2028, $6.5 million in FFY 2029, and $7 million in FFY 2030. The MPO will continue to work with MassDOT and the region’s transit agencies to support this transit program in order to
Table 4-38
TIP Projects Supporting Transit Asset Condition
Total |
Type |
Impact |
3 |
Rolling Stock |
Bus and van replacements, expansion of microtransit services |
n/a |
Equipment |
n/a |
3 |
Facilities |
Improve conditions and accessibility at bus stops, MWRTA vehicle hub facilities |
n/a |
Fixed Guideway Infrastructure |
n/a |
CATA = Cape Ann Transportation Authority. MWRTA = MetroWest Regional Transit Authority. TIP = Transportation Improvement Program.
Source: Boston Region MPO.
The MPO will continue to make investments to improve mobility and reliability of the transportation system. The MPO will coordinate with MassDOT, the MBTA, MWRTA, CATA, and other stakeholders on that process. This work may include the following activities:
The MPO’s access and connectivity goal includes providing transportation options and improving access to key destinations to support economic vitality and high quality of life. The MPO’s objectives in this area encompass providing people with access to jobs, affordable housing, essential services, and other key destinations. Accessibility also depends on providing transportation options, improving connectivity between modes and systems, and removing barriers to make it easy for people of all abilities to walk, bike, roll, use assistive mobility devices, or take transit.
Several different planning processes come together to address access and connectivity performance, issues, and needs. The MPO combines this planning work with ongoing system-level analyses that support its long-range planning. These analyses are documented in its LRTP Needs Assessment, which was last released in July 2023. MassDOT conducts its own analyses of access and connectivity performance and needs, which it documents in modal plans such as its Bicycle Transportation Plan, Pedestrian Transportation Plan, and MassDOT Performance Management Tracker tool.17 Meanwhile, the MBTA tracks and analyzes metrics and uses these to support planning processes, such as its current long-term investment plan Focus 40.18 The exchange and integration of these plans help agencies in the Boston region coordinate to improve access and connectivity across modes.
Several federally required performance measures are related to access and connectivity, and those are discussed in the sections of this chapter on Mobility and Reliability Performance and Clean Air and Healthy Communities Performance. However, in the LRTP Needs Assessment the MPO published several measures more directly related to access and connectivity.
The Needs Assessment includes a range of access and connectivity analyses focused on the availability of accessible transit, frequent transit, car share, bike share, and bicycle infrastructure, and travel patterns of transportation network companies (TNC) provided by companies such as Lyft and Uber. Additionally, the Needs Assessment’s Access and Connectivity chapter features a Destination Access and Transportation Cost Analysis tool, which compares travel time, costs, and accessibility of types of locations in the region.
Many types of investments affect access and connectivity in the region. The TIP’s Community Connections program invests in projects that connect residents to key destinations and transit transfer points. Similarly, projects in the Active Mobility Transportation program close gaps in the transportation network for those walking, biking, and rolling. Table 4-39 summarizes projects by the objectives of the MPO’s access and connectivity goal.
Table 4-39
Regional Target Projects: Access and Connectivity Performance Metrics
Metric |
Value |
Projects that improve multi-modal access to jobs, affordable housing, and other key destinations |
17 projects |
Projects that support the Commonwealth’s goals for housing production, land use, and economic growth |
9 projects |
Projects that increase people’s access to transit, biking, walking, and other non-single-occupancy-vehicle transportation options |
30 projects |
Projects that improve access to high-quality, frequent transportation options that enable people in disadvantaged communities to easily get where they want to go |
7 projects |
Projects that close gaps in walking, biking, and transit networks |
24 projects |
Project that remove barriers to make it easy for people of all abilities to use the transportation system, regardless of whether they walk, bike, roll, or use assistive mobility devices |
8 projects |
Source: Boston Region MPO staff.
The MPO will continue to work with MassDOT, the MBTA, the region’s RTAs, other transit service providers, and other stakeholders in the region to improve access and connectivity performance. These activities may include the following:
The MPO aims to support clean air and healthy communities in the Boston region by creating an environmentally friendly transportation system. It pursues this goal by investing in projects that reduce greenhouse gases (GHGs) and other pollutants generated by the transportation sector and minimizing negative environmental impacts from the system.
The MPO recognizes that GHG emissions contribute to climate change. If climate change trends continue as projected, the conditions in the Boston region will include a rise in sea level coupled with storm-induced flooding and warmer temperatures that would affect the region’s infrastructure, economy, human health, and natural resources. The Commonwealth of Massachusetts is responding to this challenge by taking action to reduce the GHGs produced in the state, including those generated by the transportation sector. In accordance with a Final Rule published in December 2023, MassDOT adopted a four-year GHG Emissions target that aims to reduce carbon dioxide (CO2) on the NHS in Massachusetts. MassDOT’s GHG emissions reduction target is shown in Table 4-40.
Massachusetts passed its Global Warming Solutions Act (GWSA), which requires reductions of GHGs by 2020 and further reductions by 2050, relative to 1990 baseline conditions. To meet GWSA requirements, the MPO works with MassDOT and other stakeholders to anticipate the GHG impacts of projects included in the TIP, specifically by examining additions or reductions in CO2. More details on the MPO’s GHG tracking and evaluation processes are included in Appendix B.
Table 4-40
Statewide Baseline Value and Targets for GHG Emissions Reductions of CO2 on the NHS
Performance Measure |
CY 2022 Measure Value (Baseline) |
Four-Year Target |
Percent reduction in CO2 emissions on the NHS |
0 |
7.9 |
CY = calendar year. CO2 = carbon dioxide. GHG = greenhouse gas emissions. NHS = National Highway System
Source: MassDOT.
In addition to supporting reductions in CO2, transportation projects may also help reduce other air pollutants and precursors, volatile organic compounds (VOCs), nitrogen oxides (NOx) and carbon monoxide (CO), by improving traffic flow and bicycle and pedestrian travel. More detailed information about the MPO’s air quality status and related requirements is available in Chapter 5.
The MPO tracks the air quality benefits of transportation projects to identify projects that may be eligible for CMAQ funds. These CMAQ-funded projects are described in the MPO’s CMAQ Performance plans and progress reports; these documents include performance targets for the annual PHED per capita and share of non-SOV travel measures described previously, along with targets for the amount of applicable emissions the MPO expects will be reduced because of CMAQ-funded projects in air quality nonattainment or maintenance areas in the region. The MPO must note how it expects its CMAQ-funded projects to support improvements with respect to relevant performance measures, which reinforces the connection between planning, investments, and expected performance outcomes.
The federally required CMAQ emissions reduction measure, identified in Table 4-41, is the total emissions reduction for applicable pollutants and precursors for CMAQ-funded projects in locations designated as nonattainment or maintenanceareas because they do not meet the US Environmental Protection Agency (EPA) standards for criteria air pollutants and precursors from mobile sources.19
The FHWA required states and MPOs to establish a baseline value for this measure by identifying the emissions reductions for applicable pollutants and precursors that were associated with CMAQ-funded projects obligated for funding in nonattainment or maintenance areas between FFYs 2018 and 2021. The Boston Region MPO and MassDOT did not program any CMAQ-funded projects in maintenance or nonattainment areas in the TIP and State Transportation Improvement Program (STIP), respectively, between FFYs 2018 and 2021. As a result, the baseline amount of carbon monoxide reduced by CMAQ-funded projects in this limited maintenance area during this period is zero kilograms per day.
As part of the CMAQ Performance Plan for the second federal performance period of FFY 2022 to 2025, MPO staff set targets by identifying projects that would be partially or fully funded with CMAQ dollars and that were expected to be obligated between FFYs 2022 and 2025. MPO staff identified one project that met these criteria: the NewMo Microtransit Service Expansion Project, which is funded through the MPO’s Community Connections program.
NewMo used on-demand, dynamically routed microtransit technology to serve seniors, low-income riders, and people with disabilities in Newton. The City of Newton’s first application to the Community Connections program focused on building on an existing microtransit service for seniors to provide shared first- and last-mile rides between the Wells Avenue Business District and three MBTA lines (including access to the Needham Heights commuter rail station in Needham), before expanding citywide. The MPO board adopted a value of 0.354 kilograms of carbon monoxide reduced per day for both its two-year and four-year emissions reduction target, as shown in Table 4-41.
NewMo service was provided during FFYs 2022 and 2023. Based on a formula with factors for ridership of NewMo vehicles, carbon monoxide emissions were reduced by 0.053 kilograms per day during FFYs 2022 and 2023. While ridership fell below the estimates made before the program’s implementation, the program’s addition of electric vehicles in FFY 2023 resulted in greater reductions in carbon monoxide than were projected based on the use of hybrid vehicles. NewMo shuttle service ended in July 2024.
Table 4-41
Emissions Reduction Values and Targets from CMAQ Projects in the Boston Region
Performance Measure |
FFYs 2018–21 Measure Value (Baseline) |
Two-Year Target |
Two-Year Value (FFYs 2022–23) |
Four-Year Target |
Daily kilograms of carbon monoxide emissions reduction from CMAQ projects in Boston region nonattainment or maintenance areas |
0 |
0.354 |
0.053 |
0.354 |
CMAQ = Congestion Mitigation and Air Quality Improvement. FFY = federal fiscal year.
Source: Boston Region MPO staff.
MassDOT and the Boston Region MPO examine mobility using measures they must monitor to meet CMAQ requirements. These measures are designed to help FHWA, states, and MPOs better understand the impacts of CMAQ investments, which are intended to contribute to air quality improvements and provide congestion relief. CMAQ performance measures related to traffic congestion apply to urbanized areas (UZAs) that contain geographic areas designated by the EPA as nonattainment areas. The measures also apply to designated maintenance areas that have a history of being in nonattainment and, thus, are required to maintain air quality monitoring and standard conformity processes.
States must be involved in setting targets for CMAQ traffic performance measures if (1) they have mainline highways on the NHS that cross part of a UZA with a population of more than one million; and (2) that UZA contains part of a nonattainment or maintenance area for relevant criteria pollutants. Similarly, MPOs must participate in target setting for the traffic congestion measures if (1) the region contains mainline highways on the NHS that cross part of a UZA with a population of more than one million; and (2) the part of the MPO area that overlaps the UZA contains part of a nonattainment or maintenance area for relevant criteria pollutants. Massachusetts and the Boston Region MPO each meet these respective criteria and, therefore, must be involved in monitoring and setting targets for traffic congestion performance measures for the Boston MA-NH UZA, which encompasses several MPO areas in eastern Massachusetts and New Hampshire. Agencies that are responsible for these traffic congestion measures set two-year and four-year targets.
The first of these CMAQ traffic congestion measures is annual hours of peak hour excessive delay (PHED) per capita, which estimates the excessive delay experienced by a UZA’s population from travel on the NHS during peak periods. States and MPOs calculate this measure using several component metrics:
The PHED per capita measure is calculated at the Boston MA-NH UZA level by multiplying the hours of excessive delay during peak periods by the number of travelers during peak periods, and then dividing that total by the UZA population.
When proposing targets, MassDOT and NHDOT created projections for this measure with an initial trend line based on a five percent growth rate; this growth rate reflects half of the rate of increase in PHED per capita between 2018 and 2019 (prior to the COVID-19 pandemic). This five percent growth rate accounts for the fact that traffic had not yet returned to pre-pandemic levels. However, MassDOT and NH DOT acknowledge the large degree of uncertainty surrounding future demand for travel, including on the NHS. Travel activity for 2021, the most recent full year of data, is still heavily influenced by the pandemic and public and private sector responses, and the future growth rate of PHED per capita may be larger than anticipated.
Given the uncertainty in terms of travel demand, particularly in the near term, MassDOT and NH DOT proposed a target of 24 annual hours of PHED per capita for the end of CY 2023 and a target of 22 hours of PHED per capita for the end of CY 2025, which assumes that strategies and policies are implemented to mitigate growth in congestion during this four-year period. The Boston Region MPO board voted to adopt these targets in October 2022. Table 4-42 summarizes the proposed target values.
In 2024, MPO staff calculated PHED values for 2022, and the value was 14.8 hours per capita.
Table 4-42
Baseline Value and Targets for Annual Hours of Peak Hour Excessive Delay Per Capita in the Boston MA-NH UZA
Geographic Area |
2021 Measure Value (Baseline) |
Two-Year Target |
One-Year Value (CY 2022) |
Four-Year Target |
|
Boston Urbanized Area |
18.0 |
24.0 |
14.8 |
22.0 |
|
CY = calendar year. MA = Massachusetts. NH = New Hampshire. UZA = urbanized area.
Sources: National Performance Management Research Data Set, US Census Bureau, Federal Highway Administration, the Massachusetts Department of Transportation, the New Hampshire Department of Transportation, Cambridge Systematics, and the Boston Region MPO staff.
States and MPOs that meet applicability criteria for CMAQ performance requirements must also monitor and set targets for the share of non-single-occupancy-vehicle travel. This measure is calculated at the UZA level. The percent of non-SOV travel performance measure describes the extent to which people are using alternatives to single-occupancy vehicles to travel and, thus, helping to reduce traffic congestion and air pollution from mobile sources. Non-SOV travel is measured as part of the American Community Survey in five-year period estimates, which are updated each year.
In 2018, MassDOT, NH DOT, the Boston Region MPO, and NMCOG (the Northern Middlesex MPO) worked collaboratively to set initial targets for 2019 and 2021 for this performance measure. This target-setting effort was conducted as the part of the CMAQ Performance Plan for the first performance period of 2018–21.
In 2022, MassDOT, NH DOT, and the MPOs submitted a report on the first performance period. In addition, the agencies submitted a CMAQ Performance Plan for the second performance period of 2022–25 and, as part of that effort, they set targets for 2023 and 2025.
In 2024, the Boston Region MPO submitted a mid-performance period report. During this analysis, it became evident that the COVID-19 pandemic had noticeable impacts on travel patterns beginning in 2020. Performance for 2021 and 2022 exceeded the levels of 2023 and 2025 targets for non-SOV travel. For this reason, in September 2024, the MPO board voted to adjust the 2025 target set in 2022. Table 4-43 shows all the initial and updated targets for the second performance period of 2022 to 2025. Figure 4-9 shows performance through 2022 and projections through 2025.
Table 4-43
Initial and Adjusted Targets for the Percent of Non-SOV Travel in the Boston MA-NH UZA, submitted September 2024
Geographic Area |
Baseline Value (CYs 2016–20 average) |
Initial Two-Year Target (CYs 2019–23 average) |
Initial Four-Year Target (CYs 2021–25 average) |
Adjusted Four-Year Target (CYs 2021-2025 average) |
Boston UZA |
36.9% |
38.8% |
39.8% |
42.6% |
Note: Values in this table reflect five-year rolling averages for the percent of non-SOV travel to work.
CY = calendar year. MA = Massachusetts. NH = New Hampshire. Non-SOV = non-single-occupancy vehicle. UZA = urbanized area.
Sources: US Census Bureau, American Community Survey Five-Year Estimates (Table DP03, “Selected Economic Characteristics”); the Massachusetts Department of Transportation; the New Hampshire Department of Transportation; and the Boston Region MPO staff.
Figure 4-9
Performance, Projections, and Initial Targets for the Percent of Non-SOV Travel in the Boston MA-NH UZA, submitted September 2024

MA = Massachusetts. NH = New Hampshire. Non-SOV = non-single-occupancy vehicle. UZA = urbanized area.
Source: Boston Region MPO.
The MPO uses evaluation criteria to assess the projected transportation-related emissions from each project that is a candidate for Regional Target funding, both for CO2 and other air quality pollutants and precursors, among other environmental considerations. Transportation projects can support reductions in CO2, VOCs, NOx, and CO by improving traffic flow and providing alternatives to SOV travel, including bicycle, walking, and transit options.
Table 4-44 displays the CO2 and other emissions reductions the MPO expects from projects it has programmed using its Regional Target funds. MPO staff estimates emissions for projects using MassDOT’s air quality analysis worksheets for each project type and the EPA’s Motor Vehicle Emission Simulator (MOVES) emission factors.
MPO staff-identified project-related metrics to determine how its Regional Target-funded roadway projects could improve the transportation system in ways that contribute to more reliable, less congested travel on the NHS or that encourage more non-SOV travel. The following project types are recognized:
Table 4-44
Regional Target Projects: Clean Air and Healthy Communities Performance Metrics
Metric |
Value |
Projects aimed at increasing non-SOV travel |
18 |
Projects aimed at reducing excessive congestion delays |
18 |
Projects aimed at emission reductions |
30 |
Annual kilograms of CO2 reduced |
6,962,385 kilograms
|
Annual kilograms of other emissions (VOCs, NOx, and CO) reduced |
8,478 kilograms |
CO = carbon monoxide. CO2 = carbon dioxide. NOx = nitrogen oxide. SOV = single-occupancy vehicle. VOC = volatile organic compounds.
Source: Boston Region MPO staff.
The Transit Transformation program began in FFY 2025 and includes projects that help reduce emissions by encouraging non-SOV travel or by changing the amount or type of energy these assets use. Similarly, future projects in the Community Connections program will encourage non-SOV travel and emissions reductions by addressing first- and last-mile needs.
MassDOT, MBTA, and RTA projects and programs also support improvements to air quality and the environment. For example, as described in Chapter 3, both the MBTA and MWRTA’s capital programs include capital investments in fleet electrification and electric-vehicle-charging facilities. Appendix B provides more detailed information and assessments of the GHG impacts of MassDOT, MBTA, CATA, and MWRTA projects and programs. MassDOT sets separate CMAQ emissions reduction performance targets and tracks the relationship between its projects and those targets.22
The GWSA and FHWA’s CMAQ performance management requirements create frameworks that reinforce coordination between the MPO, MassDOT, and the region’s transit providers as they make investments to support clean air and sustainable communities. Future performance activities in this area may include the following:
The MPO seeks to provide transportation that supports sustainable environments and enables communities in the region to adapt to, and withstand, the potential adverse impacts of severe weather events. There are several objectives that the MPO is working toward:
MAPC’s regional plan, MetroCommon 2050, helps shape environmental planning efforts in the region and informs the MPO’s approach to setting risk mitigation objectives. The plan aims to reduce environmental harm in communities impacted by environmental burdens, boost emergency response contingencies, and invest in critical systems and infrastructure, including transportation. Similarly, the Commonwealth has several initiatives, toolkits, and emergency preparedness guidelines for protecting vulnerable populations and infrastructure. More specific to transportation, MassDOT’s Flood Risk Assessment identifies flood exposure to the in-state NHS roads and bridges, rail lines, MassDOT facilities, and public airports.
In the LRTP Needs Assessment, the MPO published several measures on Resiliency. The Needs Assessment contains data on flood risk to key infrastructure in the transportation system, including critical facilities and MBTA catchment areas, and to communities with limited transportation access. Additionally, the Needs Assessment shows risks related to heat impacts. The report also shows a survey of municipal efforts from the Commonwealth's Municipal Vulnerability Preparedness (MVP) program. All of this information contributes to planning for short-term and long-term risks to the region’s transportation system.
When evaluating projects that are candidates for Regional Target funding, adaptation and mitigation are important considerations. Many TIP projects have adaptation and mitigation components, including the reconstruction of Argilla Road in Ipswich. Table 4-45 provides some highlights of how Regional Target-funded projects in this TIP address resiliency.
Table 4-45
Regional Target Projects: Resiliency Performance Metrics
Metric |
Value |
Projects that make infrastructure more resilient and responsive to current and future climate hazards |
15 projects |
Projects that invest in resiliency in vulnerable communities and areas that bear disproportionate climate and environmental burdens |
3 projects |
Projects that improve emergency access and evacuation routes |
6 projects |
Projects that use nature-based strategies to reduce runoff, negative impacts to water resources, open space, and environmentally sensitive areas |
12 projects |
Source: Boston Region MPO staff.
The MPO has several avenues for assessing and mitigating the risk posed by severe weather events to transportation assets. The MPO considers risk and adaptive capacity when assessing projects for the TIP’s investment programs—Complete Streets, Intersection Improvements, Major Infrastructure, and Transit Transformation. The ongoing MPO programs, including the Transportation Impact Mitigation Program and Community Transportation Access Program, move risk mitigation and adaptation efforts forward on a rolling basis. Additionally, the MPO plans to use studies to improve engagement on environmental planning and outreach, and study travel patterns in relation to flooding and emergencies.
Table 4-46 highlights some of the ways that the MPO’s FFYs 2026–30 Regional Target-funded projects support improved performance in the MPO’s various goal areas.
Table 4-46
FFYs 2026–30 TIP Target Program: Projects by the Numbers
| Total |
Type |
Impact |
|---|---|---|
58 |
Regional target projects |
Improve performance in MPO goal areas including safety, mobility, congestion, and bridge and pavement conditions |
5 |
New design projects |
Design funding sets up projects for future success in the construction planning phase |
6 |
Project areas that address locations of fatal and injury crashes |
Improved safety for people walking, biking, rolling, and driving |
62.4 |
Lane miles of substandard pavement improved |
Improve pavement condition |
4 |
Bridge structures |
Improve bridge conditions |
37 |
Projects that improve intermodal connections or access to transit |
Improve mobility for transit riders |
2 |
Projects that expand transit service |
Increase mobility for transit riders |
42.9 |
New lane miles to bike and shared use path network |
Improve mobility for people bicycling |
6 |
New bikeshare stations |
Increase mobility access |
25.7 |
New miles to sidewalk network |
Improve mobility for people walking |
17 |
Projects that improve multi-modal access to jobs, affordable housing, and other key destinations |
Increase access to economic opportunity |
18 |
Projects aimed at reducing excessive congestion delay |
Decrease congestion |
6.96 million kg |
CO2 reduced per year |
Improve air quality |
15 |
Projects that make infrastructure more resilient and responsive to current and future climate hazards |
Increase resiliency to climate hazards in vulnerable areas |
35 |
These projects will occur in 45 cities and towns |
Shared benefits throughout the region |
CO2 = carbon dioxide. kg = kilograms.
Source: Boston Region MPO staff.
The three key phases in the MPO’s PBPP process—planning, investing, and monitoring and evaluating—were discussed earlier in this chapter. Within this framework, the MPO’s TIP relates primarily to the first two phases, focusing on the relationship between the goals and objectives and performance requirements in the MPO’s planning framework and ways the MPO will invest its capital dollars in upcoming federal fiscal years. Other MPO activities relate more directly to the monitoring and evaluation phase of PBPP:
The Commonwealth and the region’s transit agencies also have reporting and evaluation responsibilities. MassDOT and the Commonwealth’s Executive Office of Public Safety and Security report roadway safety target information annually to FHWA and NHTSA. MassDOT reports other statewide performance targets and related information to FHWA on a biennial basis via FHWA’s Performance Management Form. The MBTA, MWRTA, and CATA must report their asset inventory and condition data to the FTA’s National Transit Database (NTD) and provide information about the progress that has been made with respect to performance measures and targets as compared to previous reports. These transit agencies also regularly report data about safety outcomes to the NTD. Their annual reviews of their PTASPs and safety targets also create opportunities for them to evaluate their performance.
Going forward, the MPO will incorporate the results of these reports and evaluations to use in its future planning and investment activities. These activities may include identifying new ways to bring information about performance into the MPO’s LRTP and TIP development processes, such as by updating project selection criteria or providing information through other means. This work would help the MPO develop scenarios to explore how various transportation investments made through the LRTP could support various goals and performance areas. Over time, activities like these will help ensure that the MPO’s investments are helping to meet its vision and goals for the region’s transportation system.
1 Urbanized areas are defined by the US Census Bureau to represent the urban cores of metropolitan areas. The Boston MA-NH-RI UZA includes the 97 municipalities in the Boston Region MPO area and includes portions of neighboring MPOs in eastern Massachusetts and New Hampshire.
2 MPO memoranda describing the Commonwealth’s safety targets from prior years are available at http://www.bostonmpo.org/performance-archive, accessed March 21, 2025.
3 Massachusetts Department of Transportation, Massachusetts Strategic Highway Safety Plan (2023), pg. I, accessed March 21, 2025.
https://www.mass.gov/doc/massachusetts-shsp-2023/download.
4 The Commonwealth of Massachusetts’ Bicycle and Pedestrian Update – 2021 is available at https://storymaps.arcgis.com/stories/446e35bc40614e5aaced4a62ff7343b2, accessed March 21, 2025.
5 The content of Table 4-6 is based on the project design information that was available to MPO staff when the FFYs 2026–30 TIP document was developed. Project extents and features may change as projects advance through the design development and review process.
6 For more information about the definitions of these performance measures—including deaths, injuries, or events that may be excluded from totals—see Boston Region MPO staff,
“Transit Safety Performance Requirements and Targets” (February 20, 2025). https://ctps.org/data/calendar/pdfs/2025/0220_MPO_Transit_Safety_Targets.pdf.
7 The Transportation Asset Management Plan is a federally required risk-based asset management plan that includes asset inventories, condition assessments, and investment strategies to improve the condition and performance of the NHS, particularly its bridges and pavements.
Massachusetts Department of Transportation, Transportation Asset Management Plan (Fall 2023), accessed March 21, 2025. https://www.mass.gov/doc/2023-transportation-asset-management-plan/download.
8 Massachusetts Department of Transportation, 2023 Massachusetts Freight Plan, accessed March 21, 2025. https://www.mass.gov/doc/2023-massachusetts-freight-plan/download.
9 Massachusetts Department of Transportation, “2024 Road Inventory Year End Report” March 2025.
10 MassDOT continues to measure pavement quality and to set statewide short-term and long-term targets in the MassDOT Performance Management Tracker using the Pavement Serviceability Index (PSI), which is a different index than IRI.
11 States and MPOs must calculate LOTTR values for four time periods: weekdays from 6:00 AM to 10:00 AM, weekdays from 10:00 AM to 4:00 PM, weekdays from 4:00 PM to 8:00 PM, and weekend days from 6:00 AM to 8:00 PM.
12 FHWA, “Frequently Asked Questions: Target Setting,” accessed March 21, 2025. www.fhwa.dot.gov/tpm/faq.cfm#targ.
13 States and MPOs must calculate TTTR Index values for five time periods: weekdays from 6:00 AM to 10:00 AM, weekdays from 10:00 AM to 4:00 PM, weekdays from 4:00 PM to 8:00 PM, weekend days from 6:00 AM to 8:00 PM, and all days from 8:00 PM to 6:00 AM.
14 Federal Transit Administration, “Performance Management” (March 2024), accessed March 21, 2025. http://www.transit.dot.gov/PerformanceManagement
15 Massachusetts Department of Transportation, MassDOT Fully Accessible Vehicle Guide: An Overview of Accessible Vehicle Specifications (September 2023), accessed March 21, 2025.
https://www.mass.gov/doc/massdot-fully-accessible-vehicle-guide-0/download
16 FTA, FTA Circular 5010.F “Award Management Requirements” (November 1, 2024), accessed March 21, 2025.
https://www.transit.dot.gov/sites/fta.dot.gov/files/2024-10/C5010.1F-Circular-11-01-2024_0.pdf
17 Massachusetts Department of Transportation, Tracker - Annual Performance Management Reports, accessed March 21, 2025. https://www.mass.gov/lists/tracker-annual-performance-management-reports.
18 The MBTA’s Focus40 plan is available at http://www.mbtafocus40.com.
19 A precursor is a chemical compound that reacts with other chemical compounds in the presence of solar radiation to form pollutants.
20 FHWA requires state DOTs and MPOs to use 60 percent of the posted speed limit for the segment or 20 miles per hour, whichever is greater, for the threshold speed.
21 FHWA requires states and MPOs to use the period from 6:00 AM to 10:00 AM to represent the morning peak period, but it allows these agencies to choose either 3:00 PM to 7:00 PM or 4:00 PM to 8:00 PM to represent the evening peak period. MassDOT and NH DOT selected the period from 3:00 PM to 7:00 PM to represent the evening peak period for the Boston MA-NH UZA.
22 An On-Road Mobile Source Emissions Reductions Report for Massachusetts is available at http://www.fhwa.dot.gov/tpm/reporting/state/emissions.cfm?state=Massachusetts.
This chapter documents the latest Transportation Improvement Program (TIP) air quality conformity determination for the 1997 Ozone National Ambient Air Quality Standards (NAAQS) and carbon monoxide (CO) NAAQS in the Boston Region Metropolitan Planning Organization (MPO) area. It covers the applicable conformity requirements according to the latest regulations, regional designation status, legal considerations, and federal guidance.
The 1990 Clean Air Act Amendments (CAAA) require MPOs within nonattainment and maintenance areas to perform air quality conformity determinations prior to the approval of Long-Range Transportation Plans (LRTPs) and TIPs, and at such other times as required by regulation. CAAA Section 176(c) (Title 42, United States Code [USC], Section 7506 [c]) requires that federally funded or approved highway and transit activities are consistent with (“conform to”) the purpose of the State Implementation Plan (SIP). Conformity to the purpose of the SIP means that Federal Highway Administration (FHWA) and Federal Transit Administration (FTA) funding and approvals are given to highway and transit activities that
The United States Environmental Protection Agency’s (EPA) transportation conformity rules establish the criteria and procedures for determining whether metropolitan transportation plans, TIPs, and federally supported highway and transit projects conform to the SIP (Title 40, Code of Federal Regulations [CFR], Parts 51.390 and 93).
A nonattainment area is one that the EPA has designated as not meeting certain air quality standards. A maintenance area is a nonattainment area that now meets the standards and has been redesignated as maintaining the standard. A conformity determination is a demonstration that plans, programs, and projects are consistent with the SIP for attaining the air quality standards. The CAAA requirement to perform a conformity determination ensures that federal approval and funding go to transportation activities that are consistent with air quality goals.
The Commonwealth of Massachusetts was previously classified as a nonattainment area for ozone and was divided into two nonattainment areas. The Eastern Massachusetts ozone nonattainment area included Barnstable, Bristol, Dukes, Essex, Middlesex, Nantucket, Norfolk, Plymouth, Suffolk, and Worcester counties. The Western Massachusetts ozone nonattainment area included Berkshire, Franklin, Hampden, and Hampshire counties. With these classifications, the 1990 CAAA required the Commonwealth to reduce its emissions of volatile organic compounds (VOCs) and nitrogen oxides (NOx), the two major precursors to ozone formation, to attain the ozone standard.
The 1970 Clean Air Act defined a one-hour NAAQS for ground-level ozone. The 1990 CAAA further classified degrees of nonattainment of the one-hour standard based on the severity of the monitored levels of the pollutant. The Commonwealth of Massachusetts was classified as being in serious nonattainment of the one-hour ozone standard and was required to achieve attainment by 1999. The attainment date was later extended, first to 2003, and a second time to 2007.
In 1997, the EPA proposed a new eight-hour ozone standard that replaced the one-hour standard, effective June 15, 2005. Scientific research showed that ozone could affect human health at lower levels and over longer exposure times than one hour. The new standard was challenged in court, and after a lengthy legal battle the courts upheld it. The new standard was finalized in June 2004. The new eight-hour standard is 0.08 parts per million (ppm) averaged over eight hours, and this level is not to be exceeded more than once per year. With this new standard, nonattainment areas were again further classified based on the severity of the eight-hour values. Massachusetts was classified as being in moderate nonattainment for the eight-hour standard and again was separated into two nonattainment areas—Eastern Massachusetts and Western Massachusetts.
In March 2008, the EPA published revisions to the eight-hour ozone NAAQS, establishing a level of 0.075 ppm (Volume 73, Federal Register [FR], page 16438; March 27, 2008). In 2009, EPA announced it would reconsider this standard because it fell outside of the range recommended by the Clean Air Scientific Advisory Committee. However, EPA did not take final action on the reconsideration, keeping the standard as 0.075 ppm.
After reviewing data from Massachusetts monitoring stations, the EPA sent a letter on December 16, 2011, proposing that only Dukes County be designated as a nonattainment area for the new proposed 0.075 ppm ozone standard. The Commonwealth of Massachusetts concurred with these findings.
On May 21, 2012, the final rule (77 FR 30088) was published in the Federal Register. This rule defined the 2008 NAAQS as 0.075 ppm, the standard that was promulgated in March 2008. A second rule (77 FR 30160) published on May 21, 2012, revoked the 1997 ozone NAAQS effective one year after the July 20, 2012, effective date of the 2008 NAAQS.
Also, on May 21, 2012, the Federal Register published the air quality designation areas for the 2008 NAAQS. Dukes County was the only area in Massachusetts designated as a nonattainment area. All other Massachusetts counties were designated as attainment/unclassifiable for the 2008 standard.
On March 6, 2015, the EPA published the final rulemaking, “Implementation of the 2008 National Ambient Air Quality Standards (NAAQS) for Ozone: State Implementation Plan Requirements; Final Rule” (80 FR 12264), effective April 6, 2015. This rulemaking confirmed the removal of transportation conformity to the 1997 ozone NAAQS and the replacement with the 2008 ozone NAAQS, which actually set a stricter level of allowable ozone concentration than the 1997 standards and designated Massachusetts (except for Dukes County) as attainment/unclassifiable.
However, on February 16, 2018, the United States Court of Appeals for the District of Columbia Circuit in South Coast Air Quality Management District v. EPA (“South Coast II,” 882 F.3d 1138) held that transportation conformity determinations must be made in areas that were designated either as nonattainment or maintenance areas for the 1997 ozone NAAQS and attainment for the 2008 ozone NAAQS when the 1997 ozone NAAQS was revoked.
On November 29, 2018, the EPA issued Transportation Conformity Guidance for the South Coast II Court Decision (EPA420-B-18-050, November 2018), which addressed how transportation conformity determinations could be made in these areas. According to the guidance, both Eastern and Western Massachusetts, along with several other areas across the country, were defined as orphan nonattainment areas—areas that were designated as nonattainment areas for the 1997 ozone NAAQS at the time of its revocation (80 FR 12264, March 6, 2015) and as attainment areas for the 2008 ozone NAAQS in EPA’s original designation rule for this NAAQS (77 FR 30160, May 21, 2012). As of February 16, 2019, conformity determinations are required in these areas.
After February 16, 2019, as a result of the court ruling and the subsequent federal guidance, transportation conformity for the 1997 NAAQS—intended as an anti-backsliding measure—now applies to both Massachusetts orphan areas. Therefore, a conformity determination was made for the 1997 ozone NAAQS in all of the Massachusetts MPOs’ FFYs 2024–50 LRTPs. The latest conformity determination was finalized in July 2023, following all of the MPOs’ endorsements of their LRTPs, and approved by the Massachusetts Divisions of FHWA and FTA on October 13, 2023. This conformity determination continues to be valid for the Boston Region MPO’s FFYs 2026–30 TIP, and Massachusetts’ 2025–29 State Transportation Improvement Program, as each is developed from the conforming FFYs 2024–50 LRTPs.
The transportation conformity regulation in 40 CFR § 93.109 sets forth the criteria and procedures for determining conformity. The conformity criteria for TIPs and LRTPs include a demonstration of fiscal constraint (§ 93.108), a basis on the latest planning assumptions (§ 93.110), use of the latest emissions model (§ 93.111), consultation (§ 93.112), provision for the timely implementation of transportation control measures (TCMs) (§ 93.113[b] and [c]), and consistency with an emissions budget and/or interim emissions tests (§ 93.118 and/or § 93.119).
For the 1997 ozone NAAQS areas, transportation conformity for TIPs and LRTPs for the 1997 ozone NAAQS can be demonstrated without a regional emissions analysis, per 40 CFR § 93.109(c). This provision states that the regional emissions analysis requirement applies one year after the effective date of the EPA’s nonattainment designation for a NAAQS and until the effective date of revocation of such NAAQS for an area. The 1997 ozone NAAQS revocation was effective on April 6, 2015, and the court for South Coast II upheld the revocation. As no regional emission analysis is required for this conformity determination, there is no requirement to use the latest emissions model, budget, or interim emissions tests.
Therefore, transportation conformity for the 1997 ozone NAAQS for the Boston Region MPO’s FFYs 2026–30 TIP can be demonstrated by showing that the remaining requirements in 40 CFR § 93.109 have been met. The following requirements regarding the use of the latest planning assumptions, consultation, timely implementation of TCMs, and fiscal constraint are defined in Section 2.4 of that guidance and addressed in the following sections.
The requirement to use the latest planning assumptions in 40 CFR § 93.110 generally applies to regional emissions analyses. In the areas subject to the 1997 ozone NAAQS, the requirement to use the latest planning assumptions applies to assumptions about TCMs in an approved SIP. (See the section titled Timely Implementation of Transportation Control Measures below).
The consultation requirements in 40 CFR § 93.112 for interagency consultation and public consultation were addressed. Interagency consultation was conducted with FHWA, FTA, EPA Region 1, the Massachusetts Department of Environmental Protection (DEP), and the other Massachusetts MPOs on March 6, 2019, when the latest conformity-related court rulings and resulting federal guidance was discussed. Regular and recurring interagency consultations have been held on (at least) an annual schedule. The most recent conformity consultation was held on March 13, 2023. Ongoing consultation is conducted in accordance with the following items:
Public consultation was conducted consistent with planning rule requirements in 23 CFR § 450. Title 23 CFR § 450.324 and 310 CMR 60.03(6)(h) requires that the development of the TIP, LRTP, and related certification documents provide an adequate opportunity for public review and comment. Section 450.316(b) also establishes the outline for MPOs’ public engagement programs.
The Boston Region MPO's current Public Engagement Plan was endorsed by the MPO board in October 2021 and amended in September 2022. The Public Engagement Plan ensures that the public will have access to the TIP and LRTP and all supporting documentation, provides for public notification of the availability of the TIP and LRTP and the public's right to review the document and comment thereon, and provides a 21-day public review and comment period prior to the adoption of the TIP and LRTP and related certification documents. The plan is available at https://www.bostonmpo.org/public-engagement.
The public comment period for this conformity determination will commence on or about April 21, 2025. During the 21-day public comment period, any comments received will be incorporated into this TIP. This process will allow sufficient opportunity for public comment and for the MPO board to review the draft document. The public comment period will close on or about May 12, 2025, and the Boston Region MPO is expected to endorse this air quality conformity determination on or about June 5, 2025. These procedures comply with the associated federal requirements.
Transportation control measures were required in the SIP in revisions submitted to EPA in 1979 and 1982. All of these TCMs have been accomplished through construction projects or through implementation of ongoing programs. All of the projects have been included in the Boston Region MPO's TIPs (present and past) as recommended projects or projects requiring further study. Information on the Green Line Extension to Somerville and Medford, which was completed in 2022, is as follows.
The Green Line Extension is a 4.7-mile light rail line, which extended the current Green Line service from a relocated Lechmere Station in East Cambridge to a terminus at College Avenue in Medford, with a spur to Union Square in Somerville. This project had a cost estimate of $2.289 billion. Funding came from a combined $1.99 billion in federal and state funds and pledged contributions totaling approximately $296 million from the Cities of Cambridge and Somerville ($75 million), the Boston Region MPO ($157.1 million), and MassDOT ($64.3 million through Special Obligation Bonds). Cambridge and Somerville were refunded their full $75 million in November 2021.
In early 2017, the MBTA initiated a procurement process for a design-build entity to design and construct the project. In November 2017, approval was received to execute a design-build contract with Green Line Extension contractors. The notice to proceed under the contract was issued in December 2017. The FTA obligated an initial portion ($100 million) of the Capital Investment Grant funds for the project in December 2017, under the 2015 Full Funding Grant Agreement. Additional funds followed. The contract with Green Line Extension contractors was in the amount of $999.7 million.
The primary goals of the project were to improve corridor mobility, boost transit ridership, improve regional air quality, ensure equitable distribution of transit services, and support opportunities for sustainable development in Cambridge, Somerville, and Medford. In addition to the light rail service on two new branches extending from Lechmere Station to Union Square Station and College Avenue Station, the project included the construction of a vehicle maintenance facility and a multi-use path.
By filing an Expanded Environmental Notification Form, procuring multiple design consultants, and publishing both Draft and Final Environmental Impact Reports, MassDOT met the first four interim milestones associated with the Green Line Extension project. Since those filings, MassDOT committed substantial resources to the Green Line Extension project, a top transportation priority of the Commonwealth and the largest expansion of the MBTA rapid transit system in decades. The project then transitioned from the planning and environmental review phases to the design, engineering, and construction phases, and the tasks associated with programming federal funding began.
The timeline for overall project completion, however, was substantially delayed. In the 2011 SIP Status Report, MassDOT reported that the Green Line Extension project would not meet the legal deadline for completion by December 31, 2014. The delay triggered the requirement to provide interim emission reduction offset projects and measures for the period of the delay (beginning January 1, 2015). Working with the Central Transportation Planning Staff, MassDOT and the MBTA calculated the value for reductions of non-methane hydrocarbons, carbon monoxide, and nitrogen oxides that would be equal to or greater than the reductions projected to result from the operation of the Green Line Extension during the period of the delay, as specified in the SIP regulation.
In June 2012, MassDOT released a list of potential mitigation ideas received from the public that could be used as offset measures. In the summer and fall of 2012, MassDOT elicited public comments on these potential measures. Then the MBTA created an internal working group to determine a final portfolio of interim mitigation measures for implementation by December 31, 2014, the legal deadline for the implementation of the Green Line Extension.
This work resulted in a recommendation to implement the following three interim mitigation measures, which collectively would meet the emissions reduction target for the project:
The Petition to Delay was submitted to the DEP on July 22, 2014, and expanded further on the analysis and determination of the interim offset measures. In a letter dated July 16, 2015, the DEP conditionally approved MassDOT's request to delay the Green Line Extension project and the implementation of the above interim mitigation measures. Both the 2014 Petition to Delay and the July 2015 Conditional Approval are available on MassDOT's website.
The Green Line Extension to Union Square opened for service on March 21, 2022, and the extension to Medford opened on December 12, 2022.
Transportation conformity requirements in 40 CFR § 93.108 state that TIPs and LRTPs must be fiscally constrained so as to be consistent with the United States Department of Transportation’s metropolitan planning regulations (23 CFR part 450). The Boston Region MPO’s FFYs 2026–30 TIP is consistent with the required fiscal constraints, as demonstrated in this document.
The requirement to perform a conformity determination for carbon monoxide for the city of Waltham has expired. On April 22, 2002, the EPA classified Waltham as being in attainment for CO emissions. Subsequently, an EPA-approved CO limited maintenance plan was set up through the Massachusetts SIP to ensure that emission levels did not increase. While the maintenance plan was in effect, past TIPs and LRTPs included an air quality conformity determination against a “budget test” (using “hot spot” analyses as needed at the project level) for Waltham. As of April 22, 2022, however, the 20-year maintenance period for this CO area expired and transportation conformity is no longer required for this pollutant in this municipality. This ruling is documented in a letter from EPA dated April 26, 2022.
In summary and based on the entire process described above, the Boston Region MPO has prepared this conformity determination for the 1997 ozone NAAQS in accordance with EPA’s and the Commonwealth of Massachusetts’ latest conformity regulations and guidance. This conformity determination process demonstrates that the FFYs 2026–30 TIP meets the Clean Air Act and Transportation Conformity Rule requirements for the 1997 ozone NAAQS and has been prepared following all the guidelines and requirements of these rules during this period.
Therefore, the implementation of the Boston Region MPO’s FFYs 2026–30 TIP is consistent with the air quality goals of, and in conformity with, the Massachusetts SIP.
The Boston Region Metropolitan Planning Organization (MPO) monitors how its transportation investments impact communities throughout the Boston region to ensure the MPO’s investments meet the needs of all residents. This chapter discusses the results of analyses that assess how benefits of MPO-funded projects are distributed throughout the region’s communities and their impact on Title VI populations. These analyses are guided by the goal of ensuring that all people have access to important destinations that increase quality of life and economic vitality.1
The MPO assesses the impacts of MPO-funded projects, as a group, on areas of priority transportation investment (PTI). These are census tracts where there has been underinvestment in the transportation system and where Title VI populations reside that are generally in need of transportation service. These census tracts are categorized into tracts of highest need (with five to six of these populations), moderate need (with three to four of these populations), and lower need (with one or two of these populations).
Analyses on PTI areas help the MPO to better understand the extent to which investments address local community needs, comply with Title VI, and meet the MPO’s goal of ensuring the region’s transportation system meets the needs of all residents. The analyses reported in this chapter include only MPO-funded projects and, in some cases, a subset of these projects (depending on data availability, as noted). Projects that are not included are as follows:
The impacts of projects funded by other entities were assessed independent of the MPO’s processes.
Figure 6-1 shows the PTI areas within census tracts in the Boston region. These areas include populations that are federally protected based on race, national origin, sex, age, disability, and income. (Data sources can be found at the end of the chapter.) [TO BE UPDATED]
Figure 6-1
PTI Areas in the Boston Region
Staff analyzed which PTI tracts are likely to be served or impacted by MPO-funded projects. Table 6-1 shows the number of PTI tracts and the population within the tracts in the Boston region.
Table 6-1
PTI Areas Served or Impacted by MPO-Funded Projects
PTI = priority transportation investment.
Note: People served or impacted may be double counted if they live in more than one project area.
Source: US Census Bureau.
Table 6-2 shows the number of PTI tracts likely to be served or impacted by MPO-funded projects, as well as the population within those tracts, compared to the total number of tracts and people served.
Table 6-2
Population in PTI Areas Served or Impacted by MPO-Funded Projects
Note: People served or impacted may be double counted if they live in more than one project area.
FFY = federal fiscal year. PTI = priority transportation investment. TIP = Transportation Improvement Program.
Source: US Census Bureau.
Figure 6-2 shows the percentage of PTI tracts and the population within these tracts likely to be served or impacted for each investment program. [TO BE UPDATED]
Figure 6-2
Population in PTI Tracts Served or Impacted by MPO-Funded Projects by Investment Program
PTI = priority transportation investment.
Note: People served or impacted may be double counted if they live in more than one project area.
Sources: US Census Bureau and Boston Region MPO.
Table 6-3 shows projected emissions reductions for PTI tracts and non-PTI tracts expected to result from MPO-funded projects in the TIP. Reductions are reported in kilograms per 1,000 people. Emissions—carbon monoxide, nitrogen oxide, and volatile organic compounds—reported in this table were calculated using Congestion Mitigation and Air Quality (CMAQ) spreadsheets. Note that not all MPO-funded projects were included in the analysis; only those for which CMAQ analyses could be conducted were included. Projects initiated by MassDOT and the MBTA, bikeshare projects, and project design support were excluded.
Table 6-3
Changes in Carbon Monoxide, Volatile Organic Compounds, and Nitrogen Oxides Emissions per 1,000 People
CO = carbon monoxide. FFY = federal fiscal year. N/A = not applicable. NOx = Nitrogen oxides. PTI = priority transportation investment. TIP = Transportation Improvement Program. VOC = volatile organic compounds.
Sources: US Census Bureau and Boston Region MPO’s Congestion Mitigation and Air Quality analyses.
Staff analyzed how MPO funds are distributed to projects serving PTI tracts based on the percentage of the population served or impacted by MPO-funded projects. The MPO has programmed approximately $710 million in MPO funds in the FFYs 2026–30 TIP, approximately $640 million of which was included in this analysis.2 Table 6-4 shows the percentage of funding allocated in the FFYs 2026–30 TIP to MPO-funded projects, in the aggregate, that are expected to serve or impact PTI areas compared to the entirety of the population served or impacted. [TO BE UPDATED]
Table 6-4
Percent of Funding Allocated to PTI Areas
PTI = priority transportation investment. TIP = Transportation Improvement Program.
Sources: US Census Bureau and Boston Region MPO.
Figure 6-3 shows the percentage of MPO funds allocated that are expected to serve or impact PTI areas, by investment program. These data are shown relative to the entirety of the population served or impacted. [TO BE UPDATED]
Figure 6-3
Percent of Funding Allocated to PTI Areas by Investment Program
PTI = priority transportation investment.
Sources: US Census Bureau and Boston Region MPO.
Staff used Conveyal, a destination access tool, to analyze the number of destinations people can reach within a given travel time and to analyze changes in travel times. The analyses were conducted on all MPO-funded projects in the TIP that would directly change travel speeds and/or the ability of a person to reach a destination. These projects include those that consist of one or more of the following improvements:
At this time, bikeshare expansion projects cannot be modeled. MPO staff continue to work on representing bikeshare projects in Conveyal. Staff also continue to expand their understanding of the impacts of various project elements on travel speeds so that more projects can be included in future analyses.
Figure 6-4 shows the change in access expected from the projects included in the FFYs 2026–30 TIP for the following metrics:
Results are based on current project design information—actual impacts may differ if designs change. Results show that [TO BE UPDATED]
Figure 6-4
Percent Change in Access to Jobs, Healthcare, and Parks and Open Space by Transit and Driving and Travel Times
These analyses show the locations of MPO-funded projects relative to Title VI populations. These analyses reflect the MPO’s compliance with Title VI requirements. Figure 6-5 is a map that shows the location of MPO-funded projects relative to Title VI populations. [TO BE UPDATED]
Figure 6-5
TIP Projects and Title VI Populations
Table 6-5 shows the percent of various Title VI populations likely served or impacted by MPO-funded projects in the FFYs 2026–30 TIP. [TO BE UPDATED]
Table 6-5
Percent of Title VI Populations Served or Impacted by MPO-Funded Projects
Table 6-6 shows the percentage of funding allocated to MPO-funded projects that likely serve or impact Title VI populations in the FFYs 2026–30 TIP. [TO BE UPDATED]
Table 6-6
Percent of Funding to Projects Serving or Impacting Title VI Populations
MPO staff will continue to explore more sophisticated methods of identifying specific impacts of MPO-funded projects and evaluating, as a group, their impacts, especially in PTI areas, with a focus on access to opportunities. The results of a recent study, Applying Conveyal to TIP Project Scoring, will allow staff to develop project evaluation criteria to assess how well projects provide access to various opportunities. This new methodology will give the MPO a better understanding of which projects could help with mitigation prior to the MPO finalizing TIP projects that are selected for funding.
The following demographic data sources were used in this chapter:
1 The analyses for this TIP were based on demographic data from the 2020 Decennial Census and the 2019–23 American Community Survey (ACS). Census block groups or tracts were the geographic unit of analysis. See the notes at the end of this chapter for a list of data sources that were used to conduct the analyses.
2 The funding distribution analyses in this section exclude the following projects:
MassDOT-initiated projects for which demographics were not available
Investment program funds reserved for later-year funding:
Community Connections Program
Transit Transformation Program
Bikeshare State-of-Good-Repair Set-Aside