MEMORANDUM
Date: January 12, 2012
To: Congestion Management Process Files
From: Seth Asante, Ryan Hicks, and Efi Pagitsas
MPO Staff
Re: Historical Trends: Travel Times and Vehicle Occupancy Levels for I-93 North and Southeast Expressway HOV and General-Purpose Lanes
This memorandum presents the historical trends of travel times and vehicle occupancy levels identified in an analysis performed as part of the MPO’s ongoing monitoring program of the I‑93 North and Southeast Expressway high-occupancy-vehicle (HOV) lanes.1The program is carried out in accordance with Massachusetts Department of Environmental Protection (DEP) regulation 310 CMR 7.37, which calls for samples of travel-time data from the HOV and general-purpose lanes to be collected and reported quarterly. The data are used to monitor compliance with a set threshold for the time savings afforded by the HOV lanes compared to travel in the general-purpose lanes. The DEP time-savings threshold was established at one minute per mile. The data are collected and reported on in the fall and spring, and are used to measure and compare the number of person-trips in the HOV and general-purpose lanes.
The results of the analysis are provided in the Summary.
The I-93 North HOV lane currently operates between 6:00 AM and 10:00 AM, Monday through Friday, and extends southbound 2.6 miles from a point 0.3 miles south of Exit 31 (Mystic Avenue) in Somerville to a point 0.2 miles south of the Route 1 merge on the Zakim Bridge over the Charles River.2
The Southeast Expressway northbound HOV lane currently operates between 6:00 AM and 10:00 AM. It extends northbound 5.5 miles from a point 0.24 miles north of the I‑93/Route 3 merge in Quincy to a point 0.9 miles south of the Columbia Road exit in Dorchester. The Southeast Expressway southbound HOV lane currently operates between 3:00 PM and 7:00 PM. Due to its contraflow design; it is identical in length and location to its northbound counterpart. A brief description of the historical background of both HOV lanes is provided in the appendix.
Since 2002, MPO staff has collected, on a quarterly basis, travel times in both the HOV lanes and general-purpose lanes over the course of each four-hour period of HOV lane operation, on non-holiday weekdays. The data-collecting drivers travel the routes at a speed that approximates the experience of the average driver at the time of data collection.
For the following facilities, travel-time data are collected between 6:00 and 10:00 AM:
For the following facilities, travel-time data are collected between 3:00 and 7:00 PM:
Given this mandatory travel time saving rate of one minute per mile and the length of the HOV facilities, the following minimum travel time savings should be achieved:
MPO staff also collects vehicle-occupancy data by lane. This effort takes place during the spring and fall and is carried out only for the AM hours of HOV lane operation. The vehicle‑occupancy counts are not conducted for the Southeast Expressway’s southbound HOV lane or for its general-purpose lanes during the PM hours of operation. For most vehicles smaller than a microbus, data collectors count persons, up to five. Since occupancy of large buses, microbuses, police, fire, and emergency-medical-services vehicles is hard to accurately count, data collectors simply tally the number of vehicles in each of these categories without counting passengers.
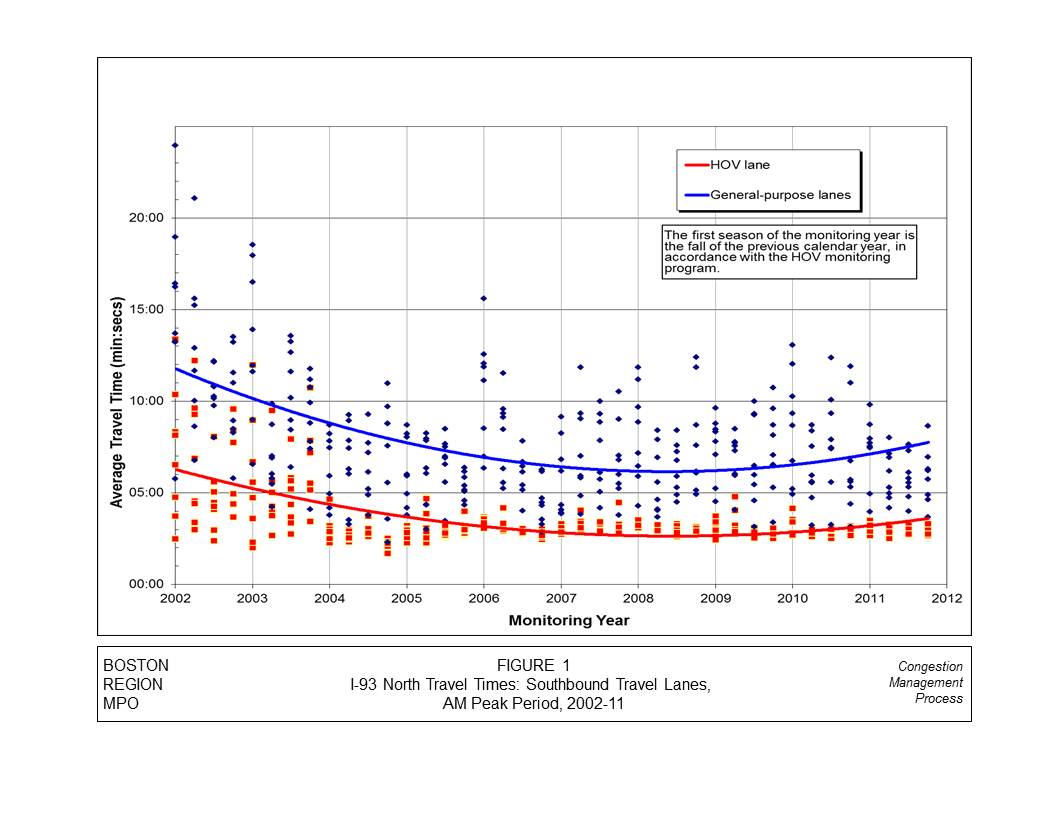
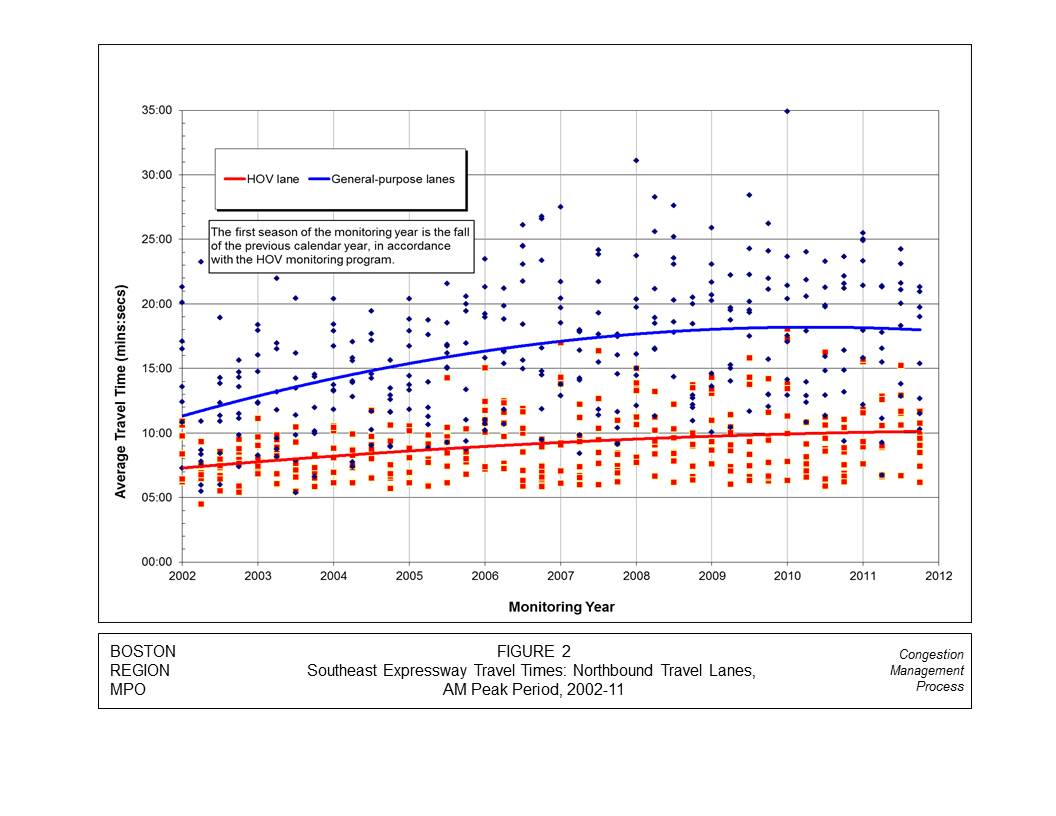
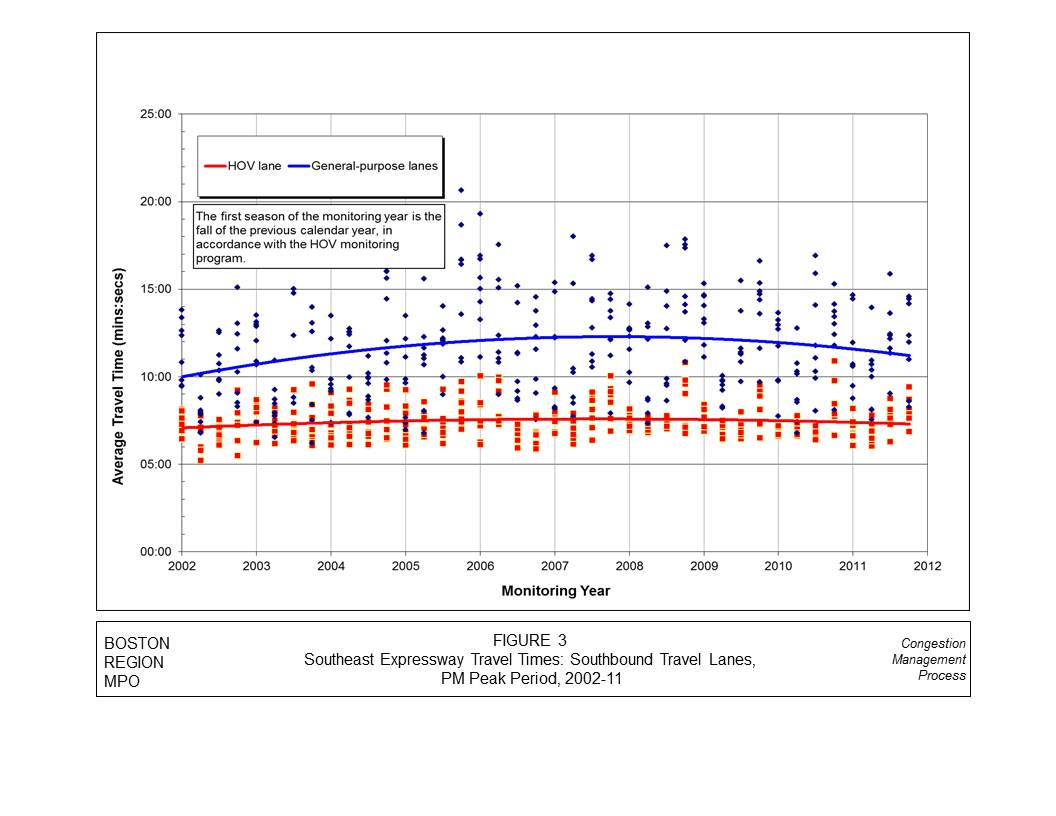
Figures 1, 2, and 3 present historical travel-time trends from 2002 to 2010 for HOV and general-purpose lanes on I-93 North and the Southeast Expressway. In each of these figures, average travel times for each 30-minute monitoring interval were plotted successively for each season from 2002 to 2011. The first season of each monitoring year is the fall, in accordance with the MPO’s HOV monitoring program.3 There are eight data points per season for each facility, each of which represents the average travel time for a 30-minute monitoring interval between 6:00 AM and 10:00 AM or between 3:00 PM and 7:00 PM. The data points were then fitted to polynomial curves: one for the HOV lane and one for the general-purpose lanes. Polynomial curves were used because they are the best fit for the travel-time patterns of the HOV and general lanes.
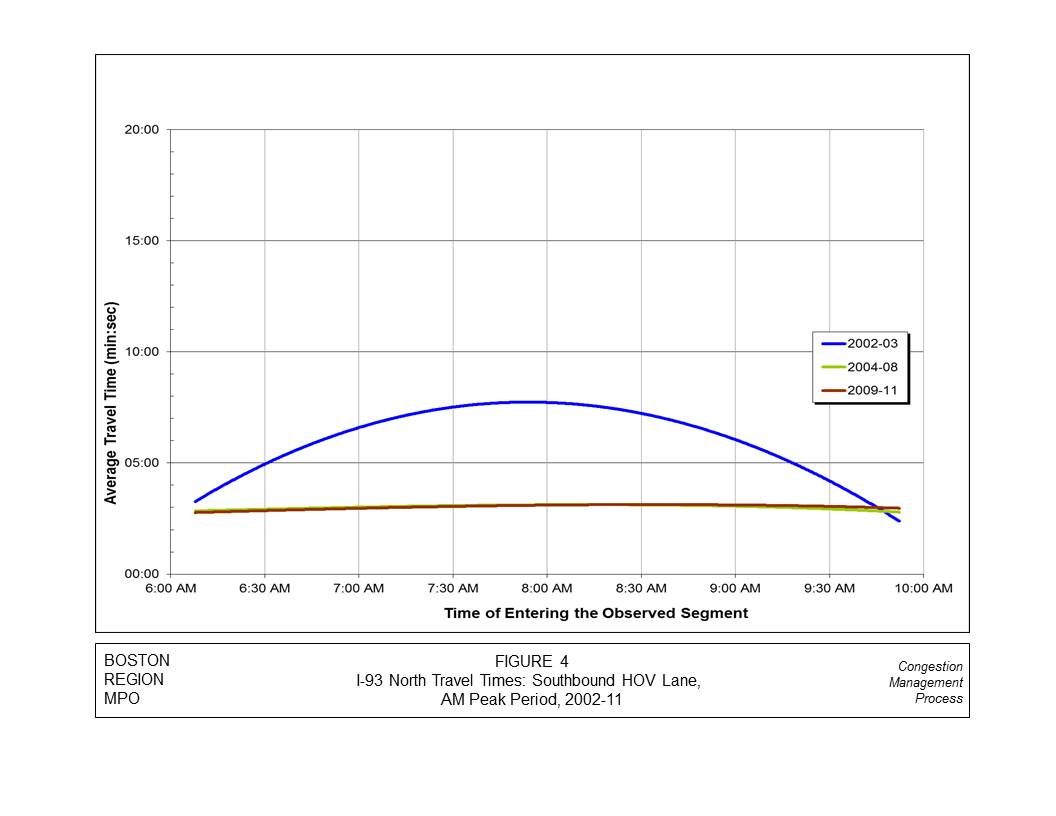
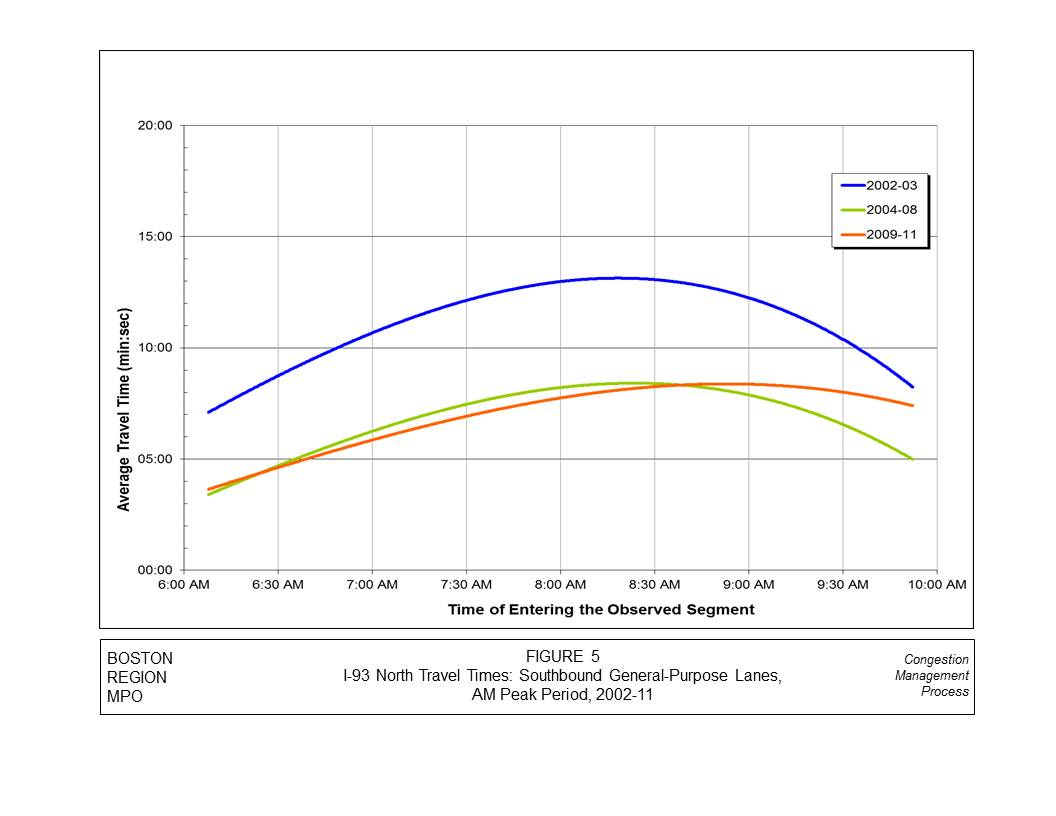
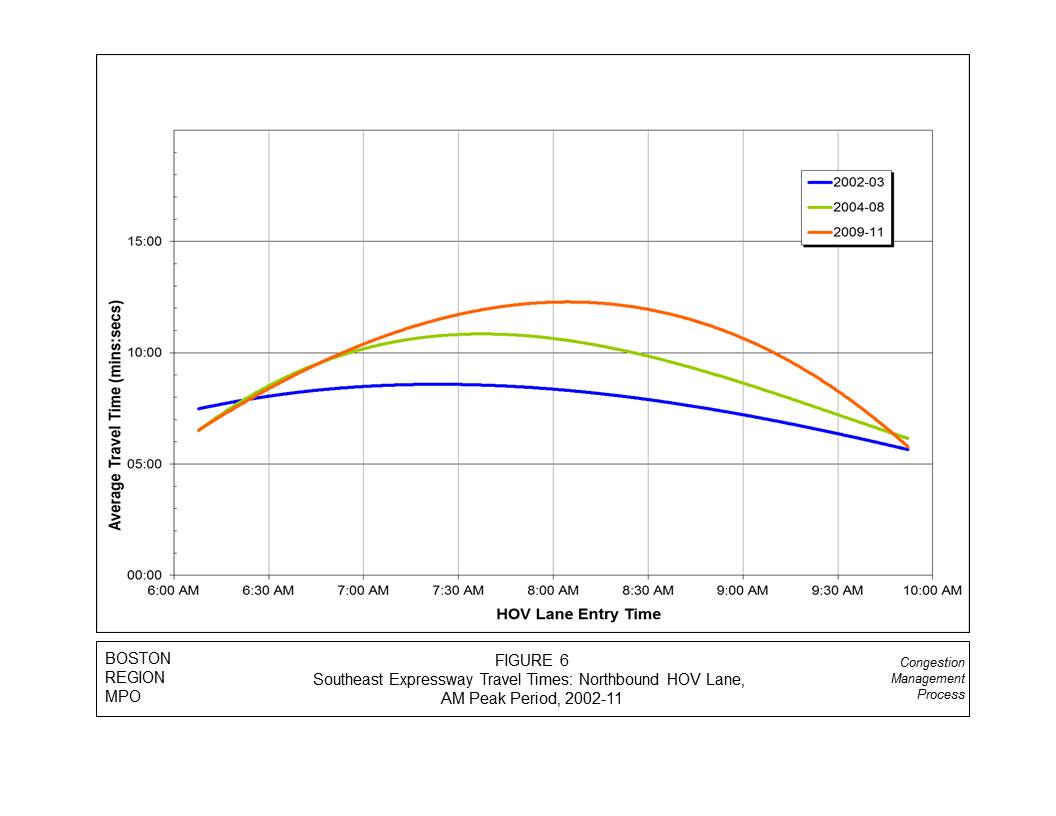
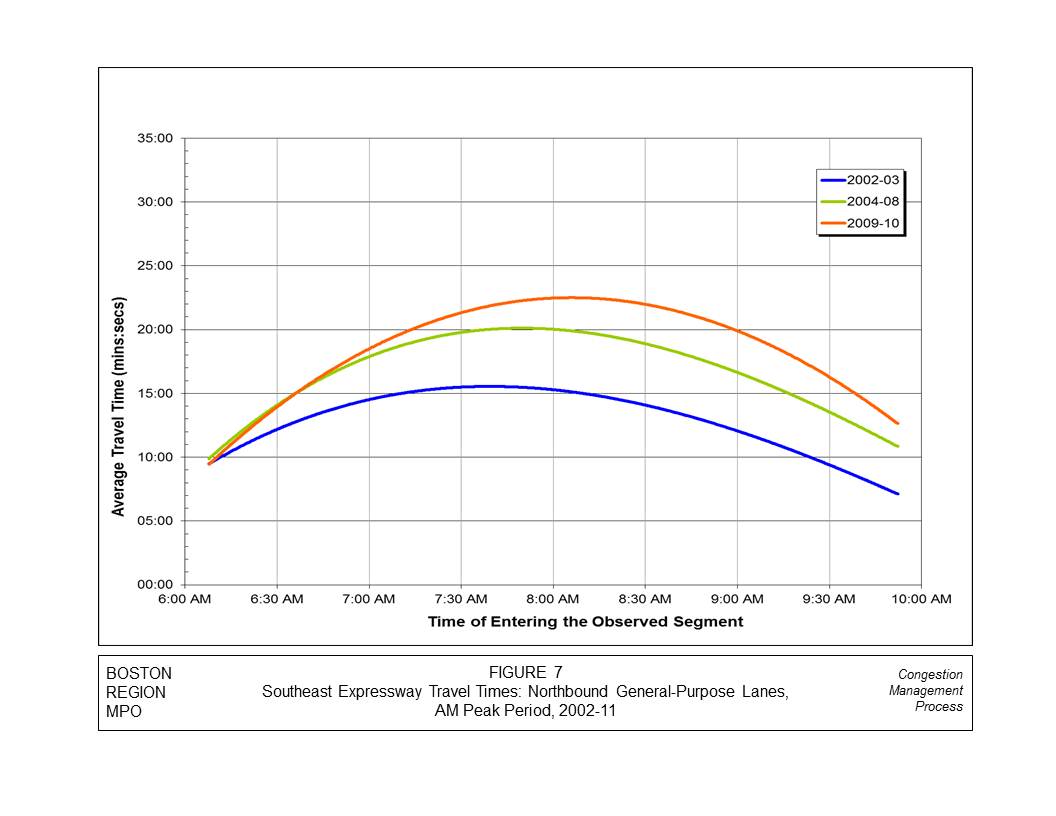
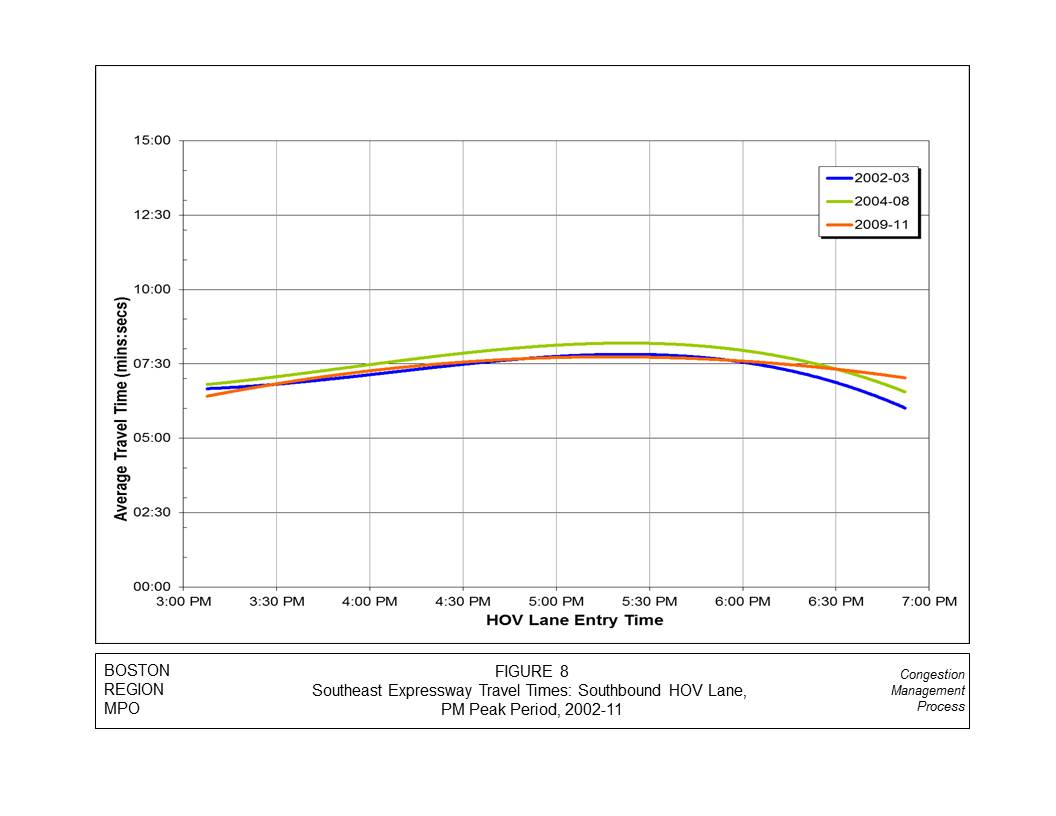
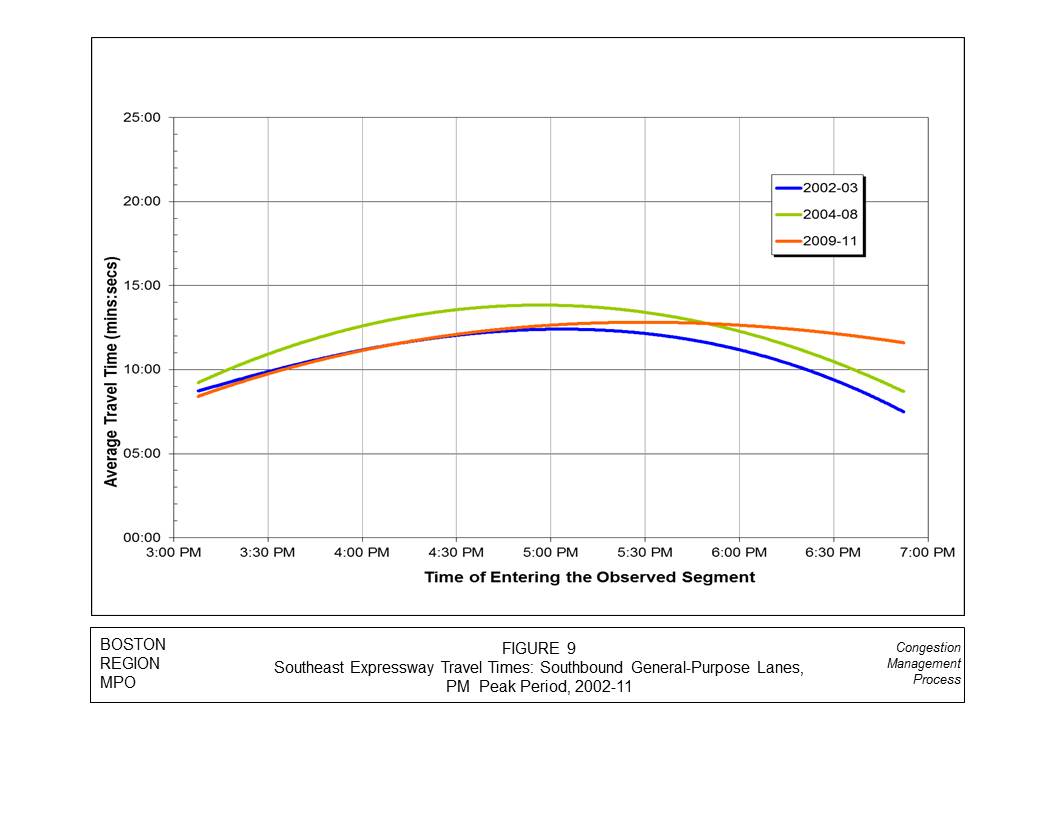
Figures 4, 5, 6, 7, 8, and 9, included in the appendix, present travel-time data and associated curves over the course of the four-hour monitoring period for the HOV and general-purpose lanes of I-93 North and the Southeast Expressway. In each of these figures, the average travel time for each 30-minute monitoring interval between 6:00 AM and 10:00 AM and between 3:00 PM and 7:00 PM were plotted and fitted to polynomial curves, one for the years 2002–03, another for 2004–08, and another for 2009–11 observations. These figures show how the HOV and general-purpose lanes performed during the time that the HOV facility operated from 2002 to 2011. The milestones of the Central Artery Tunnel (CA/T) Project and the economic crisis of 2008 were considered in the selection of the time intervals, as they affected volumes of traffic on the facilities that we monitor. Table A-1, in the appendix, gives the milestones of the Central Artery/Tunnel (CA/T) Project.4 This table is included in the memorandum because the CA/T project, as it has progressed through various stages, has had impacts on the operations of the HOV and general-purpose lanes.
Table 1 presents the total number of vehicles and persons, average vehicle occupancy levels, persons per hour per lane, and other data for the HOV and general-purpose lanes of I-93 North, and Table 2 presents the same categories of data for the Southeast Expressway.

The following sections describe the historical trends of travel times and vehicle occupancy levels for the HOV and general-purpose lanes of I-93 North and the Southeast Expressway.
Historically, travel times on the I-93 North HOV and general-purpose lanes exhibit interesting characteristics.
TABLE 1
Historical Vehicle Counts: I-93 North, Southbound,
AM Peak Period (6:00 AM–10:00 AM)
Year |
Facility |
Total Vehicles |
Total Persons |
Vehicles per Hour per Lane |
Persons per Lane |
HOV Lane Efficiency Rate* |
Persons per Vehicle |
2004 |
HOV |
2,300 |
7,015 |
575 |
1,754 |
1.21 |
3.05 |
General |
10,291 |
11,556 |
1,286 |
1,445 |
1.12 |
||
All |
12,591 |
18,571 |
1,049 |
1,548 |
1.47 |
||
2005 |
HOV |
2,669 |
8,017 |
667 |
2,004 |
1.24 |
3 |
General |
11,746 |
12,888 |
1,468 |
1,611 |
1.1 |
||
All |
14,415 |
20,905 |
1,201 |
1,742 |
1.45 |
||
2006 |
HOV |
2,820 |
8,022 |
705 |
2,005 |
1.1 |
2.84 |
General |
13,007 |
14,568 |
1,626 |
1,821 |
1.12 |
||
All |
15,827 |
22,589 |
1,319 |
1,882 |
1.43 |
||
2007 |
HOV |
2,989 |
8,372 |
747 |
2,093 |
1.14 |
2.8 |
General |
12,934 |
14,640 |
1,617 |
1,830 |
1.13 |
||
All |
15,923 |
23,012 |
1,327 |
1,918 |
1.45 |
||
2008 |
HOV |
3,090 |
8,545 |
772 |
2,136 |
1.13 |
2.77 |
General |
13,512 |
15,164 |
1,689 |
1,896 |
1.12 |
||
All |
16,602 |
23,709 |
1,383 |
1,976 |
1.43 |
||
2009 |
HOV |
2,982 |
8,347 |
745 |
2,087 |
1.19 |
2.8 |
General |
12,980 |
14,062 |
1,623 |
1,758 |
1.08 |
||
All |
15,962 |
22,409 |
1,330 |
1,867 |
1.4 |
||
2010 |
HOV |
2,920 |
7,599 |
730 |
1,900 |
1.23 |
2.6 |
General |
11,066 |
12,403 |
1,383 |
1,550 |
1.12 |
||
All |
13,986 |
20,002 |
1,166 |
1,667 |
1.43 |
||
2011 |
HOV |
3,192 |
8,876 |
798 |
2,219 |
1.16 |
2.78 |
General |
13,410 |
15,255 |
1,676 |
1,907 |
1.14 |
||
All |
16,602 |
24,131 |
1,383 |
2,011 |
1.45 |
* HOV lane efficiency rate = Persons per hour per HOV lane divided by persons per hour per general-purpose lane, multiplied by 100. |
TABLE 2
Historical Vehicle Counts: Southeast Expressway, Northbound,
AM Peak Period (6:00 AM–10:00 AM)
Year |
Facility |
Total Vehicles |
Total Persons |
Vehicles per Hour per Lane |
Persons per Lane |
HOV Lane Efficiency Rate* |
Persons per Vehicle |
2005 |
HOV |
3,898 |
10,769 |
975 |
2,692 |
1.7 |
2.76 |
General |
22,688 |
25,367 |
1,418 |
1,585 |
1.12 |
||
All |
26,586 |
36,135 |
1,329 |
1,807 |
1.36 |
||
2006 |
HOV |
4,156 |
10,954 |
1,039 |
2,738 |
2.28 |
2.64 |
General |
18,237 |
19,215 |
1,140 |
1,201 |
1.05 |
||
All |
22,393 |
29,937 |
1,120 |
1,497 |
1.34 |
||
2007 |
HOV |
4,104 |
11,229 |
1,026 |
2,807 |
2.02 |
2.74 |
General |
20,301 |
22,204 |
1,269 |
1,388 |
1.09 |
||
All |
24,405 |
33,432 |
1,220 |
1,672 |
1.37 |
||
2008 |
HOV |
3,559 |
9,855 |
890 |
2,464 |
1.73 |
2.77 |
General |
21,004 |
22,751 |
1,313 |
1,422 |
1.08 |
||
All |
24,563 |
32,606 |
1,228 |
1,630 |
1.33 |
||
2009 |
HOV |
3,925 |
10,630 |
981 |
2,658 |
1.81 |
2.71 |
General |
21,779 |
23,515 |
1,361 |
1,470 |
1.08 |
||
All |
25,704 |
34,145 |
1,285 |
1,707 |
1.33 |
||
2010 |
HOV |
4,030 |
11,455 |
1,008 |
2,864 |
2.16 |
2.84 |
General |
19,383 |
21,169 |
1,211 |
1,323 |
1.09 |
||
All |
23,413 |
32,623 |
1,171 |
1,631 |
1.39 |
||
2011 |
HOV |
4,568 |
12,420 |
1,142 |
3,105 |
2.42 |
2.72 |
General |
18,528 |
20,547 |
1,158 |
1,284 |
1.11 |
||
All |
23,096 |
32,967 |
1,155 |
1,648 |
1.43 |
* HOV lane efficiency rate = Persons per hour per HOV lane divided by persons per hour per general-purpose lane, multiplied by 100. |
Figures 4 and 5, in the appendix, present travel-time data and associated curves for the four-hour PM monitoring period for I-93 North HOV and general-purpose lanes, respectively.
A summary of a review of the historical trends of travel times on the Southeast Expressway northbound HOV and general-purpose lanes is shown in Figure 2:
Figures 6 and 7, in the appendix, present travel-time data and associated curves for the four-hour monitoring period for the northbound Southeast Expressway HOV and general-purpose lanes. The key findings are:
The total number of vehicles and persons, vehicles and persons per hour per lane, HOV lane efficiency rate, and vehicle occupancy levels for the HOV and general-purpose lanes of the Southeast Expressway are presented in Table 2:
The Southeast Expressway’s southbound HOV and general-purpose lanes display characteristics similar to those of their northbound counterparts, though the trends are less marked, as shown in Figure 3:
One of the reasons for this situation is that during the PM peak period, the traffic merging onto the Southeast Expressway at the Savin Hill/South Bay ramp creates a bottleneck that essentially meters traffic heading southbound on the Southeast Expressway toward the HOV lane entrance. Consequently, traffic in the general-purpose lanes downstream of this bottleneck is faster (comparable to the speed in the HOV lane) until Exits 9 and 10, in East Milton.
Figures 8 and 9, in the appendix, present travel-time data and associated curves over the four-hour monitoring period for the Southeast Expressway’s southbound HOV and general-purpose lanes.
Vehicle occupancy counts are not conducted for the PM hours of operations on the Southeast Expressway. It is assumed to be identical to that observed for its northbound counterpart during the AM hours of operations. Therefore vehicle occupancy analysis could not be performed for the Southeast Expressway southbound HOV and general-purpose lanes.
The HOV monitoring data are collected in accordance with Massachusetts Department of Environmental Protection (DEP) regulation 310 CMR 7.37. This regulation calls for samples of HOV and general-purpose-lane travel-time data to be collected and reported quarterly. The following findings are based on the analysis of the HOV monitoring data.
SAA/saa
1 For a description of a typical work program for this monitoring, refer to: Work Program for 2011–2012 HOV Monitoring on I-93 North and the Southeast Expressway, Boston Region MPO, November, 2011.
2 On March 5, 2005, the HOV lane on I-93 North was extended more than half a mile from the lower deck onto the Leonard P. Zakim Bunker Hill Bridge, coinciding with the full opening of the CA/T Project southbound lanes and tunnel.
4. I-93 North Travel Times, Southbound HOV Lane (6:00 AM–10:00 AM)
5. I-93 North Travel Times, Southbound General-Purpose Lanes (6:00 AM–10:00 AM)
6. Southeast Expressway Travel Times, Northbound HOV Lane (6:00 AM–10:00 AM)
7. Southeast Expressway Travel Times, Northbound General-Purpose Lanes (6:00 AM–10:00 AM)
8. Southeast Expressway Travel Times, Southbound HOV Lane (3:00 PM–7:00 PM)
9. Southeast Expressway Travel Times, Southbound General-Purpose Lanes (3:00 PM–7:00 PM)
In February 1974, a southbound HOV lane was established on I-93 North. In response to ever-increasing queue lengths, this HOV lane was lengthened in August 1974, and then again in October 1979, when it stretched a total of 1.07 miles from the beginning of the I-93 double-deck elevated structure near Sullivan Square to a point 900 feet north of the merge of I-93 and Route 1. The lane was later extended farther, to a length of 2.0 miles, to run from a point just south of Mystic Avenue in Somerville to a point 0.12 mile north of the Route 1 merge in Charlestown. On March 5, 2005, it was extended by more than half a mile, from the lower deck onto the Leonard P. Zakim Bunker Hill Bridge, increasing the length of the lane to 2.6 miles. This extension coincided with the full opening of the southbound lanes of the bridge and the Central Artery tunnel.
When the I-93 North HOV lane was initially opened, it was made available to buses, motorcycles, and carpools and vanpools having at least three persons per vehicle. This entry criterion provided acceptable levels of usage, in spite of the relatively small numbers of carpools, because the lane was available to vehicles traveling from I-93 southbound to Route 1 North (including significant numbers of commuters traveling to downtown Boston via the Navy Yard off-ramp and Charlestown Bridge). When the Central Artery North Area project began in 1987, however, the ramp to Route 1 North was closed, so vehicles could no longer travel directly from I-93 southbound to Route 1 North using the HOV lane or the general purpose lanes. The consequent case of “empty lane syndrome” ultimately led to the 1988 change of the HOV-lane entry requirement to the two‑plus‑persons criterion that has been retained to this date. By 1992 the HOV lane was carrying about 1,100 vehicles during the AM peak hour, which was near its capacity, given the geometry of its merge with the general-purpose lanes at its southern end. Access from the HOV lane to the Leverett Circle Connector was cut off when the latter was completed in 1999. This led to a reduction of volumes in the HOV lane, which are presently between 700 and 800 vehicles per peak hour.
The Southeast Expressway HOV lane opened in 1995 as mitigation for the CA/T Project. Entry has been limited to carpools, vanpools, buses and other vehicles meeting the occupancy criteria, and motorcycles. The occupancy requirement for the lane has changed over the years: initially the entry rule was three or more occupants per vehicle; after that there was a sticker program (red and green) that allowed vehicles with two occupants to enter the lane on alternate days. This was later expanded to allow all vehicles with stickers to use the lane on all days. Presently, any vehicle with two or more occupants meets the entry requirement for the HOV lane.
The Southeast Expressway HOV lane’s original three-or-more occupancy rule resulted in maximum volumes of 375 and 400 vehicles per hour for the AM and PM peak hour, respectively. With the introduction of the two-person-occupancy sticker program in 1998, these volumes increased to a maximum of 550 and 525 vehicles per hour for the AM and PM peak hour, respectively. In February 1999, when the two-person-occupancy sticker program was expanded to all days, the maximum volumes increased to 825 vehicles per hour during the AM peak hour, and 550 during the PM peak hour. In June 1999, when the HOV lane was opened to all vehicles with two or more occupants, with no sticker required, the lane use increased to 1,300 vehicles per hour during the AM peak hour and 1,000 during the PM peak hour. Presently, the volume in the HOV lane typically does not exceed 1,300–1,400 vehicles per hour either northbound during the AM peak hour or southbound during the PM peak hour.
TABLE A-1
Central Artery/Tunnel Project Milestones with Potential Effects on I-93 HOV Facilities
Date |
Milestone |
October 1999 |
The Leverett Circle Connector viaduct opens.
|
March 30, 2003 |
The I-93 northbound tunnel opens.
|
December 20, 2003 |
The I-93 southbound tunnel opens.
|
April 4–December 19, 2004 |
I-93 southbound near South Station is reduced from three to two lanes during reconstruction of Dewey Square Tunnel. |
December 19, 2004 |
The Leverett Circle eastbound tunnel opens. |
January 9, 2005 |
A fourth lane of I-93 southbound from Dewey Square Tunnel to the Southeast Expressway opens.
|
March 5, 2005 |
A fourth lane of I-93 southbound on the Zakim Bridge and in the O’Neill Tunnel opens.
|
July 10, 2006 |
A portion of ceiling collapses in the I-90 tunnel in South Boston. |
August 10, 2006 |
Ramp A, from the South Boston Bypass Road to I-90 eastbound, reopens.
|
September 1, 2006 |
The section of I-90 eastbound that runs under Fort Point Channel to Exit 25 reopens. |
November 22, 2006 |
Ramp D, from Exit 25 of I-90 westbound under Fort Point Channel to I-93 North/South, reopens. |
December 23, 2006 |
The section of I-90 westbound under Fort Point Channel reopens. |
January 14, 2007 |
The remaining I-90 lanes reopen. |
January 25, 2007 |
The HOV lane from I-93 northbound reopens to South Station Transportation Center and Kneeland Street. |
January 26, 2007 |
Ramp L, linking I-93 northbound to the Seaport District and Ted Williams Tunnel, reopens.
|
June 1, 2007 |
The HOV lane from I-93 northbound and Kneeland Street to Logan Airport reopens. This was the final repair and remediation project that resulted from the July 2006 ceiling collapse.
|
