Technical Memorandum
DATE: May 18, 2017
TO: William Paulitz, City Engineer, Peabody
FROM: Seth Asante and Katrina Crocker, MPO Staff
RE: Safety and Operations Analyses, FFY 2016
Andover Street at Esquire Drive and Violet Road in Peabody
This memorandum summarizes the analyses and improvement alternatives developed for the intersection of Andover Street at Esquire Drive and Violet Road in Peabody. The opening sections of the memorandum give a background of the study and describe the existing conditions and concerns of the community. Following that, we describe the various kinds of data collected, and assess the safety and operational problems. The final sections of the memorandum present the improvement alternatives, recommendations, and next steps. This memo also includes appendices that contain methods and data applied in the study, detailed reports of the intersection capacity analyses, and an overview of the project development process.
The purpose of the Safety and Operations Analyses at Selected Intersections study is to examine safety, operations, and mobility issues at major intersections in the Boston Region Metropolitan Planning Organization (MPO) region’s arterial highways—areas where many crashes occur, that experience congestion during peak traffic periods, or are in need of improvements for buses, bicyclists, and pedestrians. For the past ten years, the MPO has been conducting these planning studies, and municipalities in the region are very receptive to them. These studies give communities an opportunity to begin looking at the needs of these locations, starting at the conceptual level, before they commit funds for design and engineering. Eventually, if the project qualifies for federal funds, the study’s documentation also is useful to the Massachusetts Department of Transportation (MassDOT). These studies support the MPO’s visions and goals, which include increasing transportation safety, maintaining the transportation system, advancing mobility, and reducing congestion.
Following a selection process based on safety conditions1 , congested conditions2 , multimodal significance3 , regional significance4 , regional equity5 , and implementation potential6 , two locations from a short list of 20 intersections were approved for study by the MPO.7 The two locations approved for study are:
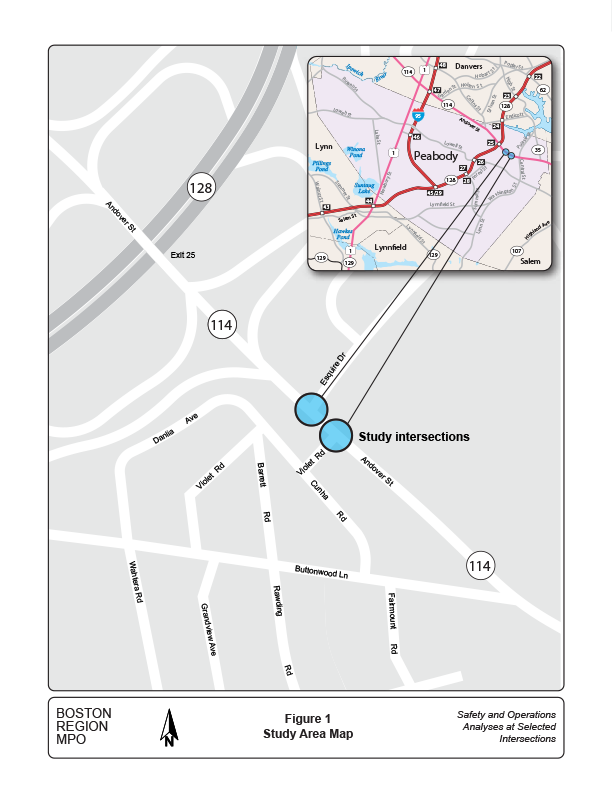
The location in Peabody was selected because it has safety and traffic operations problems. This intersection is ranked 95 on the 2012–2014 Statewide Top-200 Intersection Crash List. Crashes at the intersection also form part of a Highway Safety Improvement Program (HSIP) crash cluster.8 Figure 1 shows the location of the intersection and the surrounding roadways.
Figure 1 Study Area Map

MPO staff discussed the safety and operations issues at the intersection and the scope of work for the study with the City of Peabody, which expressed interest and willingness to participate in the study. MassDOT—in collaboration with the City of Peabody, the Metropolitan Area Planning Council (MAPC), and the Central Transportation Planning Staff (CTPS) (to the Boston Region MPO)—conducted a road safety audit (RSA) for this intersection on Monday, November 21, 2016. Staff reviewed the recommendations of the RSA and incorporated them into this memorandum. (Appendix A includes information about the selection process and comments about the study.)
1 Safety Conditions: Location has a higher-than-average crash rate for its functional class, contains a Highway Safety Improvement Program (HSIP)-eligible crash cluster, contains a top-200 high crash location, or has a significant number of pedestrian and bicycle crashes (two or more per mile).
2 Congested Conditions: Travel time index is at least 1.3.
3 Multimodal Significance: Location carries bus route(s), is adjacent to a transit stop or station; supports bicycle or pedestrian activities or has an implementation project to support one or more of these activities; has need to accommodate pedestrians and bicyclists and improve transit; or high truck traffic serving regional commerce.
4 Regional Significance: Location is in National Highway System; carries a significant portion of regional traffic (ADT >20,000); lies within 0.5 miles of EJ transportation analysis areas or zones; or is essential for the region’s economic, cultural, or recreational development.
5 Reginal Equity: That is, it was important not to select 1) more than one location in a subregion and 2) a location in same subregion as in the preceding cycle of this study.
6 Implementation Potential: Location is proposed or endorsed by its roadway administrative agency (agencies); proposed or endorsed by its subregion and is a priority for that subregion; or has strong support from other stakeholders.
7 Safety and Operations Analyses at Selected Intersections: Federal Fiscal Year 2016, Technical Memorandum to the Boston Region Metropolitan Planning Organization. Seth Asante and Katrina Crocker, March 17, 2016.
8 In the Boston region, the 921 intersections in the top-five percent have crash clusters with a minimum equivalent property damage only value of 42.
Andover Street provides access to and from several locations in Peabody as well as communities to the east and west, passing through Marblehead, Salem, Peabody, Danvers, Middleton, North Andover, and Lawrence. Although Andover Street is a state-numbered route, the segment beginning at and to the east of Esquire Drive and Violet Road is under the jurisdiction of the City of Peabody.
The roadway, functionally classified as a principal arterial, is part of the National Highway System (NHS) program and is eligible for federal funds under the program. Andover Street near the Esquire Drive and Violet Road intersection has right-of-way width that varies from 60 feet to 75 feet. To the east of the intersection, Andover Street is a two-lane, two-way arterial, with very wide travel lanes; during peak periods, drivers form two lanes in each direction although they are striped as single lanes. To the west of the intersection, Andover Street is a four-lane arterial, with two travel lanes in each direction. Near the intersection, there are continuous and connected sidewalks (six-to-eight feet wide) on both sides, and posted speed limits of 30 miles per hour eastbound and 35 mph westbound. On-street parking is prohibited in this segment and there are no shoulders, therefore bicyclists share the roadway with motor vehicles, but there are no sharrows lanes for sharing the roadway.
Esquire Drive is a city-owned two-lane, two-way local street providing access to a residential area north of the intersection. The right-of-way is approximately 60 feet wide and comprised of two wide travel lanes, a median, and sidewalks with grass buffers on both sides.
Violet Road is a city-owned two-lane, two-way local street providing access to a residential area south of the intersection. The right-of-way is approximately 30 feet wide and comprised of two 11-foot travel lanes and a sidewalk on the east side only.
Figure 2 shows the study intersection layout, lane configurations, and the surrounding land uses.
Figure 2 Study Intersection Existing Conditions
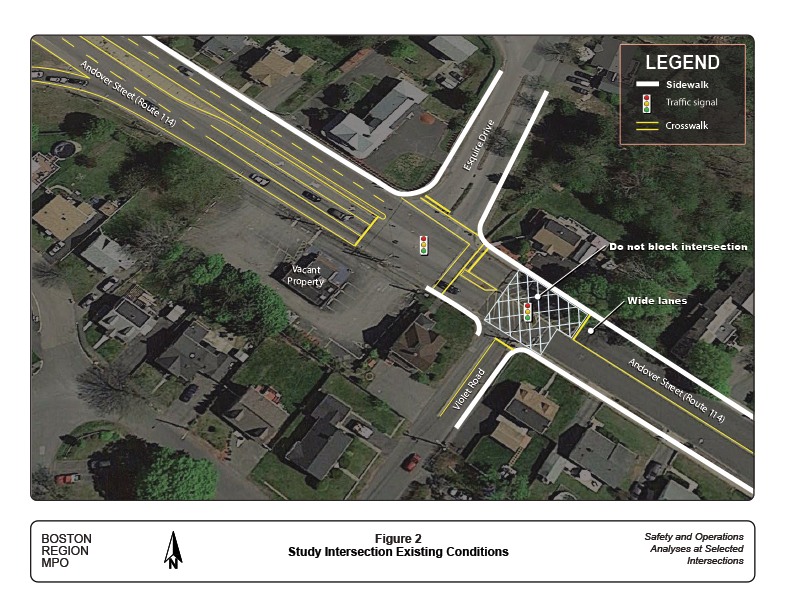
As shown in Figure 2, Andover Street, Esquire Drive, Violet Road, and the driveways for Chandler’s Ice Cream and a residential house on the opposite side of Violet Road intersect to form a complex signalized intersection. Traffic operation is complicated at the intersection because Violet Road is not directly aligned with Esquire Drive, which creates an offset intersection on Andover Street that put drivers in dilemma. Currently, the Chandler’s Ice Cream property is vacant and there is no traffic into and out of that driveway.
The primary traffic flow is along Andover Street; Esquire Drive and Violet Road are low-volume residential streets. The eastbound approach on Andover Street widens to 33 feet at about 200 feet prior to the intersection, and it is striped as two through lanes and an exclusive left-turn lane. The westbound approach lane on Andover Street widens to 21 feet prior to the intersection and continues the same width through the intersection but it is striped as a single lane instead of two travel lanes. Each approach on Esquire Drive and Violet Road has one lane for all traffic movements.
The intersection is equipped with a fully actuated traffic signal but it lacks an Opticom system to handle emergency preemption. The signal heads are mounted on a mixture of span-wire, mast-arm, and post mounts but they lack backplates that would improve signal visibility. In addition, the eastbound Andover Street traffic has a leading protected left-turn phase but the left-turn signal head lacks left-turn arrow signals to communicate the information to the drivers turning left at that approach; this creates confusion as to whether the left turn is a ”protected” or “permitted” turn. Presently, the Andover Street eastbound left-turn signal head shows only circular green, yellow, and red indications.
There is functioning pedestrian signal with pushbuttons only for crossing Andover Street at Esquire Road. There is no crosswalk on Andover Street at the intersection of Violet Road. Some of the crosswalks lack curb ramps and those with curb ramps do not meet MassDOT’s Americans with Disabilities Act (ADA) standards; they also lack detection-warning plates, and the cross slopes and landings are substandard. In addition, there is no accommodation for bicyclists at the intersection. The intersection curb radii are adequate for trucks and buses turning onto side streets but not adequate for making U-turns on Andover Street; hence, U-turns are prohibited on Andover Street.
The intersection has U-turn prohibition signs, banning eastbound U-turns on Andover Street and U-turns via Esquire Drive. The audit team observed that drivers do not comply with the U-turn prohibition signs on both Andover Street and Esquire Drive. The main reason for this noncompliance is that going east on Andover Street from the North Shore Mall and Route 128 interchange, it becomes very difficult for drivers to turn around if they find themselves headed the wrong direction. Therefore, many drivers in this situation make the U-turn at the Andover Street and Esquire Drive intersection, which happens to be the first signalized intersection east of the Route 128 interchange. The two-hour AM and two-hour PM turning movement counts show six U-turn maneuvers on Andover Street eastbound at the intersection; however, the volume may be higher on a daily basis. In addition, the U-turn prohibition signs and obstructions in the median opening onto Esquire Drive are solutions to an existing U-turn problem.
The Massachusetts Bay Transportation Authority’s (MBTA) Route 435 bus (Liberty Tree Mall to Central Square in Lynn via Peabody Square) and Route 465 bus (Salem Depot to Liberty Tree Mall via Peabody and Danvers) both stop near the study intersection, with service available on weekdays and on weekends. Route 435 operates Monday through Friday every 30 minutes from 6:40 AM to 11:20 PM; Saturday every 45 minutes from 6:45 AM to 11:43 PM; and Sunday every hour from 11:00 AM to 8:23 PM. Route 465 operates Monday through Friday every hour from 6:55 AM to 7:56 PM; Saturday every hour from 9:00 AM to 7:39 PM; and no Sunday service. The performance evaluation showed that MBTA bus Routes 435 and 465 failed the frequency-of-service and schedule-adherence standards; bus Route 465 had low ridership. The MBTA regularly evaluates performance of its services and recommends and implements service changes through the service planning process. The service planning process includes system-wide quarterly changes, ongoing rolling Service Plan changes, and an annual evaluation to inform the MBTA’s budget process.
The land use near the study intersection is primarily residential.
MassDOT Highway Division’s Traffic Data Collection Section collected turning-movement counts (TMCs) at the intersection in April 2016, while schools were in session. MassDOT conducted the counts during the weekday AM peak travel period (7:00 AM–9:00 AM), weekday PM peak travel period (4:00 PM–6:00 PM), and Saturday midday travel period (12:00 AM–2:00 PM). Heavy vehicles such as school buses, transit buses, and trucks were counted separately. Pedestrian and bicycle counts were conducted simultaneously with the TMCs. The division collected automatic traffic recorder (ATR) counts at two locations on Andover Street. ATR counts—which are continuous for a 48-hour period—are used to determine the average weekday traffic (AWDT) of a roadway. Finally, MassDOT collected spot speed data—which also are continuous 48-hour records—at the same two locations simultaneous with the ATR counts. (See Appendix B for traffic volume data, pedestrian and bicycle counts, and spot speed data.)
Figure 3 shows the turning movement volumes at the intersection; and Table 1 presents a summary of ATR traffic data in terms of AWDT, peak hour volumes, and the directional distribution of the peak-hour traffic. Based on the counts, the estimated average daily traffic (ADT) and AWDT on Andover Street were 45,400 and 49,260 vehicles per day, respectively. The primary traffic flow on Andover Street is westbound during the AM peak period and eastbound during the PM peak period. During both AM and PM peak periods, the directional split on Andover Street is about 55 percent. The ADT on Esquire Drive and Violet Road were 2,700 and 1,000 vehicles per day, respectively.
Figure 3 Existing Turning Movements Volumes and Speeds
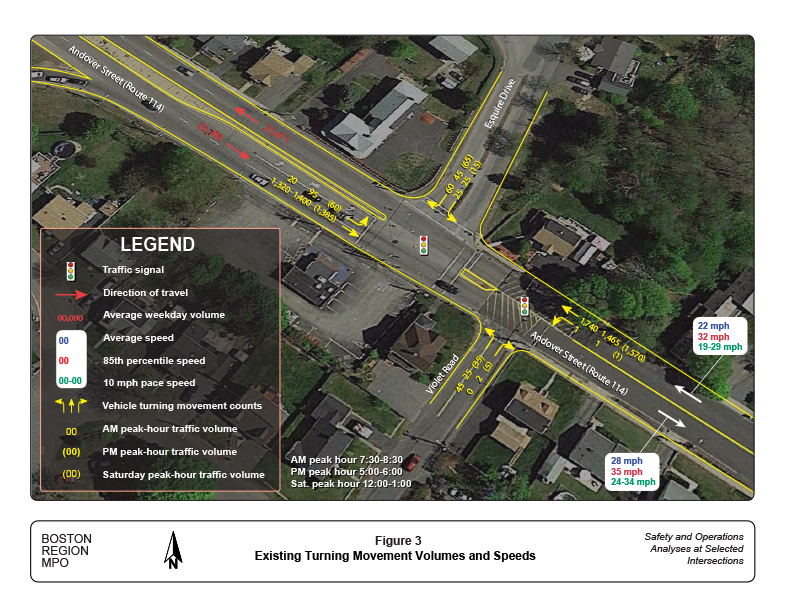
TABLE 1
Existing 2016 Traffic Volumes
Location |
Average Weekday Volume a |
AM Peak Hour Volume b |
AM Peak Hour K-Factor c |
Directional Distribution of Peak Hour Traffic d |
PM Peak Hour Volume |
PM Peak Hour K-Factor |
Directional Distribution of Peak Hour Traffic |
Andover Street, East of Violet Road |
49,260 |
3,380 |
6.7 |
56% WB |
3,710 |
7.5 |
54% EB |
Esquire Drive, North of Andover St |
2,650 |
170 |
6.4 |
71% SB |
200 |
7.5 |
55% NB |
Violet Road, South of Andover Street |
1,010 |
65 |
6.4 |
62% NB |
92 |
9.1 |
67% SB |
a Daily traffic (both directions) expressed in vehicles per day. b Peak hour volumes (both directions) expressed in vehicles per hour. c Percent of daily traffic that occurs during the peak hour. d Directional distribution of peak hour traffic.
Source: Central Transportation Planning Staff.
The ATR and TMC counts show high traffic volumes on Andover Street during all three peak periods. Therefore, even though commuter volumes are the most critical factor and will drive the design, traffic congestion and delays also are present at the intersection on weekends because of shopping and other trips.
Nineteen (19) pedestrians crossed at the intersection during the two-hour weekday AM and two-hour weekday PM peak periods, and another 19 pedestrians crossed during the two-hour Saturday PM peak period. No bicyclists used the intersection during the four-hour weekday and two-hour Saturday PM monitoring period.
The percentage of trucks driving through the intersection during the peak travel periods ranged between 3.0 and 4.0 percent, which is not considered high for peak-period traffic conditions.
Analysis of the spot speed data, summarized in Figure 3, shows that the average speeds are lower than the posted speed limits; however, the 85th percentile speeds are consistent with posted speed limits—westbound traffic: 32 mph versus the 35 mph posted speed limit and eastbound traffic: 35 mph versus the 30 mph posted speed limit. Analysis of the spot speed data shows that eastbound vehicles travel at much higher speeds than do their westbound counterparts. At the time of data collection, about 41 percent of the westbound drivers were traveling between 19 and 29 mph (10 mph pace speed) and 60 percent of the eastbound drivers were traveling between 24 and 34 mph.
The intersection is ranked 95 on the 2012–2014 Statewide Top-200 Intersection Crash List. Crashes at the intersection form part of an HSIP crash cluster.9 MassDOT defines HSIP-eligible crash clusters as those that rank within the top-five percent of crash clusters for each Regional Planning Agency, based on the equivalent property damage only (EDPO) index.10 This HSIP crash cluster is comprised of 50 crashes, including ones near Violet Road, and has an EPDO of 118 crashes. CTPS reviewed the Peabody Police Department’s 2013–2015 crash records that were used in the RSA. Below, we discuss crashes at the intersection in terms of severity, manner of collision, weather conditions, ambient light conditions, and time of occurrence (also summarized in Appendix C).
Using MassDOT Highway Division’s methodology, CTPS calculated the intersection crash rates for the three-year period, 2013–2015. The average crash rate for the study intersection was 1.03 crashes per million entering vehicles, which exceeds the average crash rate for a signalized intersection in this district. The most recent statewide average crash rate for signalized intersections in MassDOT Highway Division District 4, which includes Peabody, is 0.73 crashes per million entering vehicles.11 (See Appendix C for the crash rate worksheet.)
Collision diagrams are useful for examining crash patterns and developing safety strategies. Figure 4 shows the collision diagram prepared by MassDOT using the 2013–2015 crash data obtained from the Peabody Police Department. The numbers in the collision diagram uniquely identify each crash (and for further detail, may be used to cross reference the crash records in Appendix C). On the Andover Street approaches, the most prevalent crash pattern was the rear-end type, which typically are associated with congested signalized intersections.
9 In the Boston region, the 921 intersections in the top-five percent have crash clusters with a minimum EDPO value of 42.
10 EPDO Crash Rating = 10 * Fatal Crashes + 5 * Injury Crashes + 1 * Other Crashes (Property Damage Only or Unknown Severity), based on MassDOT top-200 high-crash locations: 2011-13 crash data.
11 Based on MassDOT Registry of Motor Vehicles crash information queried on February 9, 2016.
Figure 4 Collision Diagram: Andover Street (Rout 114) at Esquire Drive and Violet Road, Peabody Police Reports: Jan 2013-Dec 2015
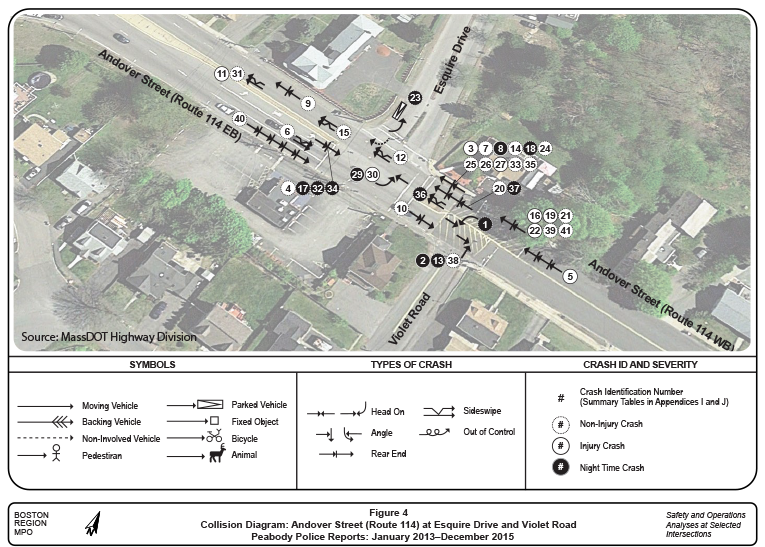
The majority of the rear-end crashes on Andover Street resulted from following too closely, not paying attention, and taking an improper action. In addition, the most crashes occurred during the off-peak period between 8:00 AM and 4:00 PM and between 6:00PM and 12:00 AM. Another safety issue is lack of driver awareness and poor visibility of the signal heads that are blocked by overgrown vegetation and tree branches near the intersection. Lack of arrow indications for the eastbound Andover Street left turns and drivers forming two lanes at the Andover Street westbound approach during peak periods and single-lane traffic during off-peak periods further confuse drivers.
Using the data and information collected, MPO staff built a traffic analysis network (with Synchro12 ) for the AM and PM peak periods to assess the capacity and quality of traffic flow at the intersections. Staff conducted the analyses consistent with Highway Capacity Manual (HCM) methodologies (detailed worksheets of the analyses are included in Appendix D).13 The HCM methodology demonstrates the driving conditions at signalized and unsignalized intersections in terms of levels of service (LOS) ratings A through F. LOS A represents the best operating conditions (little to no delay), while LOS F represents the worst operating conditions (very long delay). LOS E represents operating conditions at capacity (limit of acceptable delay). Table 2 shows the control delays associated with each LOS for signalized and unsignalized intersections.
12 Trafficware Inc., Synchro Studio 8, Synchro plus SimTraffic, Build 801, Version 563, Sugar Land, Texas.
13 Highway Capacity Manual, HCM 2010, Volume 3: Interrupted Flow, Transportation Research Board of the National Academies, Washington DC, December 2010.
TABLE 2
Levels of Service and Control Delays at Intersections
Level of Service |
Signalized Intersections Control Delay (seconds per vehicle) |
Unsignalized Intersections Control Delay (seconds per vehicle) |
A |
≤ 10 |
≤ 10 |
B |
> 10-20 |
> 10-15 |
C |
> 20-35 |
> 15-25 |
D |
> 35-55 |
> 25-35 |
E |
> 55-80 |
> 35-50 |
F |
> 80 |
> 50 |
Source: Central Transportation Planning Staff.
Table 3 presents peak-hour performance in terms of LOS, delay, and queues for existing conditions. Although, traffic operations at the intersection are satisfactory during the weekday AM and PM peak hours and Saturday PM peak hours (LOS D or better), there are traffic queues on Andover Street that extend eastward to Andover Drive and westward beyond the Andover Street ramp-arterial junction. The peak-hour LOS results are satisfactory because drivers form two travel lanes in each direction on Andover Street, which increases the intersection’s capacity.
TABLE 3
Andover Street and Esquire Drive Intersection: Peak Hour Level of Service
|
Move- ment |
AM LOS |
AM Delay |
AM Queue |
PM LOS |
PM Delay |
PM Queue |
SAT PM LOS |
SAT PM Delay |
SAT PM Queue |
Existing Conditions (2014): |
-- |
-- |
-- |
-- |
-- |
-- |
-- |
-- |
-- |
-- |
Andover St. Eastbound |
L |
C |
30.4 |
36 |
D |
49.6 |
113 |
D |
49.0 |
86 |
Andover St. Eastbound |
T+R |
B |
12.9 |
578 |
B |
14.0 |
505 |
B |
11.9 |
446 |
Andover St. Westbound |
L+T |
D |
35.9 |
#991 |
D |
45.6 |
#863 |
D |
51.7 |
#903 |
Esquire Dr. Southbound |
L+T+R |
D |
34.8 |
95 |
D |
49.0 |
90 |
D |
49.9 |
95 |
Violet Rd. Northbound |
L+T+R |
D |
40.4 |
6 |
C |
29.1 |
31 |
C |
29.7 |
26 |
Total Intersection |
All |
C |
25.0 |
-- |
C |
21.0 |
-- |
C |
24.0 |
-- |
No-Build Conditions (2040): |
-- |
-- |
-- |
-- |
-- |
-- |
-- |
-- |
-- |
|
Andover St. Eastbound |
L |
C |
30.5 |
31 |
D |
50.2 |
122 |
D |
50.0 |
#869 |
Andover St. Eastbound |
T+R |
B |
14.8 |
446 |
B |
17.4 |
705 |
B |
15.3 |
581 |
Andover St. Westbound |
L+T |
E |
67.2 |
#812 |
F |
83.1 |
#1002 |
F |
86.1 |
#1012 |
Esquire Dr. Southbound |
L+T+R |
D |
39.0 |
131 |
D |
54.7 |
97 |
D |
50.2 |
105 |
Violet Rd. Northbound |
L+T+R |
E |
57.7 |
11 |
C |
29.5 |
34 |
D |
43.1 |
40 |
Total Intersection |
All |
D |
47.0 |
-- |
D |
41.0 |
-- |
D |
45.0 |
-- |
Build Alternative 1 Conditions (2040): |
-- |
-- |
-- |
-- |
-- |
-- |
-- |
-- |
||
Andover St. Eastbound |
L |
D |
51.7 |
45 |
D |
53.8 |
125 |
D |
48.8 |
80 |
Andover St. Eastbound |
T+R |
B |
11.3 |
431 |
B |
16.5 |
508 |
A |
9.1 |
355 |
Andover St. Westbound |
L+T |
C |
25.6 |
#1014 |
D |
46.6 |
#930 |
D |
43.9 |
#856 |
Esquire Dr. Southbound |
L+T+R |
D |
37.1 |
84 |
C |
33.2 |
72 |
C |
20.8 |
52 |
Violet Rd. Northbound |
L+T+R |
C |
30.4 |
43 |
D |
40.1 |
12 |
D |
45.7 |
8 |
Total Intersection |
All |
B |
15.3 |
-- |
B |
21.0 |
-- |
B |
20 |
-- |
Build Alternative 2 Conditions (2040): |
-- |
-- |
-- |
-- |
-- |
-- |
-- |
-- |
||
Andover St. Eastbound |
T+R |
B |
13.9 |
463 |
B |
19.6 |
#671 |
B |
16.2 |
#570 |
Andover St. Westbound |
L+T |
C |
21.8 |
822 |
C |
24.3 |
#745 |
C |
32.2 |
#751 |
Esquire Dr. Southbound |
L+T+R |
C |
29.7 |
113 |
C |
25.4 |
56 |
C |
22.7 |
60 |
Jug Handle |
L+T |
D |
39.9 |
37 |
D |
43.6 |
102 |
D |
38.7 |
75 |
Violet Rd. Northbound |
L+T+R |
B |
15.2 |
9 |
B |
15.5 |
12 |
A |
9.7 |
2 |
Total Intersection |
All |
B |
14.2 |
|
C |
17.1 |
|
C |
21.4 |
|
a Delay in seconds per vehicle. b 95th percentile queue length in feet. # = the 95th percentile volume exceeds capacity.
Source: Central Transportation Planning Staff.
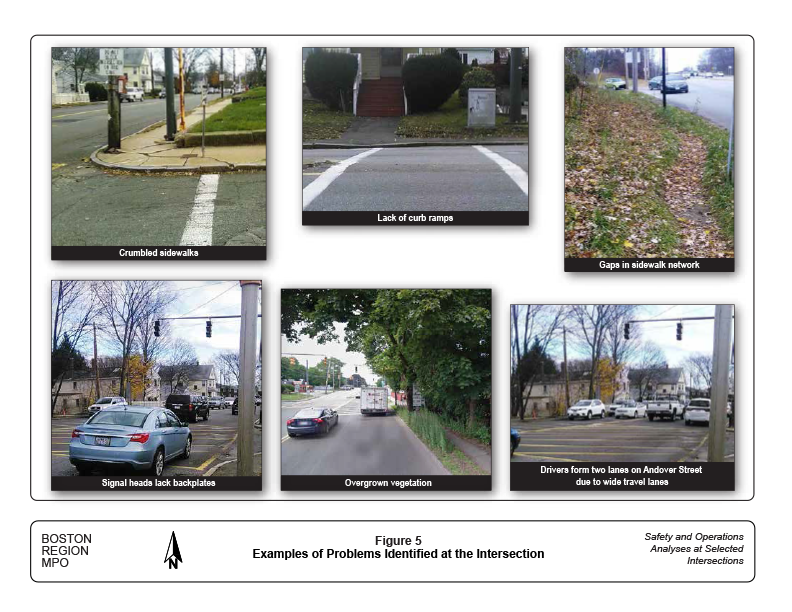
Based on field reconnaissance, analysis of existing traffic conditions and crash data, and discussions from the RSA, MPO staff identified the following problems, some of which are depicted in Figure 5:
Figure 5 Examples of Problems Identified at the Intersection
Staff used a planning model to forecast future traffic-volume changes systematically that could result from changes in the transportation network or land use. The model used in this study is the MPO’s most recently adopted regional travel demand model set used for the Long-Range Transportation Plan. Its socioeconomic components are based on forecasts produced by MAPC. Using TransCAD software, the model is calibrated at a regional level for 164 cities and towns, including all 101 cities and towns in the MPO region. Based on this regional planning model, traffic on Andover Street would grow at 0.4 percent per year, which results in total growth of five percent between 2016 and 2040.
MPO staff developed and analyzed two alternatives to improve safety and traffic operations, which then were tested using 2040 future turning-movement volumes (Table 3).
Listed below are the specific safety and operations improvements in Alternative 1. These could be implemented in phases depending on the urgency of the problem, or they could be performed together in a reconstruction project. Based on reconstruction costs of similar projects recorded in MassDOT’s project information database, CTPS estimates that the improvements would cost between $2 and $3 million.
Figure 6 Proposed Improvements — Alternative 1: Renovate the Intersection
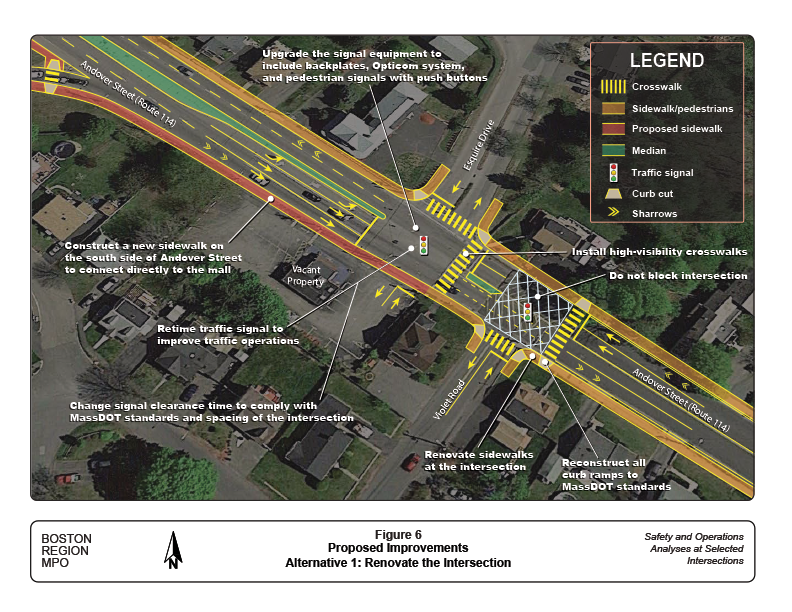
Presently, the existing right-of-way on Andover Street is very narrow, and it would not be possible to add bike lanes. In addition, the houses are already too close to the highway, which places further restrictions on widening Andover Street. Because of these limitations, CTPS suggests the following improvements:
Figure 7 shows the improvements in Alternative 2. This alternative was included in the analysis because it was one of the recommendations from the RSA, which included all of the safety and operational improvements in Alternative 1. The major differences between Alternative 2 and Alternative 1 are:
Figure 7 Proposed Improvements — Alternative 2: Redesign the Intersection to include a Jug Handle
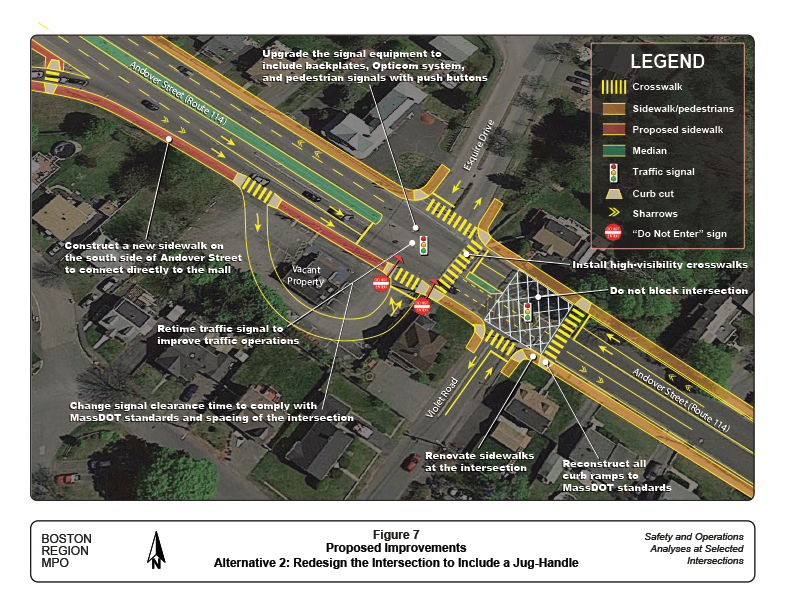
Presently, there is no space in the northwest quadrant of the intersection to construct improvements that would allow U-turns on Andover Street. One recommendation from the RSA was to acquire the closed Chandlers Ice Cream Shop property to create a jug-handle turnaround there (analyzed in this alternative). The weekday peak period AM and PM turning movement counts show six U-turn maneuvers on Andover Street eastbound at the intersection. Also, the collision diagram did not indicate a crash involving a U-turn maneuver. Based on the reconstruction costs of similar past projects recorded in MassDOT’s project information database, MPO staff estimate the improvements to cost between $3 and $4 million. This estimate does not include the land acquisition.
The 2040 no-build analysis results presented in Table 3 show that traffic operations would deteriorate if no improvements are made at the intersection. Overall, traffic at the intersection would operate at LOS D, and Andover Street westbound would operate at LOS F because of congested conditions with a long traffic queue. In comparison, the 2016 existing conditions show the overall intersection at LOS C and Andover Street westbound at LOS D, but with a traffic queue.
The analysis in Table 3 indicates that retiming the traffic signals would improve traffic operations. Overall, traffic at the intersection would operate satisfactorily at LOS B during the peak hours of travel, and Andover Street westbound would operate satisfactorily at LOS D, but with a traffic queue.
The analysis in Table 3 also demonstrates that reconfiguring the intersection to include a jug-handle turnaround and retiming the traffic signals would produce similar LOS as in Alternative 1.
The no-build alternative would offer no benefits, and would exacerbate the existing problems at the intersection, such as:
Alternative 1 would renovate the intersection to increase safety for motorists, pedestrians, and bicyclists and make traffic operations more efficient by:
The shortcomings of Alternative 1 are:
Alternative 2 has many of the benefits listed for Alternative 1, and would increase safety for motorists, pedestrians, and bicyclists and make traffic operations more efficient.
However, the jug-handle turnaround in Alternative 2 presents the following challenges and considerations:
Table 4 summarizes how each alternative would accomplish the goals and objectives of the study. The evaluation criteria are intended to provide qualitative and quantitative measures of the alternatives, providing insight into how the alternatives compare or relate to one another. The main goals and objectives are:
TABLE 4
Summary of Alternatives
Goals and Objectives |
No Build |
Alternative 1 |
Alternative 2 |
Supports study goals and objectives |
No benefit |
Significant benefit |
Significant benefit |
Promotes healthy transportation |
No benefit |
Significant benefit |
Significant benefit |
Increases safety for all road users |
No benefit |
Significant benefit |
Moderate benefit |
Makes traffic flow efficiently |
No benefit |
Significant benefit |
Moderate benefit |
Promotes multimodal transportation |
No benefit |
Significant benefit |
Significant benefit |
Resolves U-turn maneuvers |
No benefit |
No benefit |
Significant benefit |
Avoids property impacts |
Significant benefit |
Significant benefit |
No benefit |
Minimizes construction impacts |
Significant benefit |
Significant benefit |
Moderate benefit |
Associated construct cost* |
Low |
Moderate |
High |
*Associated construction costs for those alternatives, which require an expansion of the right-of-way, as land takings would add to the total cost but are not accounted for in the study.
Source: Central Transportation Planning Staff.
The above analyses and evaluation supports the need for renovations that would improve safety and mobility for motorists, pedestrians, and bicyclists at the intersections of Andover Street and Esquire Drive and Violet Road. Alternatives 1 and 2 are capable of addressing many of the identified problems; but their shortcomings need to be considered before selecting a preferred alternative.
Deciding between the two alternatives hinges upon:
In addition, selection of the preferred alternative should be based on cost and effectiveness; therefore, it is important for stakeholders to examine the alternatives with all road users in mind; participation in the selection process by other stakeholders is also important.
MPO staff recommend a total reconstruction of the intersection. However, depending on which alternative is selected, implementing some of the low-cost, short-term improvements, such as converting standard crosswalk markings to high-visibility markings, reconstructing curb ramps to ADA standards, and clarifying signal control would provide immediate benefits.
The City of Peabody has jurisdiction of the intersection and is responsible for renovations to improve safety, mobility, connectivity, and operations. This study gives the city an opportunity to look at the needs of the intersection and plan for design and engineering. The next step would be to select the preferred alternative that is sensitive to the goals and needs of stakeholders, and then advance the project through the planning process. The intersection is a high crash location and qualifies for HSIP funding. These steps will depend upon cooperation between MassDOT, the City of Peabody, and the MPO to begin the project notification and review process, and complete the project initiation form. After completing the initial steps, the City of Peabody and MassDOT can start preliminary design and engineering to place the project in the Transportation Improvement Program. Transportation decision making is complex, and influenced by factors such as financial limitations and agency programmatic commitments. Project development is the process that takes transportation improvements from concept to construction (see Appendix E for an overview of this process).
This study supports the MPO’s visions and goals, which include increasing transportation safety, maintaining the transportation system, advancing mobility and access, reducing congestion, and expanding the opportunities for walking and bicycling, while also making them safer. If implemented, the improvements proposed in this report would make traffic operations more efficient, while increasing safety and modernizing the roadway to accommodate all users.