
Route 1A-Vinnin Square Priority Corridor Study
Marblehead, Salem, and Swampscott
Project Manager
Seth Asante
Project Principal
Mark Abbott
Data Analysts
Kathy Jacob
Seth Asante
Graphics
Kenneth Dumas
Kim DeLauri
Cover Design
Jane Gillis
The preparation of this document was supported
by the Federal Highway Administration through
MHD 3C PL contracts #89787 and #84080.
Central Transportation Planning Staff
Directed by the Boston Region Metropolitan
Planning Organization (MPO). The MPO is composed of
state and regional agencies and authorities, and
local governments.
March 2017
Chapter 2—Background and Objectives
Chapter 3—Characteristics of the Corridor
Chapter 4—Existing Transportation
Chapter 5—Existing Conditions Analyses
Chapter 8—Conclusion and Next Steps
The Boston Region Metropolitan Planning Organization (MPO) selected Route 1A, and other roadways in and surrounding the Vinnin Square area in the Town of Swampscott, City of Salem, and Town of Marblehead, as the subject of a corridor study in federal fiscal year (FFY) 2016. The Route 1A-Vinnin Square Priority Corridor Study focuses on one of the locations identified in a regional needs assessment—conducted as part of the MPO’s Long-Range Transportation Plan, Charting Progress to 2040—used to guide investment decisions regarding transportation infrastructure improvements in the Boston region. The MPO prioritized this location for study after considering a number of factors: the need to address poor safety conditions and traffic congestion; the desire to enhance multimodal transportation; the need to maintain regional travel capacity; the interest in ensuring that, over time, corridor studies are funded in all subregions of the MPO’s planning area; and the potential for recommendations from the study to be implemented.
Vinnin Square is a large commercial district and residential area of multi-family homes located primarily in Swampscott and including a section of Salem. Traffic from Vinnin Square directly impacts Marblehead. Commercial and residential development has significantly increased in the past decade, and will possibly continue to expand into Marblehead. As a result, there are a growing number of pedestrians and bicyclists in Vinnin Square; however, the current roadway configurations there inhibit walking and bicycling, and traffic safety, congestion, and mobility have become challenging issues.
The MPO staff, working with the study’s advisory task force, developed improvements that would transform Route 1A and the ancillary streets around it into pedestrian- and bicyclist-friendly roadways, as well as a transportation corridor that serves all modes of transportation and maintains regional travel capacity. This study provides the City of Salem, the Towns of Marblehead and Swampscott, the Massachusetts Department of Transportation (MassDOT), and other stakeholders an opportunity to review, at a conceptual level, what would be required to address the deficiencies of Route 1A and the ancillary streets, before committing design and engineering funds to a roadway improvement project.
This report summarizes the analyses and recommendations from the study. The first sections describe the existing conditions in the study area and the problems that were identified. The following sections provide an assessment of the safety and operational problems, and discuss the potential improvements. The report also includes technical appendices, which cite the methods used and data applied in the study, including detailed reports about intersection capacity analyses. If implemented, the report’s recommendations would result in an improved roadway corridor where it is safe to walk or bicycle to the shops and businesses in Vinnin Square, recreational areas, and workplaces, and where traffic operates efficiently.
During the past five years, the Boston Region Metropolitan Planning Organization (MPO) has conducted five studies of priority corridors identified through the Needs Assessment of the Long-Range Transportation Plan (LRTP), and municipalities have been receptive to them.1 The studies provide cities and towns with the opportunity to review what is needed to improve a specific arterial segment, starting at the conceptual level, before committing design and engineering funds to a project. After reviewing the options, if a city or town initiates a project that qualifies for state and federal funds, the study’s documentation may be useful to both the Massachusetts Department of Transportation (MassDOT) and the project proponent. The information provided in the study’s report is useful for completing MassDOT Highway Division’s project initiation forms, identifying problems along the corridor, justifying the need for improvements and for funding resources, and providing improvement concepts to advance into preliminary design and engineering.
The existing needs for all transportation modes in the MPO region were identified as part of the Needs Assessment of the LRTP, which guides the process of deciding which projects to fund in future Transportation Improvement Programs (TIPs). Current mobility needs in the MPO region, listed in the current LRTP, are as follows:
Based on previous and ongoing transportation-planning work—including the MPO’s Congestion Management Process (CMP) and MPO planning studies—MPO staff identified several priority arterial roadway segments that require maintenance, modernization, and safety and mobility improvements, and listed them in the LRTP. To address the problems that exist in some of these arterial segments, a study was included in the federal fiscal year (FFY) 2016 Unified Planning Work Program (UPWP).2 Through this study, MPO staff recommend conceptual improvements for one or more corridors, or several small sections within a corridor, which were identified in the CMP and LRTP Needs Assessment process. MPO staff select locations for study—considering municipal, subregional, and other public feedback—and collect data, conduct technical analysis, and recommend improvements. Recommendations from the study are sent to implementing agencies, which may choose to fund improvements through various federal, state, and local sources, separately or in combination.
By focusing on arterial segments rather than intersections, planners can evaluate multimodal transportation needs comprehensively with the goal of creating “complete streets.” A holistic approach to analyzing problems and forming recommendations ensures that the needs of all roadways users—including pedestrians, bicyclists, motorists, and transit riders—are considered. Ultimately, this will result in roadways where it is safe to cross the street and walk or cycle to shops, schools, train stations, and recreational facilities, and where buses can run on time. Typically, the recommended improvements are within a roadway’s right-of-way and they take into account the needs of abutters and roadway users, and the interests and support of stakeholders.
Chapter 2—Background and Objectives
Following a selection process based on safety conditions,3 congested conditions,4 multimodal significance,5 regional significance,6 regional equity,7 and implementation potential,8 the Route 1A-Vinnin Square Priority Corridor Study in the City of Salem and Towns of Marblehead and Swampscott was selected and approved for study on April 2, 2015, by the MPO. The study location was selected from a list of 54 arterial segments in 39 municipalities in the MPO region.9 A copy of the technical memorandum about the selection process is included in Appendix A. MassDOT Highway Division District 4, MassDOT Office of Transportation Planning, the City of Salem, and the Towns of Marblehead and Swampscott supported the study of the Vinnin Square area. They participated by collecting data needed for the analyses, reviewing documentation on existing conditions, identifying problems, and developing improvements to mitigate the problems.
Figure 1 shows a regional map with the arterial roadway segments in the study area indicated in red (all figures are included at the end of the report). Vinnin Square is a large commercial district—made up of three large shopping areas with large chain stores, restaurants, and medical and office complexes—and residential area with numerous multi-family developments located primarily in Swampscott and a section of Salem. Traffic from Vinnin Square directly impacts Marblehead.
Vinnin Square is largely served by Route 1A (Paradise Road in Swampscott and Loring Avenue in Salem) and ancillary streets, including Essex Street, Tedesco Street, and Vinnin Street. All of the streets have two-lanes and widen at the major signalized intersections to include turn lanes. Over the past two decades, Vinnin Square has seen a high concentration of commercial and multi-family development. Swampscott, most noticeably, has seen a marked increase in development activity, which the town has encouraged in order to improve the viability of this commercial district. As a result, there is a growing number of pedestrians and bicyclists in Vinnin Square, and traffic safety, congestion, and mobility have become challenging issues. In addition, substantially more people from the neighboring residential areas on Route 1A, Loring Avenue, Essex Street, and Tedesco Street are walking, bicycling, and riding buses, and conditions for these users are expected to worsen in the future because of increasing congestion and lack of pedestrian and bicycle amenities.
The City of Salem and the Towns of Marblehead and Swampscott are envisioning a safe transportation network that would transform Vinnin Square into a vibrant area linking all three communities and that would balance the needs of motorists with the needs of pedestrians and bicyclists by increasing the quantity and quality of infrastructure for walking, biking, and bus transit.10
The goal is to improve the existing transportation system and make it more efficient by reducing congestion, increasing safety for motorists, pedestrians, and bicyclists; improving connectivity by closing gaps in the sidewalk network; providing continuous and usable shoulders or bike lanes; and connecting people to places to support economic activities and livable communities. Towards that end, the objectives of this study were as follows:
An advisory task force—composed of representatives from the City of Salem, Towns of Swampscott and Marblehead, MassDOT, and interest groups—was established to participate in this study. MPO staff met with the task force twice. In the first meeting they discussed the work scope and existing problems, such as lack of accommodation for bicyclists, long crosswalks, lack of pedestrian refuge areas, and high speeds of vehicles. In the second meeting, MPO staff presented the existing conditions, analyses, proposed improvements, and obtained comments. This report reflects the task force’s feedback. Appendix A includes a list of task force members and their comments.
Chapter 3—Characteristics of the Corridor
The roadways which were the focus of this study are shown in Figure 2 and listed below:
Figure 3 shows the roadway jurisdiction, which identifies the authority and obligation of agencies to administer, control, construct, maintain, and operate a highway subject to the provisions of the Commonwealth of Massachusetts. When an agency has jurisdiction of a street or highway, that agency is responsible for the upkeep of that highway, including reconstruction, signing, and maintenance. All of these responsibilities remain with the agency until the jurisdiction is transferred to another authority.
Figure 4 shows the functional class of the roadways in and around the study area. The functional class identifies a roadway according to the character of traffic service that it is intended to provide and the degree of access to the roadway (access control). There are three roadway functional classifications: arterial, collector, and local roads. Arterial roadways provide the highest level of service for the longest uninterrupted distance, with some degree of access control. Collector streets provide a less highly developed level of service at a lower speed for shorter distances by collecting traffic from local roads and connecting them with arterials. Local roads primarily provide direct access to abutting land parcels, such as residential areas.
The 2.5 mile section of Route 1A (Paradise Road and Loring Avenue) in the study area is a two-lane undivided roadway with turn lanes at designated locations (mostly at signalized intersections). The roadway is directionally designated as a north-south principal arterial roadway under the jurisdiction of MassDOT. It connects Salem and several communities to the north—Danvers, Peabody, and Wenham—as well as Swampscott and several cities to the south—Lynn, Revere, Boston, Chelsea, and Everett. In addition, Route 1A provides access to Marblehead to the east via Tedesco Street. Route 1A is part of the National Highway System (NHS) program; as such, projects to improve Route 1A are eligible for federal funds. Route 1A serves regional and local traffic, the right-of-way varies between 50 and 60 feet wide in the study area, and the posted speed limit varies from 30 to 35 miles per hour (mph) in both directions.11The land uses adjacent to the roadway are mixed—commercial, residential, and recreational.
The segment of Essex Street and Loring Avenue in the study area is approximately 0.75 miles long. The two roadways create a continuous artery, and thus are both directionally designated as north-south arterial roadways under the jurisdictions of the City of Salem (for Loring Avenue) and Town of Swampscott (for Essex Street). Both are two-lane undivided roadways with turn lanes at the signalized intersections. They connect to Vinnin Square and serve regional and local traffic. Both roadways are classified as minor arterials and they are not part of the NHS program. The right-of-way varies between 46 and 55 feet wide, and the posted speed limit is 30 mph in both directions. The land uses adjacent to the roadway are mixed—commercial, residential, and cemetery.
The segment of Tedesco Street and Vinnin Street in the study area is approximately 0.8 miles long. The two roadways create a continuous artery, and thus are both directionally designated as east-west arterial roadways under the jurisdictions of the Town of Marblehead (for Tedesco Street) and Town of Salem (for Vinnin Street). Both are two-lane undivided roadways with turn lanes at the signalized intersections. Both roadways, east of Route 1A, are classified as principal arterials on the NHS program, thus projects to improve them are eligible for federal funds. The right-of-way varies between 40 and 48 feet wide, and the posted speed limit is 35 mph in both directions. The land uses adjacent to both streets are mixed— residential, recreational, and commercial.
The approximately 0.3 mile section of Salem Street in the study area is a two-lane undivided roadway. The roadway is directionally designated as a north-south minor arterial roadway under the jurisdiction of the Town of Swampscott. Salem Street provides access to Vinnin Square and it connects via Vinnin Street and Sunbeam Lane. The roadway is classified as a minor arterial and it is not on the NHS program. The right-of-way is about 50 feet wide and the posted speed limit is 30 mph in both directions. The land uses adjacent to the roadway are mixed—commercial, recreational, and residential.
Several minor arterials, collector streets, business driveways intersect Route 1A, Essex Street, and Tedesco Street to form signalized intersections. These intersections, shown in Figure 5, are described below. The intersections are listed from south to north.
Ellis Road is a city-owned local street in Swampscott that intersects Route 1A to form a four-leg signalized intersection. MassDOT has jurisdiction over this intersection and is responsible for implementing improvements to the intersection. Each of the approaches to the intersection has one travel lane. The intersection is equipped with an Eagle DP 300 signal controller and has a semi-actuated traffic-control system with functioning push-button pedestrian signals. The signal equipment lacks an Opticom system for emergency preemption. The traffic signal heads are mounted on a mixture of mast-arm and post mounts. There are crosswalks on all legs of the intersection; however, the curb ramps do not meet MassDOT or American with Disabilities Act (ADA) standards as they lack detectable warning plates. A bus stop is located on each side of Route 1A south of the intersection. The land uses adjacent to the intersection are primarily residential, although, the Clarke Elementary School is located in the northwest corner of the intersection.
The driveway to Vinnin Liquors and Whole Foods is privately owned. It intersects Route 1A to form a three-leg signalized intersection. MassDOT, which has jurisdiction over this intersection, is responsible for implementing improvements to it. Each of the Route 1A approaches has one through travel lane in each direction and an exclusive left-turn lane on the southbound approach. The Vinnin Liquor and Whole Foods driveway has two travel lanes on its approach: one for left turns and one for right turns. The intersection is equipped with a Peek 3000E signal controller and has a fully actuated and coordinated traffic control system with functioning push-button pedestrian signals and an Opticom system for emergency preemption. The signal heads are mounted on a mixture of mast-arm and post mounts. There are crosswalks with curb ramps, but they do not meet MassDOT or ADA standards because they lack detectable warning plates. A bus stop is located on each side of Route 1A, but there are no bus stop signs, shelters, or benches. The intersection curb radii are adequate for trucks and buses servicing commercial and retail businesses in the area. The land uses adjacent to the intersection are mixed—commercial and residential.
The driveways to Swampscott Mall and Vinnin Square Plaza are privately owned. They intersect Route 1A to form a four-leg signalized intersection. MassDOT has jurisdiction over this intersection. It is one of the critical intersections in the corridor as there are high traffic volumes on both Route 1A and the driveways. Near the intersection, Route 1A has two lanes on the northbound approach (an exclusive left-turn lane and through/right-turn lanes) and three lanes on the southbound approach (an exclusive left-turn lane, through lane, and exclusive right-turn lane). The Swampscott Mall driveway has three travel lanes on the approach (an exclusive left-turn lane, through lane, and exclusive right-turn lane), while the Vinnin Square Plaza driveway has two travel lanes (an exclusive left-turn lane and through/right-turn lanes). The intersection is equipped with a Peek 3000E signal controller and has a fully actuated and coordinated traffic signal system with an Opticom system for emergency preemption. The signal heads are mounted on a mixture of mast-arm and post mounts. There are functioning push-button pedestrian signals only for crossing Route 1A. There are no crosswalks or push-button pedestrian signals for crossing either of the mall driveways. The curb ramps do not meet MassDOT’s standards because they lack detectable warning plates. A bus stop is located on each side of Route 1A, but neither has a shelter. The intersection curb radii are adequate for trucks and buses servicing commercial and retail businesses in the area. The land use in the vicinity is commercial.
Essex Street and the Swampscott Mall driveway intersect to form a three-leg signalized intersection. The Town of Swampscott has jurisdiction over this intersection. Each of the Essex Street approaches has two travel lanes: on the southbound approach (an exclusive left-turn lane and a through lane) and on the northbound approach (an exclusive right-turn lane and a through lane). The mall driveway has two travel lanes at the approach: one for left turns and one for right turns. The intersection is equipped with a Peek 3000E signal controller and has a fully actuated traffic signal system with functioning pedestrian signals. The signal heads are mounted on a mixture of mast-arm and post mounts. There are crosswalks with curb ramps, but the ramps do not meet MassDOT or ADA standards because they lack detectable warning plates. A bus stop is located on each side of Essex Street, but neither has a shelter. The intersection curb radii are adequate for trucks and buses. The land uses near the intersection are mixed—commercial and industrial.
Vinnin Street is a city-owned minor collector in Salem that intersects Route 1A to form a four-leg signalized intersection. MassDOT has jurisdiction over this intersection. Each of the Route 1A approaches has two travel lanes (a shared through/left-turn lane and a shared through/right-turn lane). Vinnin Street has two travel lanes on the eastbound approach (an exclusive left-turn lane and a through/right-turn lane) and three lanes on the westbound approach (an exclusive left-turn lane, through lane, and exclusive right-turn lane). The intersection is equipped with a Peek 3000E signal controller and has a fully actuated and coordinated traffic control system with functioning push-button pedestrian signals. An Opticom system for emergency preemption has been installed. The signal heads are mounted on mast-arm mounts. There are crosswalks with curb ramps, but they do not meet MassDOT or ADA standards because they lack detectable warning plates. A bus stop is located on each side of Route 1A, but neither has a shelter with a bench. The intersection curb radii are adequate for trucks and buses servicing commercial business activities. The land uses in the area are commercial—mostly retail services.
Vinnin Street intersects Loring Avenue, a city-owned street, to form a four leg signalized intersection. The City of Salem has jurisdiction over the roadways and the intersection. Loring Avenue’s southbound approach has two travel lanes (an exclusive left-turn lane and through/right-turn lane) and three travel lanes on the northbound approach (an exclusive left-turn lane, through lane, and exclusive right-turn lane). Vinnin Street has two lanes on the westbound approach (an exclusive left-turn lane and through/right-turn lane) and one lane on the eastbound approach for all traffic movements. The intersection is equipped with a Peek 3000E signal controller and has a fully actuated and coordinated traffic signal system with functioning push-button pedestrian signals. The signal equipment has an Opticom system for emergency preemption. The signal heads for the traffic movements are mounted on mast-arm mounts. There are crosswalks with curb ramps, but the curb ramps do not meet MassDOT or ADA standards because they lack detectable warning plates. A bus stop is located on each side of Loring Avenue, but neither has a bus shelter. The intersection curb radii are adequate for trucks and buses. The land uses in the area are mixed commercial and residential.
Route 1A’s local name changes at the Salem-Swampscott line from Loring Avenue on the Salem side to Paradise Road on the Swampscott side. Loring Avenue intersects Route 1A to form a three-leg signalized intersection. MassDOT has jurisdiction over this intersection. Each of the approaches at the intersection has two travel lanes: the northbound approach has an exclusive left-turn lane and through lane; the southbound approach has a through lane and exclusive right-turn lane; and the eastbound approach has an exclusive left-turn lane and exclusive right-turn lane. The intersection is equipped with a Peek 3000E signal controller and has a fully actuated and coordinated traffic signal system with functioning push-button pedestrian signals. The signal heads are mounted on a mixture of mast-arm and post mounts and the equipment includes an Opticom system for emergency preemption. There are crosswalks with curb ramps at all corners of the intersection, but the curb ramps do not meet MassDOT or ADA standards because they lack detectable warning plates. A bus stop is located on each side of Route 1A north of the intersection, but neither has a bus shelter. The intersection curb radii are adequate for trucks and buses. The land uses near the intersection are commercial and residential.
Salem Street is a city-owned minor arterial in Salem that intersects Vinnin Street to form a three-leg signalized intersection. The City of Salem has jurisdiction over this intersection. Each approach of Vinnin Street has two lanes: the eastbound approach has an exclusive right-turn lane and through lane, and the westbound approach has a shared through/left-turn lane and through lane. Salem Street’s northbound approach has two lanes, an exclusive left-turn lane and exclusive right-turn lane. The intersection is equipped with a Peek 3000E signal controller and has a fully actuated traffic signal system with functioning pedestrian signals and an Opticom system for emergency preemption. The signal heads are a mixture of mast-arm and post mounts. There are crosswalks with curb ramps, but the curb ramps do not meet MassDOT or ADA standards because they lack detectable warning plates. A bus stop is located on each side of Salem Street. The intersection curb radii are adequate for trucks and buses. The land uses near the intersection are commercial and recreational.
Leggs Hill Road is a town-owned collector street in Marblehead that intersects Tedesco Street to form a three-leg unsignalized intersection. The Town of Marblehead has jurisdiction over this intersection. All of the Tedesco Street approaches and Leggs Hill Road’s southbound approach have one lane for all traffic movements. Tedesco Street is the major street at the intersection and its traffic is not controlled. Leggs Hill Road is the minor street and its traffic is controlled by a stop sign. The Town of Marblehead recently installed a crosswalk on Tedesco Street that is equipped with a rectangular rapid flash beacon, but Leggs Hill Road still lacks a crosswalk. There are curb ramps at the intersection, but they do not meet MassDOT’s standards since they do not have detectable warning plates. The land use near the intersection is residential.
Leggs Hill Road is a city-owned collector road in Salem that intersects Route 1A to form a three-leg unsignalized intersection. MassDOT has jurisdiction over this intersection. The intersection is located in a sharp horizontal curve that limits sight lines and distances for drivers on Route 1A. At the intersection, each approach of Route 1A has two lanes: the northbound approach has a through lane and right-turn lane, and the southbound approach has a through lane and left-turn lane. Leggs Hill Road westbound has one lane on its approach serving all traffic movements. Route 1A is the major street at the intersection and its traffic is not controlled. Leggs Hill Road is the minor street and its traffic is controlled by a stop sign. There is a sidewalk on the east side of Route 1A, but none on the west side. The sidewalk has curb ramps at Leggs Hill Road, but the curb ramps do not meet MassDOT or ADA standards because they lack detectable warning plates. The crosswalk on Route 1A is located south of the intersection because of a horizontal curve that limits sight distance on Route 1A. There is no crosswalk on Leggs Hill Road connecting the sidewalks. A bus stop is located on each side of Route 1A. The intersection curb radii are adequate for trucks and buses. The land uses near the intersection are recreational and educational.
Harrison Road is a city-owned road in Salem that intersects Route 1A to form a three-leg signalized intersection. MassDOT has jurisdiction over this intersection. The Route 1A approaches at the intersection have two lanes: the northbound approach has an exclusive left-turn lane and through/right-turn lane, and the southbound approach has an exclusive right-turn lane and through lane. Harrison Road’s eastbound approach has one lane serving all traffic movements. The intersection is equipped with a TCT LMD 9200 signal controller and has a fully actuated and uncoordinated traffic signal system with functioning pedestrian signals, and an Opticom system for emergency preemption. The signal heads are mounted on mast-arm mounts. There are sidewalks on both sides of Route 1A and Harrison Road and crosswalks with curb ramps for crossing both streets, but the curb ramps do not meet MassDOT or ADA standards because they lack detect warning plates. A bus stop is located on each side of Route 1A south of the intersection; despite the large number of bus boardings and alightings at these stops, there are no shelters. The intersection curb radii are adequate for trucks and buses. The land uses near the intersection are residential and educational; Harrison Road provides access to the Salem State University South Campus, which in the future will become the new site for the Horace Mann Laboratory School.
.
Pickman Road is a city-owned street that intersects Route 1A to form a three-leg signalized intersection. MassDOT has jurisdiction over this intersection. The Route 1A approaches have one lane serving all traffic movements at each approach. Pickman Road’s eastbound approach has one lane serving all traffic movements. The intersection is equipped with an EPAC 300 signal controller and has a semi-actuated, uncoordinated traffic signal system with functioning pedestrian signals. The signal heads are mounted on both mast-arm and post mounts. The signal system has no Opticom system for emergency preemption. There are sidewalks on both sides of Route 1A and Pickman Road and crosswalks with curb ramps for crossing both streets, but the curb ramps do not meet MassDOT or ADA standards because they lack detectable warning plates. A bus stop is located on each side of Route 1A at the intersection. The intersection curb radii are adequate for trucks and buses. The land use near the intersection is primarily residential.
The map in Figure 6 shows the general land-use designation for the area surrounding the roadways that are the focus of this study. The land uses include, but are not limited to, residential, commercial, educational, park and recreation, and cemetery. Based on discussions with representatives from Marblehead, Salem, and Swampscott, the following are the recent and planned developments in the area that impact the area’s traffic flow.
The City of Salem and the Towns of Marblehead and Swampscott expect redevelopment of some of the existing land parcels in the vicinity of Vinnin Square. Over the past decade, Vinnin Square has seen a high concentration of commercial and multi-family home development. Most notably, Swampscott has seen a marked increase in development activity, which the town has encouraged in order to improve the viability of this commercial district. In addition, the vacant parcel of land adjoining the Tedesco Country Club, which is part of an overlay district in both Marblehead and Salem, is zoned to allow for high-density residential development of 30 units per acre. Redevelopment of existing and vacant parcels is expected to continue at Vinnin Square into the future.
Salem State University and the City of Salem have plans to move the
Horace Mann Laboratory School, which is currently located off of Route 1A (Loring Avenue) at the North Campus, to the South Campus off Harrison Road. According to the Salem News, Sasaki Associates, a planning firm based in Watertown, has been hired by the University to help put together plans for the University's North Campus.12 Moving the Horace Mann Laboratory School to the South Campus would impact traffic on Route 1A, as access to Harrison Road is only available via Route 1A. The move would require that a comprehensive Safe Routes to School (SRTS) study be undertaken to identify appropriate routes to the new school, the needs of pedestrians and bicyclists, and safety improvements that would encourage students and parents to walk and bike to school. As Route 1A is the primary roadway connecting to Harrison Avenue, this section of Route 1A would need improvements to accommodate school buses and the additional traffic to the site during school openings and closings. Safety for pedestrians and bicyclists when crossing Route 1A is a priority and should be evaluated in light of the school swap. This study looked at improvements on Route 1A that would benefit or facilitate the school swap, but a comprehensive SRTS study is needed to address impacts on other streets.
Figure 7 shows the planned projects and previous studies that addressed the study area or its surroundings. The improvements developed in this study considered and incorporated recommendations from the previous studies.
The Canal Street Rail Trail project will construct 0.6 miles of shared-use, off-road path to close the gap between the Marblehead Rail Trail and the shared-use path that extends from Canal Street to Mill Street in Salem. The new trail will be 10 feet wide with two-foot shoulders. The project includes the relocation of a railroad spur. Funding for the project is programmed in the Boston Region MPO’s FFY 2019 TIP. As of March 16, 2016, the project was at the 25 percent design stage.13
The improvements to Canal Street include reconstruction of the roadway pavement, curbing, and sidewalks. Wheelchair ramps and pedestrian crossings will be added where appropriate to improve pedestrian safety. Additional improvements, such as tree plantings and ornamental lighting, and curb extensions will be incorporated. Pavement markings will be painted to define the parking areas and provide defined shoulder areas for use by bicyclists. Drainage improvements will be constructed, the roadway crown will be adjusted to provide a consistent cross slope, and locations that have settled will be repaired. Driveway access issues will be more clearly defined so that ways to improve safety for vehicles entering and exiting local businesses can be identified. Traffic signals at Mill Street and Washington Street and at Loring Avenue and Jefferson Avenue will be updated. This project was under construction as of October 15, 2016.14
In collaboration with the City of Salem, the Salem State University Police Department, and MassDOT, a road safety audit (RSA) was conducted along the segment of Route 1A between Intervale Road and Harrison Road in Salem.15 The RSA was conducted in response to concerns from the city and the university regarding safety along this section of roadway. Thirty-three crashes occurred on the roadway segment in the span of approximately three and a half years, including a fatal crash in June 2013 in which a pedestrian died. The crash rate for the segment is about 2.0 crashes per million vehicles entering, which is below the state average for principal arterials. The purpose of this RSA was to identify both short- and long-term safety improvements that could be made to increase safety along the corridor. Potential short-term, low-cost improvements could be considered by the responsible agency for immediate implementation, as appropriate. The Route 1A-Vinnin Square Priority Corridor Study considered the recommendations of the RSA in developing proposed improvements for that section of Route 1A.
MassDOT identified the segment of Route 1A (Paradise Road) at the Swampscott Mall as a high crash cluster location for vehicles, based on 2010-12 crash data. Because it is a high-crash location, MassDOT required a RSA to be conducted.16 Recommendations from the RSA are expected to be incorporated into MassDOT project number 607761, which primarily consists of improvements to Route 1A at the intersection of Swampscott Mall and Vinnin Square Plaza. The Route 1A-Vinnin Square Priority Corridor Study considered the recommendations of the RSA in developing proposed improvements for that section of Route 1A.
The purpose of this traffic impact study is to evaluate existing and projected traffic, operational, and safety conditions in the vicinity of the proposed assisted-living residential development located at 224 Salem Street in Swampscott, and identify measures to mitigate potential project‐related traffic impacts on the surrounding roadways, if necessary. McMahon Associates reviewed the existing traffic operations and potential traffic impacts from the new facility and, based on the analysis, determined that the projected traffic increases associated with both the background traffic growth (traffic volumes projected for the area) and the traffic generated by the new assisted-living facility could be accommodated on the roadways in the area. In addition, the study determined that with the proposed facility in place, safe and efficient access will be provided to the site.17
Chapter 4—Existing Transportation
MassDOT Highway Division’s Traffic Data Collection Section performed turning movement counts (TMCs) at the intersections in the study area in April 2016, while schools were in session. The counts were conducted during the weekday AM peak travel period (7:00 AM–9:00 AM), the weekday PM peak travel period (4:00 PM–6:00 PM), and the Saturday midday travel period (12:00 AM–2:00 PM). Heavy vehicles such as school buses, transit buses, and trucks were counted separately. Pedestrian and bicycle counts were conducted simultaneously with the TMCs.
In addition, the Traffic Data Collection Section conducted automatic traffic recorder (ATR) counts at five locations on Route 1A, Essex Street, Tedesco Street, and Salem Street. The ATR counts are continuous 48-hour traffic counts used to determine the average weekday traffic (AWDT) on a roadway. The Traffic Data Collection Section also collected spot-speed data at the same five locations. Similar to the ATR counts, the spot-speed data are continuous 48-hour records. The TMC, AWDT, and spot-speed data are included in Appendix B.
Figure 8 shows the AWDT at the five locations. The AWDT value ranges are as follows:
Figure 9 shows the daily distribution of the hourly traffic volumes at the five locations. The daily distributions show peak-period volumes in the range of 800 to 1,000 vehicles per hour (vph) in both directions of Route 1A. Outside of the AM and PM peak periods, the traffic volumes in each direction of Route 1A are in the range of 400 to 600 vph. The estimated capacity of a two-lane roadway is about 800 to 1000 vph per direction, and the capacity of a four-lane roadway is about 1,600 to 1,800 vph per direction. Therefore a two-way, two-lane roadway should be adequate for traffic on Route 1A and the ancillary streets, except at the signalized intersections where turn lanes are justified.
Figure 10 shows the turning movement volumes at the major intersections during the weekday AM peak hour (7:30-8:30 AM), weekday PM peak (4:45 PM-5:45 PM), and Saturday PM peak (12:00-1:00 PM). Based on the turning movement volumes, MPO staff determined the following:
Table 1 presents the number of pedestrians observed at the major intersections in the study area during the two-hour weekday AM peak period and the two-hour weekday PM peak period on Tuesday, April 12, 2016, and the two-hour Saturday PM peak period on April 9, 2016. These volumes may be low because of the colder than usual weather in April and the high traffic volume during peak periods. Nonetheless, significant pedestrian activity was observed in the corridor as people walked to access residential and recreation areas, schools, and commercial services.
TABLE 1
Pedestrian and Bicycle Volumes
| Intersection |
Pedestrians |
Bicyclists |
|---|---|---|
Route 1A at Ellis Road |
98 |
7 |
Route 1A at Vinnin Liquor Driveway |
42 |
4 |
Route 1A at Swampscott Mall |
58 |
3 |
Route 1A at Vinnin Street |
42 |
2 |
Route 1A at Loring Avenue |
18 |
7 |
Route 1A at Leggs Hill Road |
11 |
7 |
Route 1A at Harrison Road |
32 |
11 |
Route 1A at Pickman Road |
24 |
0 |
Essex Street and Swampscott Mall Driveway |
30 |
8 |
Loring Avenue at Vinnin Street |
21 |
4 |
Vinnin Street at Salem Street |
8 |
5 |
Tedesco Street at Leggs Hill Road |
9 |
4 |
Source: Central Transportation Planning Staff.
Table 1 presents the number of bicyclists observed at the major intersections in the study area during the two-hour weekday AM peak period and the two-hour weekday PM peak period on Tuesday, April 12, 2016, and the two-hour Saturday PM peak period on April 9, 2016. These volumes may be low because of the colder than usual weather in April, high traffic volume during peak periods, and the lack of amenities that provide safety and comfort for bicyclists, such as functioning shoulders or bike lanes. Despite these adverse conditions, the counts indicate that bicyclists are using the area roadways.
The percentage of heavy vehicles (light-goods vehicles, buses, single-unit trucks, and semi-trucks) observed at the intersections ranges between 2.0 and 5.0 percent of the total traffic on a weekday and between 1.0 and 3.0 percent on a Saturday. These rates are not considered particularly high for peak-period traffic conditions. The percentages of heavy vehicles are included in the TMC in Appendix B.
Figure 11 shows the results of the spot-speed data collected on the roadways in the study area. Spot speeds are vehicle speeds observed at a specific location. The data gathered in spot-speed studies are useful for making decisions about safety applications, such as setting speed limits, evaluating speed problems, and assessing speed as a contributing factor in crashes. The average spot speeds observed in the corridor range between 25 and 32 mph, close to the 30 mph posted speed limit, except for the segment of Route 1A in the vicinity of Leggs Hill Road in Salem, where the average spot speed was 36 mph. In addition, 85 percent of the drivers were travelling at 37 mph or slower, except for the segment of Route 1A in the vicinity of Leggs Hill Road, where the drivers travelled at 42 mph. The spot-speed data indicated that about 62 percent of the drivers travel between 29 and 39 mph, which is known as the 10-mph-pace speed. The data and analysis shows that the observed speeds on the Route 1A segment in the vicinity of Leggs Hill Road are considerably higher than the posted speed limit.
MassDOT provided the MPO staff with the existing signal timings, as-built traffic signal plans, and signal-phase sequences of the signalized intersections (included in Appendix C). MPO staff used Google Maps and field visits to identify recent modifications to the intersection layouts and signal plans. The information was used to analyze existing traffic operations conditions.
There are several public transportation services operating in the study area, including bus and commuter rail services. These are displayed in Figure 12, a transit service map. The MBTA operates four bus routes in the study area:
These services connect the communities in the study area to Central Square Station in Lynn on the Newburyport Commuter Rail Line; Wonderland Station on the Blue Line in Revere; Logan Airport in East Boston; and downtown Boston, including South Station. Routes 441 and 448 operate Monday through Friday every 15 minutes from 5:13 AM to 12:28 AM, and Saturday and Sunday every 30 minutes from 6:06 AM to 12:39 AM. Routes 455 and 459 operate Monday through Friday every 20 minutes from 5:10 AM to 12:30 AM, and Saturday and Sunday every 30 minutes from 6:05 AM to 11:35 PM. The schedules of the four bus routes are included in Appendix D.
Figure 13 shows the bus stop locations and number of riders (boarding and alighting) at the heavily used stops. Only one stop in the entire study area had a bus shelter (Essex Street at Carol Way). The lack of bus shelters creates inconveniences for passengers, especially during inclement weather.
Table 2 shows the results of the evaluation of bus routes as measured against the MBTA’s service standards for span of service (hours during which the service operates), frequency of service, vehicle loading (passenger crowding based on the number of passengers to seats), schedule adherence, daily ridership, and average number of passengers per trip. These standards establish acceptable levels of service required to meet the MBTA’s service objectives for accessibility, reliability, safety and comfort, and cost effectiveness of service. The evaluation was based on the MBTA’s 2010 service delivery policy standards and the spring 2011 schedule.
The performance evaluation showed that MBTA bus Routes 441, 455, and 459 all had high levels of ridership, but all failed the frequency of service and vehicle loading standards; additional resources would be required to bring those routes up to the standard. Bus Route 448 had low ridership and failed the span of service standard.
TABLE 2
Bus Service Evaluation, 2010–11
| Route |
Route Description |
Span of Service |
Frequency of Service |
Vehicle Loading |
Schedule Adherence |
Daily Ridership |
Average Number of Passengers per Trip |
|---|---|---|---|---|---|---|---|
441 |
Marblehead – Haymarket (Boston) or Wonderland Station (Revere) via Paradise Road |
Pass |
Fail |
Fail |
49.0% |
1,442 |
37 |
448 |
Marblehead – Downtown Crossing (Boston) |
Fail |
Pass |
Pass |
49.0% |
162 |
32 |
455 |
Salem Depot –Wonderland (Revere) via Central Square (Lynn) |
Pass |
Fail |
Fail |
42.0% |
1,797 |
42 |
459
|
Salem Depot – Downtown Crossing via Logan Airport (Boston) and Central Square (Lynn) |
Pass |
Fail |
Fail |
37.0% |
1,085 |
43 |
Notes: The performance standards listed in this chart are defined in the MBTA’s 2010 Service Delivery Policy.
The evaluation was based on the MBTA’s spring 2011 schedule.
“Pass” means the bus service meets the performance standards established for that service standard. “Fail” means the bus service does not meet the performance standards established for that service objective.
“Span” is based on the 2010 service delivery policy standard for the route type and spring 2011 schedule; the goal is local routes weekday span from 7:00 AM to 6:30 PM; correcting this failure would always require additional resources.
“Frequency” is based on 2010 service delivery policy standard for the route type and spring 2011 schedule; the goal is local routes AM and PM peak, 30-minute headway; correcting this failure would always require additional resources.
“Loading” is based on the 2010 service delivery policy and same ridership data used above; the standard is less than 140 percent of seated load averaged over 30-minute period during peak periods and less than 100 percent of seated load averaged over 60-minute period during off-peak periods; correcting this failure would always require additional resources.
“Schedule Adherence” is based on the 2010 service delivery policy (the definition of this service objective varies by frequency of service and time point crossings for start/mid/endpoints of the bus route); percentage shown is the proportion of all time point crossings during fall 2010, which were on time; the goal is 75 percent on time. Correcting this failure would NOT always require additional resources.
Source: Massachusetts Bay Transportation Authority.
The MBTA’s Newburyport/Rockport Commuter Rail Line has stations in Swampscott and Salem. Many of the commuter rail riders from the communities in the study area access the commuter rail stations via Route 1A or Essex Street and Loring Avenue. The MBTA operates a full schedule Monday through Friday from 4:55 AM to 12:00 AM and an abbreviated service on Saturday and Sunday from 7:00 AM to 11:11 PM. (The full train schedules are included in Appendix D.) Peak-period frequency for both the inbound and outbound trains is approximately 40 minutes. The typical weekday boarding (inbound trains) at the Salem Station and Swampscott Station are 2,122 and 884 passengers, respectively.
At Salem Station, the MBTA provides 329 parking spaces; 67 percent of the spaces are utilized on an average day. The City of Salem offers another 120 parking spaces near the station; 88 percent are utilized on an average day. At Swampscott Station the MBTA provides 125 spaces; 90 percent are utilized on an average day. In addition, the Town of Swampscott provides 18 spaces; 100 percent are utilized on an average day. The parking rate is $4.00 daily at both Salem Station and Swampscott Station.
Chapter 5—Existing Conditions Analyses
MPO staff used crash data from MassDOT’s Registry of Motor Vehicles database and from municipal police departments for the time period from January 2011 through December 2014 to evaluate safety for motorists, pedestrians, and bicyclists in the study area. The following sections describe the analyses and results of this safety assessment.
Figure 14 shows the motor-vehicle crash clusters in the study area, and Figure 15 shows the pedestrian- and bicycle-crash clusters. Table 3 presents the crash summaries and crash rates for each cluster. The summary indicates the severity of the crashes; manner of collision; road-surface, ambient-light, and weather conditions at the time of the crashes; number of bicyclists and pedestrians involved; and time of occurrence. The crash data for each individual crash in each cluster is included in Appendix E.
TABLE 3
2011–14 Crash Summary and Crash Rates
| Crash Variable |
Cluster 1 |
Cluster 2 |
Cluster 3 |
Cluster 4 |
Cluster 5 |
Cluster 6 |
Cluster 7 |
|---|---|---|---|---|---|---|---|
Crash Severity |
-- |
-- |
-- |
-- |
-- |
-- |
-- |
Fatal injury |
0 |
0 |
0 |
0 |
1 |
1 |
0 |
Non-fatal injury |
26 |
7 |
24 |
3 |
7 |
17 |
33 |
Property damage only |
35 |
14 |
47 |
12 |
17 |
48 |
11 |
Unknown/not reported |
12 |
0 |
3 |
2 |
0 |
2 |
7 |
Manner of Collision |
-- |
-- |
-- |
-- |
-- |
-- |
-- |
Rear-end |
32 |
11 |
15 |
5 |
13 |
42 |
13 |
Angle |
24 |
0 |
38 |
5 |
5 |
13 |
25 |
Single vehicle crash |
7 |
4 |
5 |
6 |
5 |
7 |
4 |
Sideswipe, same direction |
5 |
2 |
6 |
0 |
1 |
3 |
3 |
Head-on |
3 |
2 |
8 |
1 |
0 |
0 |
1 |
Sideswipe, opposite direction |
2 |
0 |
2 |
0 |
1 |
2 |
1 |
Not reported/unknown |
0 |
0 |
0 |
0 |
0 |
2 |
4 |
Road Surface Conditions |
-- |
-- |
-- |
-- |
-- |
-- |
-- |
Dry |
59 |
13 |
50 |
15 |
21 |
46 |
36 |
Wet |
13 |
5 |
21 |
2 |
5 |
22 |
11 |
Sand, dirt, gravel, and water |
0 |
0 |
0 |
0 |
0 |
0 |
0 |
Snow/ice |
0 |
0 |
3 |
0 |
0 |
0 |
1 |
Not reported/unknown |
1 |
3 |
0 |
0 |
0 |
0 |
3 |
Ambient Light Conditions |
-- |
-- |
-- |
-- |
-- |
-- |
-- |
Daylight |
62 |
15 |
53 |
9 |
22 |
49 |
34 |
Dark, lighted roadway |
10 |
3 |
15 |
8 |
1 |
16 |
9 |
Dark, unlighted roadway |
0 |
1 |
1 |
0 |
1 |
0 |
1 |
Dawn |
0 |
0 |
2 |
0 |
1 |
0 |
1 |
Dusk |
0 |
0 |
3 |
0 |
0 |
3 |
4 |
Not reported/unknown |
1 |
2 |
0 |
0 |
0 |
0 |
2 |
Weather Conditions |
-- |
-- |
-- |
-- |
-- |
-- |
-- |
Clear |
43 |
12 |
46 |
15 |
19 |
46 |
33 |
Cloudy |
17 |
5 |
6 |
1 |
3 |
6 |
8 |
Rain |
10 |
2 |
19 |
1 |
3 |
13 |
7 |
Snow/ice/freezing rain |
0 |
0 |
3 |
0 |
0 |
2 |
1 |
Not reported/unknown |
0 |
2 |
0 |
0 |
0 |
0 |
2 |
Bicyclists and Pedestrians Involved |
-- |
-- |
-- |
-- |
-- |
-- |
-- |
Bicyclist |
0 |
0 |
1 |
2 |
1 |
0 |
0 |
Pedestrian |
1 |
2 |
1 |
0 |
1 |
2 |
2 |
Time Period |
-- |
-- |
-- |
-- |
-- |
-- |
-- |
Peak period |
15 |
3 |
18 |
6 |
2 |
20 |
10 |
Off-peak period |
58 |
18 |
56 |
11 |
23 |
48 |
41 |
Total crashes |
73 |
21 |
74 |
17 |
25 |
68 |
51 |
Four-year average (rounded) |
18 |
5 |
19 |
4 |
6 |
17 |
13 |
Segment crash rate |
7.33 |
2.55 |
4.33 |
3.38 |
2.57 |
6.13 |
2.11 |
Average statewide crash rate for roadway segment (based on functional classification of roadway) |
3.49 |
3.65* |
3.49 |
3.49 |
3.49 |
3.49 |
3.49 |
Note: The AM peak period is 7:00 AM-9:00 AM; the PM peak period is 4:00 PM-6:00 PM.
Cluster 2 is on a minor arterial.
Shading denotes segment crash rate higher than the statewide average.
Source: Central Transportation Planning Staff.
According to the analysis results presented in Table 3, the predominant crash types were rear-end, angle, and single-vehicle crashes. Together, those types of crashes constituted between 75 percent and 85 percent of the crashes in the corridor. Some of the crashes occurred because of motorists failing to yield right-of-way, following too close, and being inattentive or distracted. However, lack of turn lanes contributed to the high number of turn-related crashes on Route 1A at the Swampscott Mall area and Vinnin Square, as seen in Clusters 1 and 3. High vehicular speeds, a sharp horizontal curve, limited sight distance, and inadequate signage also contributed to the crashes in Cluster 5. Also, recurring traffic queues contributed to the high number of rear-end collisions in Clusters 1, 6, and 7. Eleven pedestrian and bicycle crashes occurred at midblock locations or at intersections.
The crash rates for the roadway segments within the crash clusters (segment crash rates) ranged between 2.11 and 7.33 crashes per million vehicles-miles traveled (MVMT). The most recent 2016 statewide average crash rate for an urban principal arterial was 3.49 crashes per MVMT and 3.65 for a minor arterial.18 Crash Clusters 1, 3, and 6 had segment crash rates that exceeded the statewide average for a principal arterial. The segment crash rate for Cluster 2 was below the state average for minor arterials. The segment crash rates for Clusters 4, 5, and 7 were below the state average for a principal arterial.
Figures 16-21 show the collision diagrams for crashes within each crash cluster. MPO staff used available police crash reports to prepare the collision diagrams; however staff were not able to obtain police crash reports for every crash. Therefore, the figures only show those crashes for which a police-drawn sketch of the crash scene was available. Collision diagrams are useful for examining patterns and developing safety strategies. The numbers in the collision diagram uniquely identify each crash and may be used to cross-reference the crash records. The collision diagrams, along with the crash records, are included in Appendix E.
Staff conducted traffic operations analyses consistent with the Highway Capacity Manual (HCM) methodologies.19 HCM methodology is used to assess traffic conditions at signalized and unsignalized intersections and rate the level-of-service (LOS) from A to F. LOS A represents the best operating conditions (little to no delay), while LOS F represents the worst operating conditions (long delay). LOS E represents operating conditions at capacity (the limit of acceptable delay). Table 4 presents the control delays (standards for comparison) associated with each LOS for signalized and unsignalized intersections.
TABLE 4
Intersection Levels-of-Service Criteria, 2010
| Level of Service |
Signalized Intersection Control Delay (seconds per vehicle) |
Unsignalized Intersection Control Delay (seconds per vehicle) |
|---|---|---|
A |
<10 |
<10 |
B |
10-20 |
10-15 |
C |
20-35 |
15-25 |
D |
35-55 |
25-35 |
E |
55-80 |
35-50 |
F |
> 80 |
> 50 |
Source: Highway Capacity Manual 2010.
Using the traffic and signal data collected, MPO staff built traffic analysis networks for the weekday AM and PM peak hours and the Saturday PM peak hours. Synchro traffic simulation software was used to assess the capacity and quality of traffic flow. 20 Figures 22-24 show the results of the existing conditions analyses in terms of LOS and delays for the weekday AM, weekday PM, and Saturday PM peak hours, respectively. The existing conditions LOS analysis worksheets are included in Appendix F.
With the exception of the intersection of Route 1A (Paradise Road) and Vinnin Street, none of the intersections in the corridor appeared to be failing. In general, traffic congestion in the study area was restricted to peak travel periods—because of the high volume of commuter and shopping trips—and confined to the following locations:
The high weekday PM peak period delay on Route 1A at Pickman Road is the result of traffic congestion and queues created at the intersection of Route 1A and Canal Street and Jefferson Avenue. At the time this report was published, this intersection was under construction and the proposed improvements were expected to reduce congestion and queues.
As Vinnin Square developed commercially and residentially in recent years, traffic volumes and the number of pedestrians and bicyclists in the area increased. As a result, traffic safety, congestion, and mobility have become challenging issues. In addition, there is a growing need to improve mobility for residents of the neighborhoods adjacent to Vinnin Square, and to provide connections to enable them to access Vinnin Square and other destinations, such as recreational areas and schools.
Because the study area is large and specific segments of the area’s roadways have unique problems, MPO staff divided the roadways in the study area into segments based on roadway character, land use, crash experience, and jurisdiction and ownership. The resulting roadway segments from south to north are as follows:
For each of the six roadway segments, MPO staff identified the problems and developed recommendations for addressing them. A summary of the problems identified on each segment are presented in Figure 25. They were identified through analyses of traffic and safety data, field reconnaissance, and discussions with the advisory task force. They include, but are not limited to, pedestrian and bicyclist issues, traffic safety and operations problems, and access management and control issues. Figures 26-31 show photographs of some of the problems identified on the roadway segments.
Figures 26, 29, and 30 show some of the challenges facing pedestrians and bicyclists in the study area. The following are some of the reasons why the roadways are considered unfriendly for pedestrians and bicyclists:
Figures 28 and 31 show some of the traffic congestion and operations problems facing motorists. They include the following:
Developing Vinnin Square and the Swampscott Mall into a vibrant destination with direct linkage to surrounding neighborhoods would require roadway, streetscape, and landscape improvements to accommodate all road users. Presently, the numerous driveways along the corridor contribute to many crashes in the square, and a lack of trees and greenery makes an unwelcoming environment for pedestrians and bicyclists.
MPO staff worked with the study’s advisory task force to develop short-term, medium-term, and long-term strategies for addressing the pedestrian and bicyclist issues, traffic safety and operations problems, and access management issues identified in the corridor. The time frame categorized as “short-term” is typically less than five years. Short-term improvements are relatively uncomplicated and inexpensive to implement, and require minimal design efforts. Often maintenance or special funds are used to pay for these improvements. Typical examples of short-term improvements are pavement striping and sign installations. The time frame categorized as “medium-term” is typically between five and 10 years. Medium-term improvements are more complicated than their short-term counterparts and require more funding resources and design and engineering efforts. Examples of medium-term improvements are adding turn lanes at intersections, adding sidewalks, and signal retiming and coordination projects. Long-term improvements are complicated and the time frame for implementation is typically 10 or more years. They require more design and engineering efforts, environmental permitting, and large funding resources. Typical examples of long-term improvements are adding lanes and roadway reconstruction.
Planners typically use a planning model to systematically forecast future traffic volumes based on changes in the transportation network or land use. For this study, staff used the Boston Region MPO’s regional travel demand model set, which was recently adopted for the development of the LRTP. This model’s socioeconomic components are derived from forecasts produced by the Metropolitan Area Planning Council (MAPC). The model is calibrated at a regional level for 164 cities and towns, which includes the 101 cities and towns in the MPO’s planning region. Using this model, staff projected that traffic on Route 1A, Essex Street, and Tedesco Street would grow by five percent between now and 2040. To test the impact the proposed improvements would have on future traffic conditions, staff increased the existing peak-hour turning movement volumes by five percent to develop 2040 projections.
Most of the concepts for improvements that MPO staff developed would be carried out within the existing roadway’s right-of-way—they require no land takings and take into account the needs of abutters and roadway users. The majority of the improvements could be completed in the short-term or medium-term to make the study area’s roadways safer and more attractive to pedestrians and bicyclists, while serving the needs of commuters and supporting economic activities and livable communities. A few of the proposed improvements would involve construction outside of the roadway’s right-of-way. The following sections describe the proposed improvements on each roadway segment, their traffic operations and safety performances, advantages and disadvantages, and cost estimates.
Figure 32 shows the improvements developed for the segment of Route 1A between Ellis Street and Longwood Drive. The proposed improvements would reconfigure the roadway to accommodate bicyclists and make it safer for both pedestrians and bicyclists. The roadway would be reconfigured to include two 11-foot travel lanes, bike lanes, and sidewalks on both sides of the roadway. Additional improvements include reconstruction of the curb ramps to MassDOT’s standards. The proposed roadway would have high visibility crosswalks across all town-owned streets that intersect Route 1A. It is expected that the renovations would make it easier and safer to walk and bike, and fulfill the vision of connecting the neighborhoods to Vinnin Square. The bike lanes would provide greater protection and higher visibility for both bicyclists and motorists, improving safety for all road users.
In addition to the renovations discussed above, providing the following features would modernize the roadway and make it safer and more efficient for all users:
There are no disadvantages associated with the proposed improvements except for impacts on traffic flow during construction that would affect commuters and business activities.
Based on the costs of similar reconstruction projects recorded in MassDOT’s project information database, MPO staff estimate that the proposed improvements would cost between $2 million and $3 million. This estimate includes drainage improvements, sidewalks and ADA-compliant ramp construction, landscape and streetscape renovation, paving and markings, signing, and street lighting.
Four alternatives were developed for the segment of Route 1A from Longwood Drive to Vinnin Street.
Figure 33 shows the proposed improvements in Alternative 1, which would renovate and reconfigure the roadway to make it safer for pedestrians and bicyclists. Alternative 1 would construct a two-way left-turn lane on the segment of Route 1A between the Swampscott Mall driveway and Vinnin Street to make traffic flow safely and more efficiently. The proposed roadway would have two 11-foot travel lanes, an 11-foot two-way left-turn lane, bike lanes, sidewalks on both sides of the roadway, and curb ramps reconstructed to MassDOT’s standards. The proposed roadway would have high visibility crosswalks at the signalized intersections and across all town-owned streets and major driveways that intersect Route 1A. MPO staff recommend the installation of bus shelters at the heavily used MBTA bus stops on Route 1A at the Swampscott Mall intersection. The Town of Swampscott has expressed strong support for this alternative.
Figure 34 shows the improvements proposed in Alternative 2. This alternative has all of the improvements proposed in Alternative 1, except that the two-way left-turn lane would be replaced with a median and an exclusive left-turn lane at the Summit Estates.
Figure 35 shows the proposed improvements in Alternative 3, which would renovate and reconfigure Route 1A to increase capacity and make traffic flow efficiently. Alternative 3 would convert Route 1A into a four-lane roadway by adding a travel lane in each direction beginning at the site of Vinnin Liquor and Whole Foods and ending at Vinnin Street. The proposed roadway would have high visibility crosswalks at the signalized intersections and across all town-owned streets and major driveways that intersect Route 1A. In addition, MPO staff recommend the installation of bus shelters on Route 1A at the heavily used MBTA bus stops at the Swampscott Mall.
Alternative 4, shown in Figure 36, has all of the improvements proposed in Alternative 3, in addition to a median and an exclusive left-turn lane at the Summit Estates on the segment between the driveway to Swampscott Mall and Vinnin Street. The median would provide a pedestrian refuge area and make it safer and easier for pedestrians to cross Route 1A.
In addition to the proposed improvements outlined above, providing the following features would increase safety and modernize Route 1A to serve all users efficiently:
The expected performance of the intersections, after implementation of the proposed improvements, is shown in Figures 37-42. Estimates of LOS and delay are provided for the weekday AM and PM and Saturday PM peak hours.
For each of the alternatives, the signalized intersections on Route 1A at Swampscott Mall would operate satisfactorily during the peak hours. The LOS analysis worksheets are included in Appendix F.
Construction and traffic management issues associated with Alternatives 2, 3, and 4 would impact traffic flow and business activities.
Based on the costs of similar reconstruction projects recorded in MassDOT’s project information database, MPO staff estimate that Alternatives 1 and 2 would each cost between $4 million and $6 million, and that Alternatives 3 and 4 would each cost between $7 million and $10 million.
The estimates exclude the cost of land takings required for the improvements. The estimates include the costs of drainage improvements, paving and markings, signing, accommodation and relocation of utilities, sidewalks and ADA-compliant ramp construction, streetscape amenities, traffic signals and equipment upgrades, and street lighting.
Figure 43 shows the improvements developed for Essex Street and Loring Avenue south of Vinnin Square. The proposed improvements would renovate and reconfigure the roadway to make travel safer and easier for pedestrians and bicyclists. The proposed roadway would include two 11-foot travel lanes, and bike lanes and sidewalks on both sides of the roadway. Sidewalks and curb ramps would be renovated to meet MassDOT’s standards. In addition, MPO staff recommend installing bus shelters on Essex Street at the heavily used MBTA bus stops located at the Swampscott Mall driveway and on Loring Avenue at Carol Way. The proposed roadway would have high visibility crosswalks across all town-owned streets and major driveways that intersect Essex Street and Loring Avenue. The redesigned roadway would fulfill the vision of connecting the neighborhoods to services at Vinnin Square and the Swampscott Mall.
In addition to the proposed renovation efforts discussed above, providing the following features would modernize the roadway to increase safety and make Essex Street and Loring Avenue south of Vinnin Square efficient for all users:
The expected performance of the signalized intersections, after implementation of the proposed improvements, is shown in Figures 37-39. Estimates of LOS and delay are provided for the weekday AM and PM and Saturday PM peak hours. The signalized intersection would operate satisfactorily during the peak hours.
There are no disadvantages associated with the proposed improvements except that construction and traffic management issues associated with improvements to Essex Street and Loring Avenue would impact traffic flow and business activities.
Based on the costs of similar reconstruction projects recorded in MassDOT’s project information database, MPO staff estimate the improvements to cost between $2 million and $3 million. This estimate includes the cost of drainage improvements, sidewalks and ADA-compliant ramp construction, landscape and streetscape renovation, paving and markings, signing, signal retiming, and street lighting.
Two alternatives were developed for improving traffic safety and accommodating pedestrians and bicyclists at Vinnin Square.
Figure 44 shows the proposed improvements in Alternative 1. All of the improvements are kept within the existing right-of-way to avoid land takings at Vinnin Square. The proposed improvements would mark the travel lanes on Route 1A and Loring Avenue for shared-use with bicyclists and renovate the sidewalks and curb ramps on this section of Route 1A to meet MassDOT’s standards. Additional improvements would provide a welcoming environment for pedestrians at Vinnin Square by upgrading the streetscape, landscaping with greenery, and calming traffic. MPO staff recommend the installation of bus shelters on Loring Avenue for the heavily used MBTA bus stops located near the Vinnin Street intersection. In addition, MPO staff advise the City of Salem to work with the business owners in Vinnin Square on consolidating driveways on Route 1A to reduce turn related-crashes and provide a welcoming environment for pedestrians and bicyclists. In addition, MPO staff recommend installing high visibility crosswalks at the signalized intersections and across all city- or town-owned streets and major driveways that intersect Route 1A or Loring Avenue.
Figure 45 shows the proposed improvements in Alternative 2. They are similar to those in Alternative 1, except that the shared-use lanes are replaced with bike lanes on Route 1A. Alternative 2 would allow and provide continuous and connected bike lanes on Route 1A from Swampscott to Salem, a distance of approximately three miles.
In addition to the proposed improvements, providing the following features would increase safety and modernize the roadways at Vinnin Square to serve all users safely and efficiently:
The expected performance of the intersections, after implementation of the proposed improvements, is shown in Figures 37-39. Estimates of LOS and delay are provided for the weekday AM and PM and Saturday PM peak hours for both Alternatives 1 and 2. Either alternative would allow the signalized intersections on Route 1A, Loring Avenue, and Vinnin Street to operate satisfactorily during the peak hours.
Alternative 2 has all of the benefits of Alternative 1 in addition to the following:
Based on the costs of similar reconstruction projects recorded in MassDOT’s project information database, MPO staff estimate that Alternative 1 would cost between $1 million and $2 million, and Alternative 2 would cost between $3 million and $4 million.
The estimates exclude the cost of land takings required for the improvements. The estimates include the cost of drainage improvements, accommodation and relocation of utilities, construction of sidewalks and ADA-compliant curb ramps, streetscape and landscape renovations, paving and markings, upgrades to traffic signals and equipment, new signal-timing plans, and street lighting.
Figure 46 shows the improvements developed for Tedesco Street. The proposed improvements would reconfigure the roadway to make it safer for pedestrians and bicyclists. The proposed roadway consists of two 11-foot travel lanes with five-foot shoulders, and sidewalks on both sides of Tedesco Street. Additional improvements include the renovation of sidewalks and curb ramps to meet MassDOT’s standards. Construction of a new sidewalk on the north side of Tedesco Street, from West Street to Vinnin Square, will help to close the gap in the sidewalk network. MPO staff also recommend the installation of rectangular rapid flash beacons for the midblock crosswalk on Tedesco Street at the Tedesco Country Club House. Other minor adjustments include the installation of bulb outs on Brookhouse Drive to allow vehicles to approach Tedesco Street at a more perpendicular angle, shorten the crosswalk distance, and reduce the speed of right-turning vehicles onto Tedesco Street. MPO staff recommend high visibility crosswalks across all town-owned streets and major driveways that intersect Tedesco Street.
Traffic control signals are valuable devices for controlling vehicular and pedestrian traffic. They assign the right-of-way to various traffic movements and thereby strongly influence traffic flow. Traffic control signals that are properly designed, located, operated, and maintained will provide orderly movement of traffic, and reduce congestion and the frequency and severity of certain types of crashes, especially right-angle collisions. Traffic control signals are not solutions to all traffic problems at intersections. Poorly designed and maintained, ineffectively placed, improperly operated, or unjustified traffic control signals can result in excessive delays, a significant increase in crashes (especially the rear-end type), and diversion of traffic to less adequate routes, as road users attempt to avoid the traffic control signals.
Investigating the need for a traffic control signal at an unsignalized intersection involves analyzing factors related to the existing traffic operations and safety conditions at the intersection, as well as the potential to improve these conditions. Such an investigation is called a traffic signal warrant analysis. The Manual on Uniform Traffic and Control Devices (MUTCD) lists nine traffic signal warrants that justify installing a traffic signal.23
Using the methodology outlined in the 2009 edition of the MUTCD, staff performed detailed traffic signal warrant analyses to determine whether the installation of a traffic control signal at the intersection of Tedesco Street and Leggs Hill Road is justified and if signalizing the intersection would improve safety and traffic operations.
Table 5 presents the results of the traffic signal warrant analyses; detailed traffic signal warrant analysis worksheets are included in Appendix F. Existing conditions at the intersection of Tedesco Street and Leggs Hill Road satisfy three of the warrants. However, the intersection has a low crash rate, and traffic delays on Leggs Hill Road occur only during the two-hour AM and two-hour PM peak travel periods. In addition, a peak-hour intersection capacity analysis also indicated that a traffic signal at the intersection would create traffic queues on Tedesco Street that would extend beyond West Street and block traffic entering or exiting Brookhouse Drive. Based on the results of the signal warrant and intersection capacity analyses, MPO staff does not recommend installing a traffic signal at Tedesco Street and Leggs Hill Road at this time.
TABLE 5
Traffic Signal Warrant Analysis
Tedesco Street and Leggs Hill Road Intersection
Warrant |
Results |
|---|---|
Warrant 1, Eight-Hour Vehicular Volume |
Satisfied |
Warrant 2, Four-Hour Vehicular Volume |
Satisfied |
Warrant 3, Peak Hour |
Satisfied |
Warrant 4, Pedestrian Volume |
Not satisfied |
Warrant 5, School Crossing |
Not satisfied |
Warrant 6, Coordinated Signal System |
Not satisfied |
Warrant 7, Crash Experience |
Not satisfied |
Warrant 8, Roadway Network |
Not satisfied |
Warrant 9, Intersection Near a Grade Crossing |
Not satisfied |
Source: Central Transportation Planning Staff.
In addition to the proposed improvements discussed above, providing the following features would modernize the roadway to increase safety and make Tedesco Street efficient for all users:
The expected performance of the intersection of Tedesco Street and Leggs Hill Road, after implementation of the proposed improvements, is shown in Figures 37-39. Estimates of LOS and delay are provided for the weekday AM and PM peak hours and Saturday PM peak hour. The signalized intersection would operate satisfactorily during the peak hours but traffic on Leggs Hill Road would face longer delays.
There are no disadvantages associated with the proposed improvements, except that construction and traffic management would have an impact on traffic flow and affect commuters and business activities.
Based on the costs of similar reconstruction projects recorded in MassDOT’s project information database, MPO staff estimates that the improvements will cost between $1 million and $2 million. This estimate includes drainage improvements, construction of sidewalks and ADA-compliant curb ramps, streetscape renovation, paving and markings, and street lighting.
Figure 47 shows the improvements proposed for the segment of Route 1A from Vinnin Square to Leggs Hill Road. The improvements were developed taking into consideration the recommendations of a RSA conducted in collaboration with the City of Salem, the Salem State University Police Department, and MassDOT. Presently, the roadway segment is striped to include two 11-foot travel lanes and 6-to-8-foot shoulders and sidewalks on both sides from Maple Avenue to Riverview Street. The proposed improvements would reconfigure the roadway by converting the existing shoulders into bike lanes, thereby increasing safety for bicyclists. MPO staff also recommend the construction of new sidewalks and curb ramps on the west side of Loring Avenue from Riverview Street to Harrison Road to close the gap in the sidewalk network. Closing the gap in the sidewalk network on Route 1A would benefit the impending school swap that will move the Horace Mann Laboratory School to the Salem State University South Campus. In addition, MPO staff recommend installing a midblock crosswalk with pedestrian signals and advance-pedestrian-warning signs on Route 1A between Riverview Street and Leggs Hill Road. The midblock crosswalk should be located where it will be visible to approaching drivers; adequate sight distance must be considered. Other recommendations include the installation of high visibility crosswalks across all town-owned streets and major driveways that intersect Route 1A, and curve-warning signs and street lighting on the sharp horizontal curve in the vicinity of Leggs Hill Road.
In addition to the renovations discussed above, providing the following features would modernize Route 1A, increase safety, and make the roadway more efficient for all users:
There are no disadvantages associated with the proposed improvements.
Based on the costs of similar reconstruction projects recorded in MassDOT’s project information database, MPO staff estimate the improvements to cost between $1million and $2 million. This estimate includes drainage improvements, construction of sidewalks and ADA-compliant curb ramps, streetscape renovation, paving, and street lighting.
Figure 48 shows the improvements proposed for the segment of Route 1A from Leggs Hill Road to Sumner Road. The proposed improvements include the recommendations from the RSA conducted in collaboration with the City of Salem, Salem State University Police Department, and MassDOT. The proposed improvements reconfigure the roadway by converting the existing 6-to-8 foot shoulders into bike lanes to increase safety for bicyclists and by revamping the sidewalks and curb ramps to bring them to MassDOT’s standards. The improvements include retiming the traffic signals at Harrison Road and Pickman Roads, adding countdown timers and accessible pedestrian signals to increase safety for pedestrians, and installing of high visibility crosswalks across all town-owned streets and major driveways that intersect Route 1A. Additional improvements include the installation of pedestrian- and school-warning signs to alert drivers of pedestrians in crosswalks, and the installation of bus shelters at the stops on Route 1A between Harrison Road and Lincoln Road. These improvements are expected to benefit the impending school swap that will move the Horace Mann Laboratory School to the Salem State University South Campus.
Finally, MPO staff recommend that the City of Salem work with MassDOT, MassRIDES, and Walk Boston to conduct a comprehensive Safe Routes to School study, before the school swap occurs, to identify appropriate safe routes to the new school, pedestrian and bicyclists’ needs, and safety improvements that would encourage students to walk and bike to the relocated school.
In addition to the renovation efforts discussed above, providing the following features would modernize Route 1A, increase safety, and make the roadway more efficient for all users:
The expected performance of the Route 1A intersection at Harrison Road and Pickman Road, after implementation of the proposed improvements, is shown in Figures 37-39. Estimates of LOS and delay are provided for the weekday AM and PM and Saturday PM peak hours. Analyses show that the two signalized intersections would operate satisfactorily during the peak hours.
There are no disadvantages associated with the proposed improvements.
Based on the costs of similar reconstruction projects recorded in MassDOT’s project information database, MPO staff estimate the project to cost between $2 million and $3 million. This estimate includes drainage improvements, construction of sidewalks and ADA-compliant curb ramps, streetscape renovation, paving and markings, signing, and street lighting.
The improvements proposed in this study would increase safety, balance the needs of all transportation users, expand mobility, improve public health, support economic activities, reduce emissions for a cleaner environment, and create stronger communities. Figure 49 shows examples of accessible curb ramps that comply with MassDOT’s standards and high visibility crosswalks that increase safety for pedestrians. Figure 50 shows examples of sidewalk designs that provide welcoming sidewalk experiences and median cuts that offer pedestrians refuge areas. Figure 51 shows examples of MBTA bus shelters proposed for the heavily used MBTA bus stops and examples of pedestrian signals that can be used to increase safety for pedestrians at midblock crosswalks on high-traffic-volume roadways. Finally, Figure 52 shows photographs of other roadways in the Boston region that received the type of treatments described in this report; they include Route 109 in Westwood, Route 135 in Natick, and Route 109 in Medway.
Chapter 8—Conclusion and Next Steps
The above analyses and evaluations indicate that Route 1A and the ancillary streets surrounding it in Marblehead, Salem, and Swampscott need renovations to improve safety and mobility for motorists, pedestrians, and bicyclists. This study identified the transportation issues related to safety, operations, and mobility, and proposed solutions to address needs in those areas. This study aligns with the Boston Region MPO’s goals of modernizing roadways to reduce congestion, increasing safety on the region’s highway system, expanding the quantity and quality of walking and bicycling infrastructure, and making transit service more efficient and modern. The proposed improvements offered in this report, if implemented, would increase traffic safety, make traffic operations more efficient, and modernize the roadway to accommodate all users.
There are several reasons why pedestrians and bicyclists find navigating the roadways in the study area challenging and why the roadways are considered unfriendly for those users: wide roadways create inequity by placing too much emphasis on vehicular use and by encouraging higher vehicle speeds; a lack of shoulders or bike lanes makes the roadways uncomfortable for bicyclists; and sidewalks are too close to the travel lanes, which causes discomfort for pedestrians. Furthermore, obstructions in crosswalks, curb ramps that are not ADA compliant, broken sidewalks, and sidewalk connectivity problems (gaps) create an unfriendly environment for pedestrians, especially for people with disabilities. Also, a lack of bus shelters at the heavily used stops creates problems for bus riders, especially during inclement weather.
Among the traffic operations problems facing motorists are high vehicular speeds at the sharp horizontal curve on Route 1A at Leggs Hill Road in Salem, where many crashes have occurred. Also, outdated signal-timing plans make the flow of traffic inefficient through the Vinnin Square District. Additionally, high volumes of traffic and a lack of left-turn lanes on Route 1A causes a high number of crashes, traffic queues, and congestion near Swampscott Mall, in Vinnin Square, and on Route 1A between Harrison Road and Sumner Road.
MPO staff, working with the study’s advisory task force, developed recommendations for improvements that could transform the study area into a pedestrian- and bicyclist-friendly transportation corridor that serves all modes of transportation and maintains regional travel capacity. MPO staff evaluated different roadway cross sections to determine how best to accommodate all road users safely and fulfill the vision of connecting the neighborhoods to the Vinnin Square District, educational institutions, and recreational areas, thereby fostering cohesive land uses, connecting people and their destinations, and promoting economic activity. This study provides the City of Salem, Towns of Marblehead and Swampscott, MassDOT, and other stakeholders with an assessment of the transportation needs at Vinnin Square and the adjoining neighborhoods in light of past, recent, and future developments, and allows them to start planning projects to implement the recommended improvements. When selecting preferred improvements to advance through the planning process, planners should consider the advantages and disadvantages of each alternative, cost, effectiveness, and impacts on their goals and objectives.
Because there are multiple jurisdictions in the study area, successful implementation of the proposed improvements would require cooperation between MassDOT Highway Division and the municipalities to ensure that signal equipment can communicate and share data; sidewalks, shoulders, and bike lanes are continuous and connected; and MassDOT’s standards guide the design of roadway elements such as curb ramps, bike lanes, sidewalks. It is important for stakeholders to examine the design concepts with all road users in mind.
MassDOT owns Route 1A and would be responsible for any renovations to the following sections of Route 1A:
The City of Salem and the Towns of Marblehead and Swampscott own the arterials and the local collectors that connect to Route 1A. These municipalities would be responsible for any renovation to the roadways under their jurisdiction:
Transportation decision making is complex and is influenced by factors such as financial limitations and agencies’ programmatic commitments. Project development is the process that takes transportation improvements from concept to construction. This process will depend upon cooperation between MassDOT, Marblehead, Salem, Swampscott, and the MPO. This planning study and the two RSAs provide the necessary information for the project proponents to initiate the project notification and review process. After completing the initial steps, the proponents can start preliminary design and engineering and place the project on the TIP. An overview of the project development process is included in Appendix G.
SA/sa
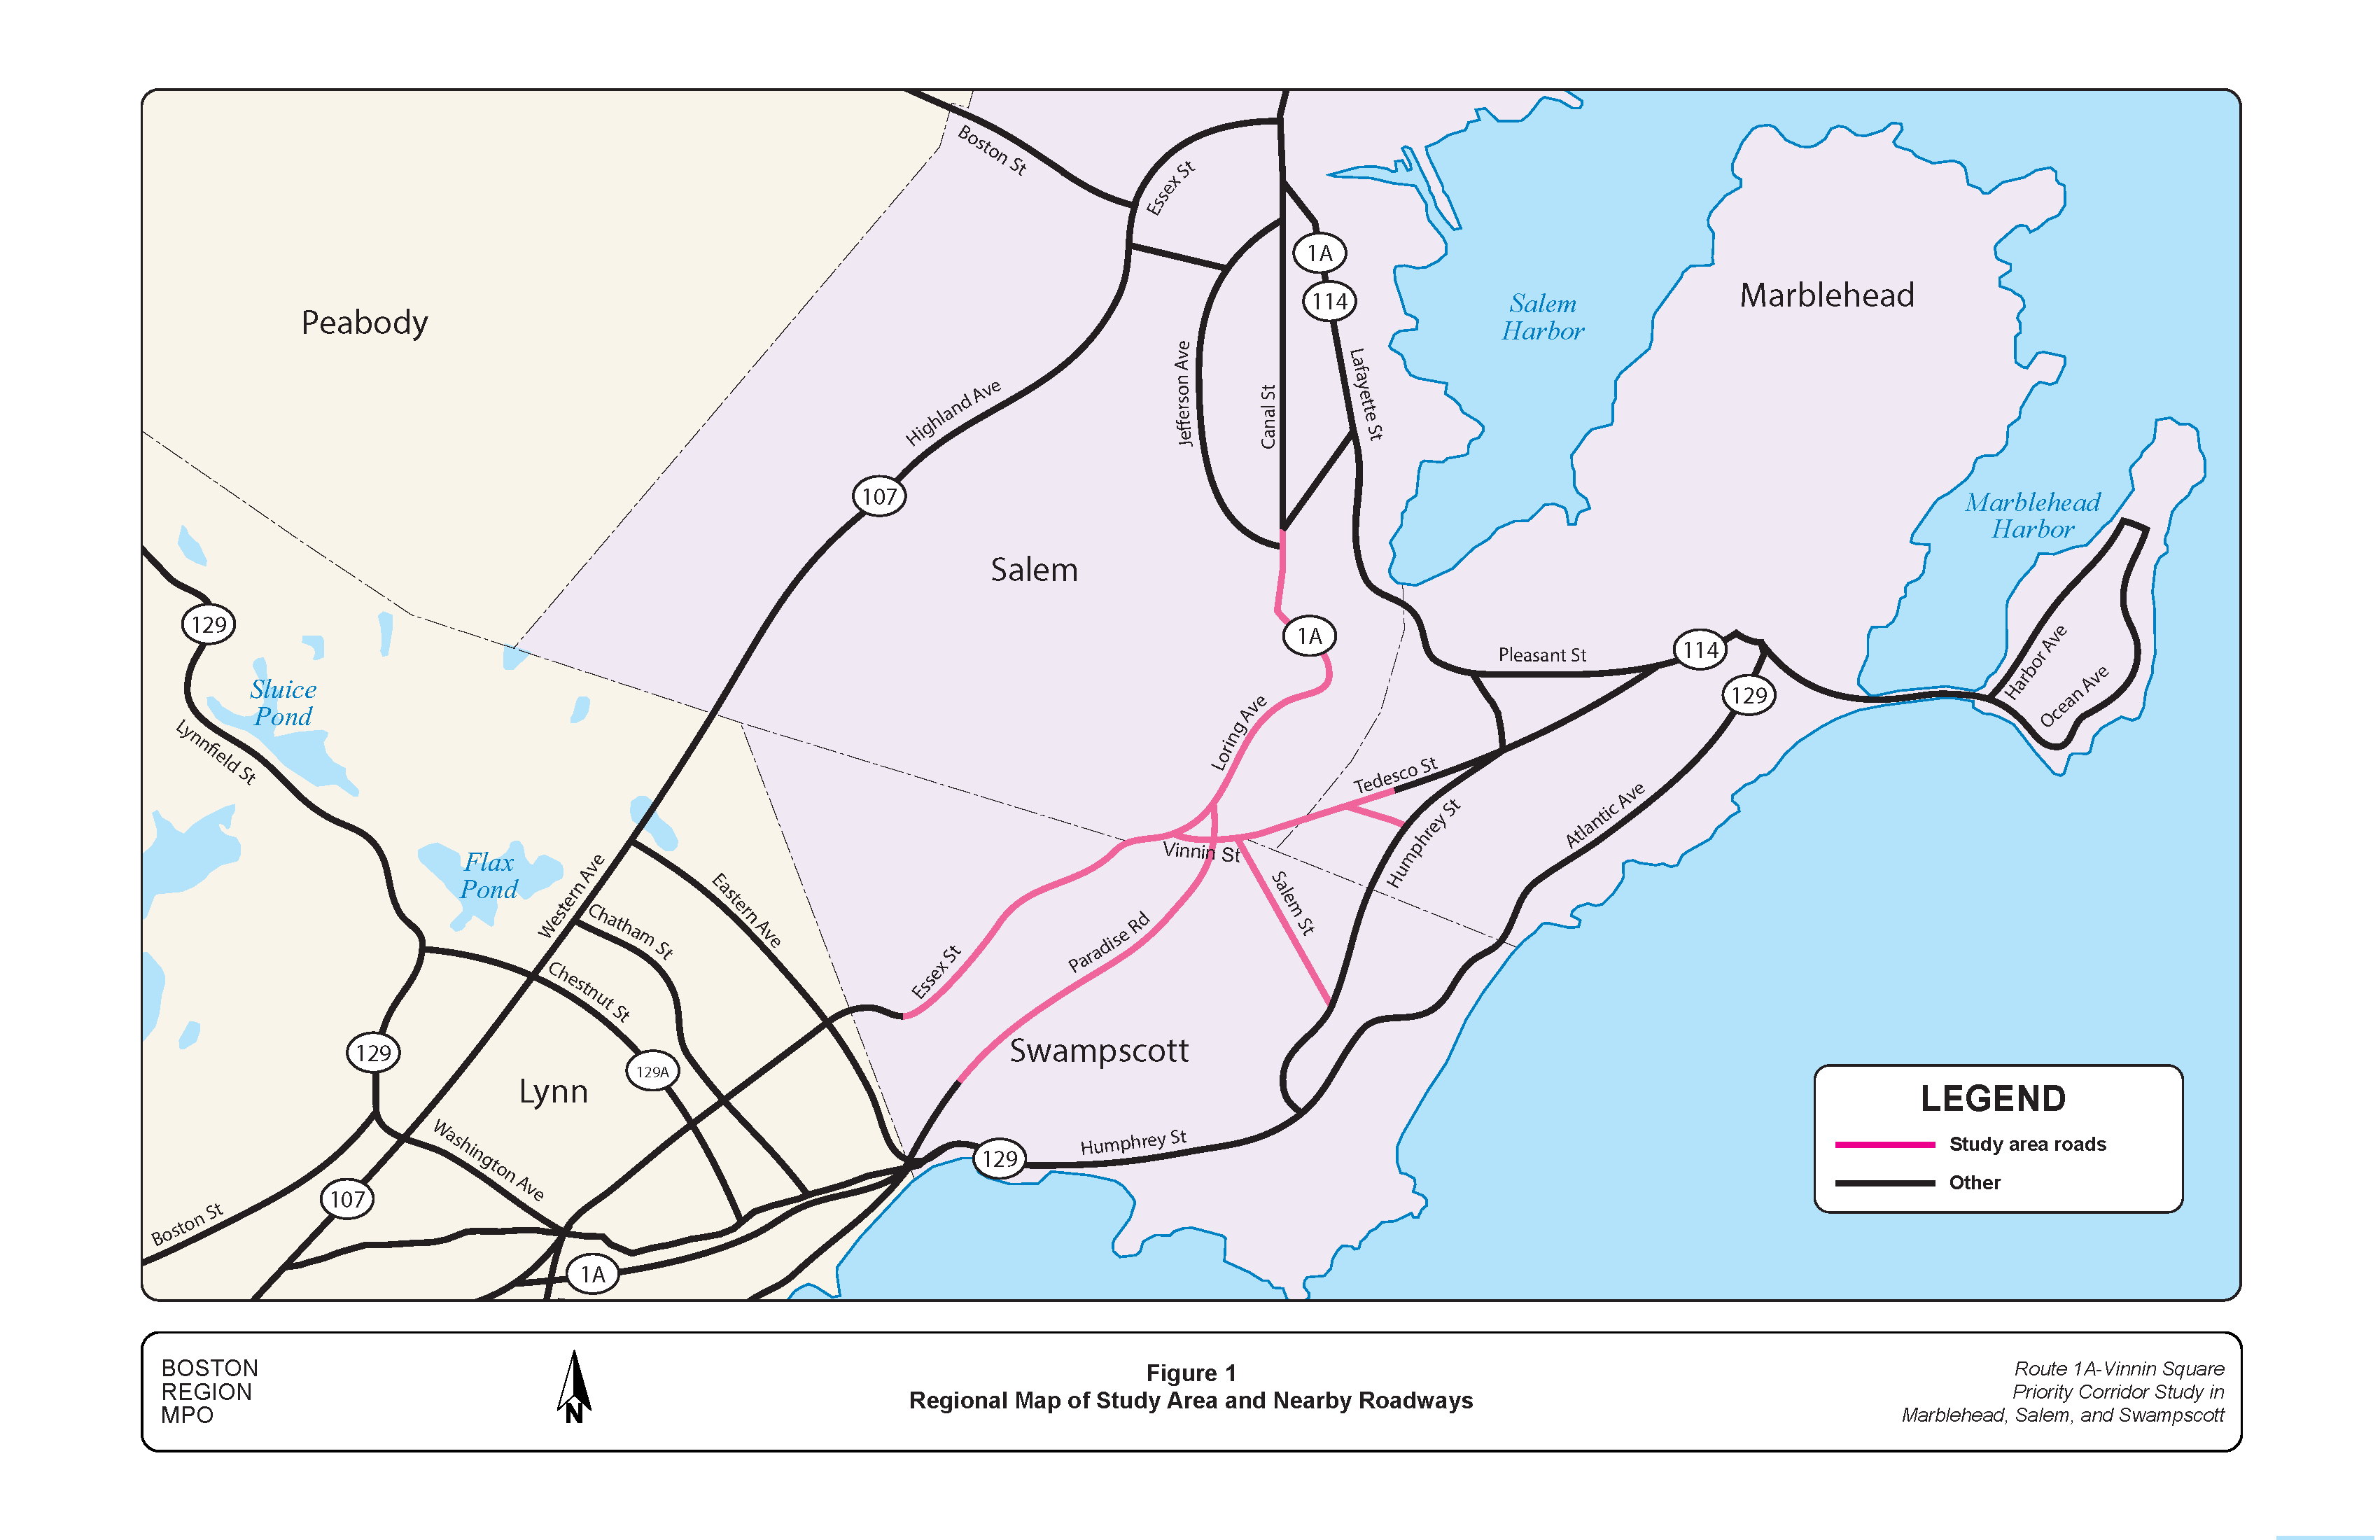
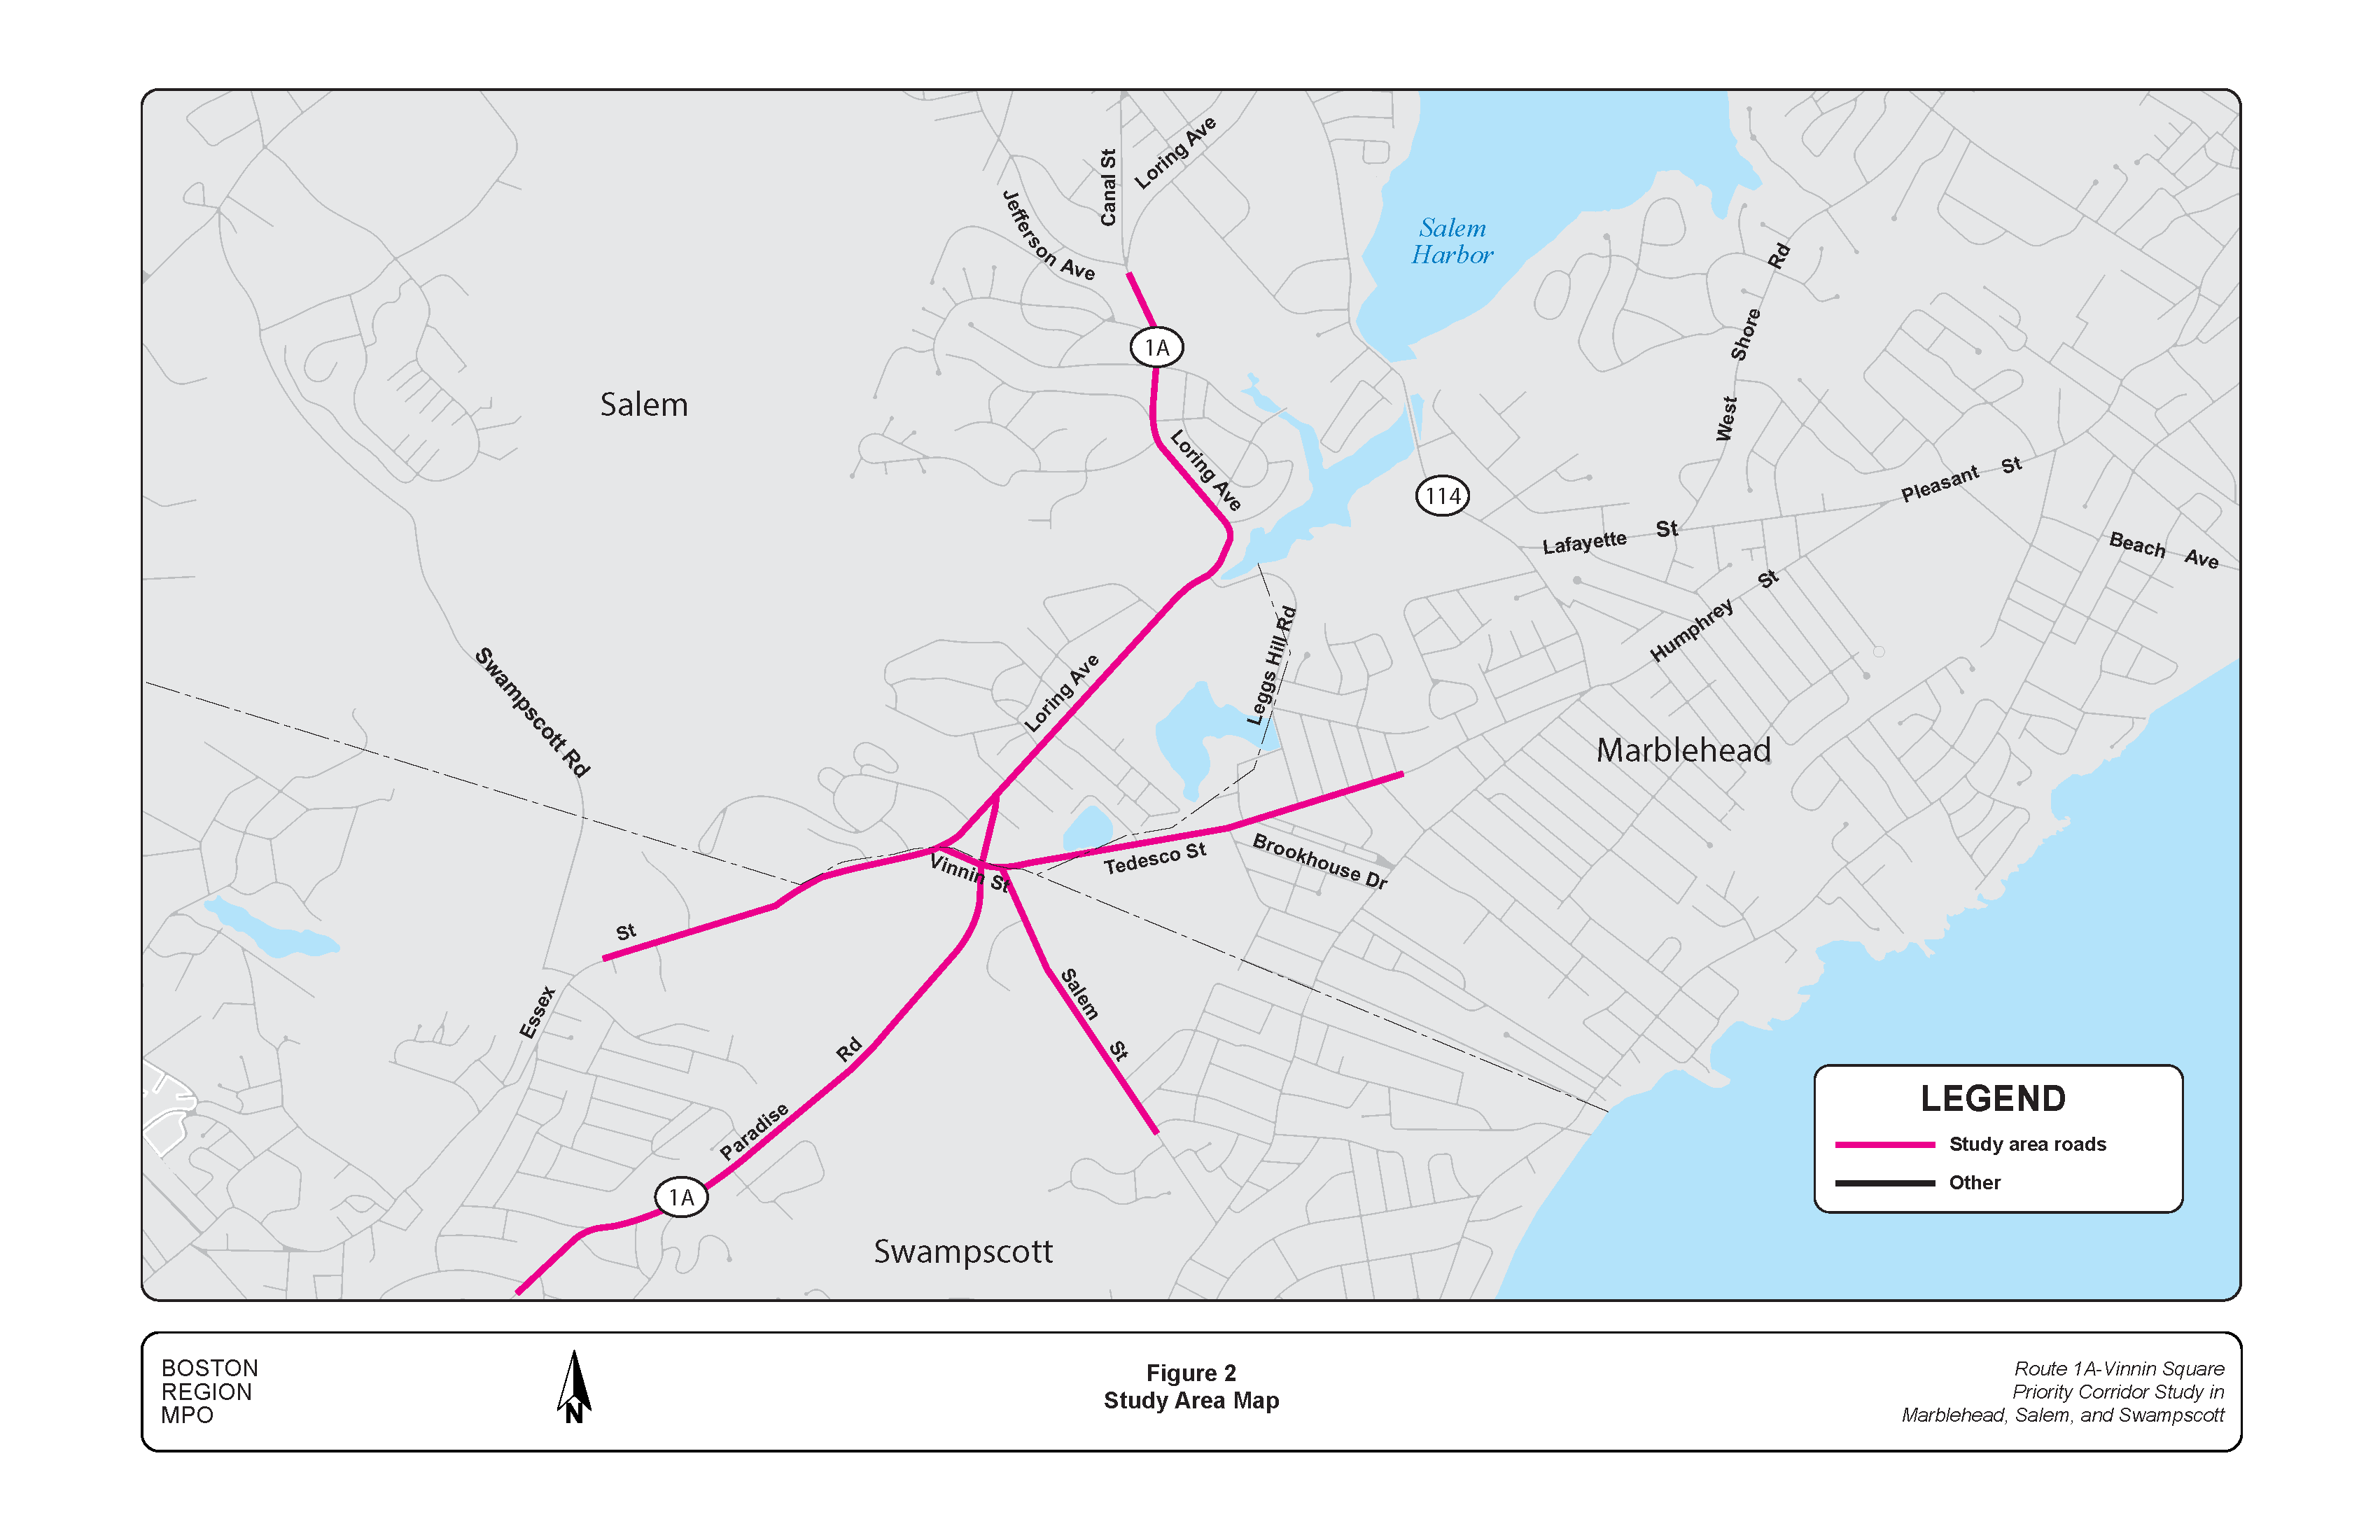
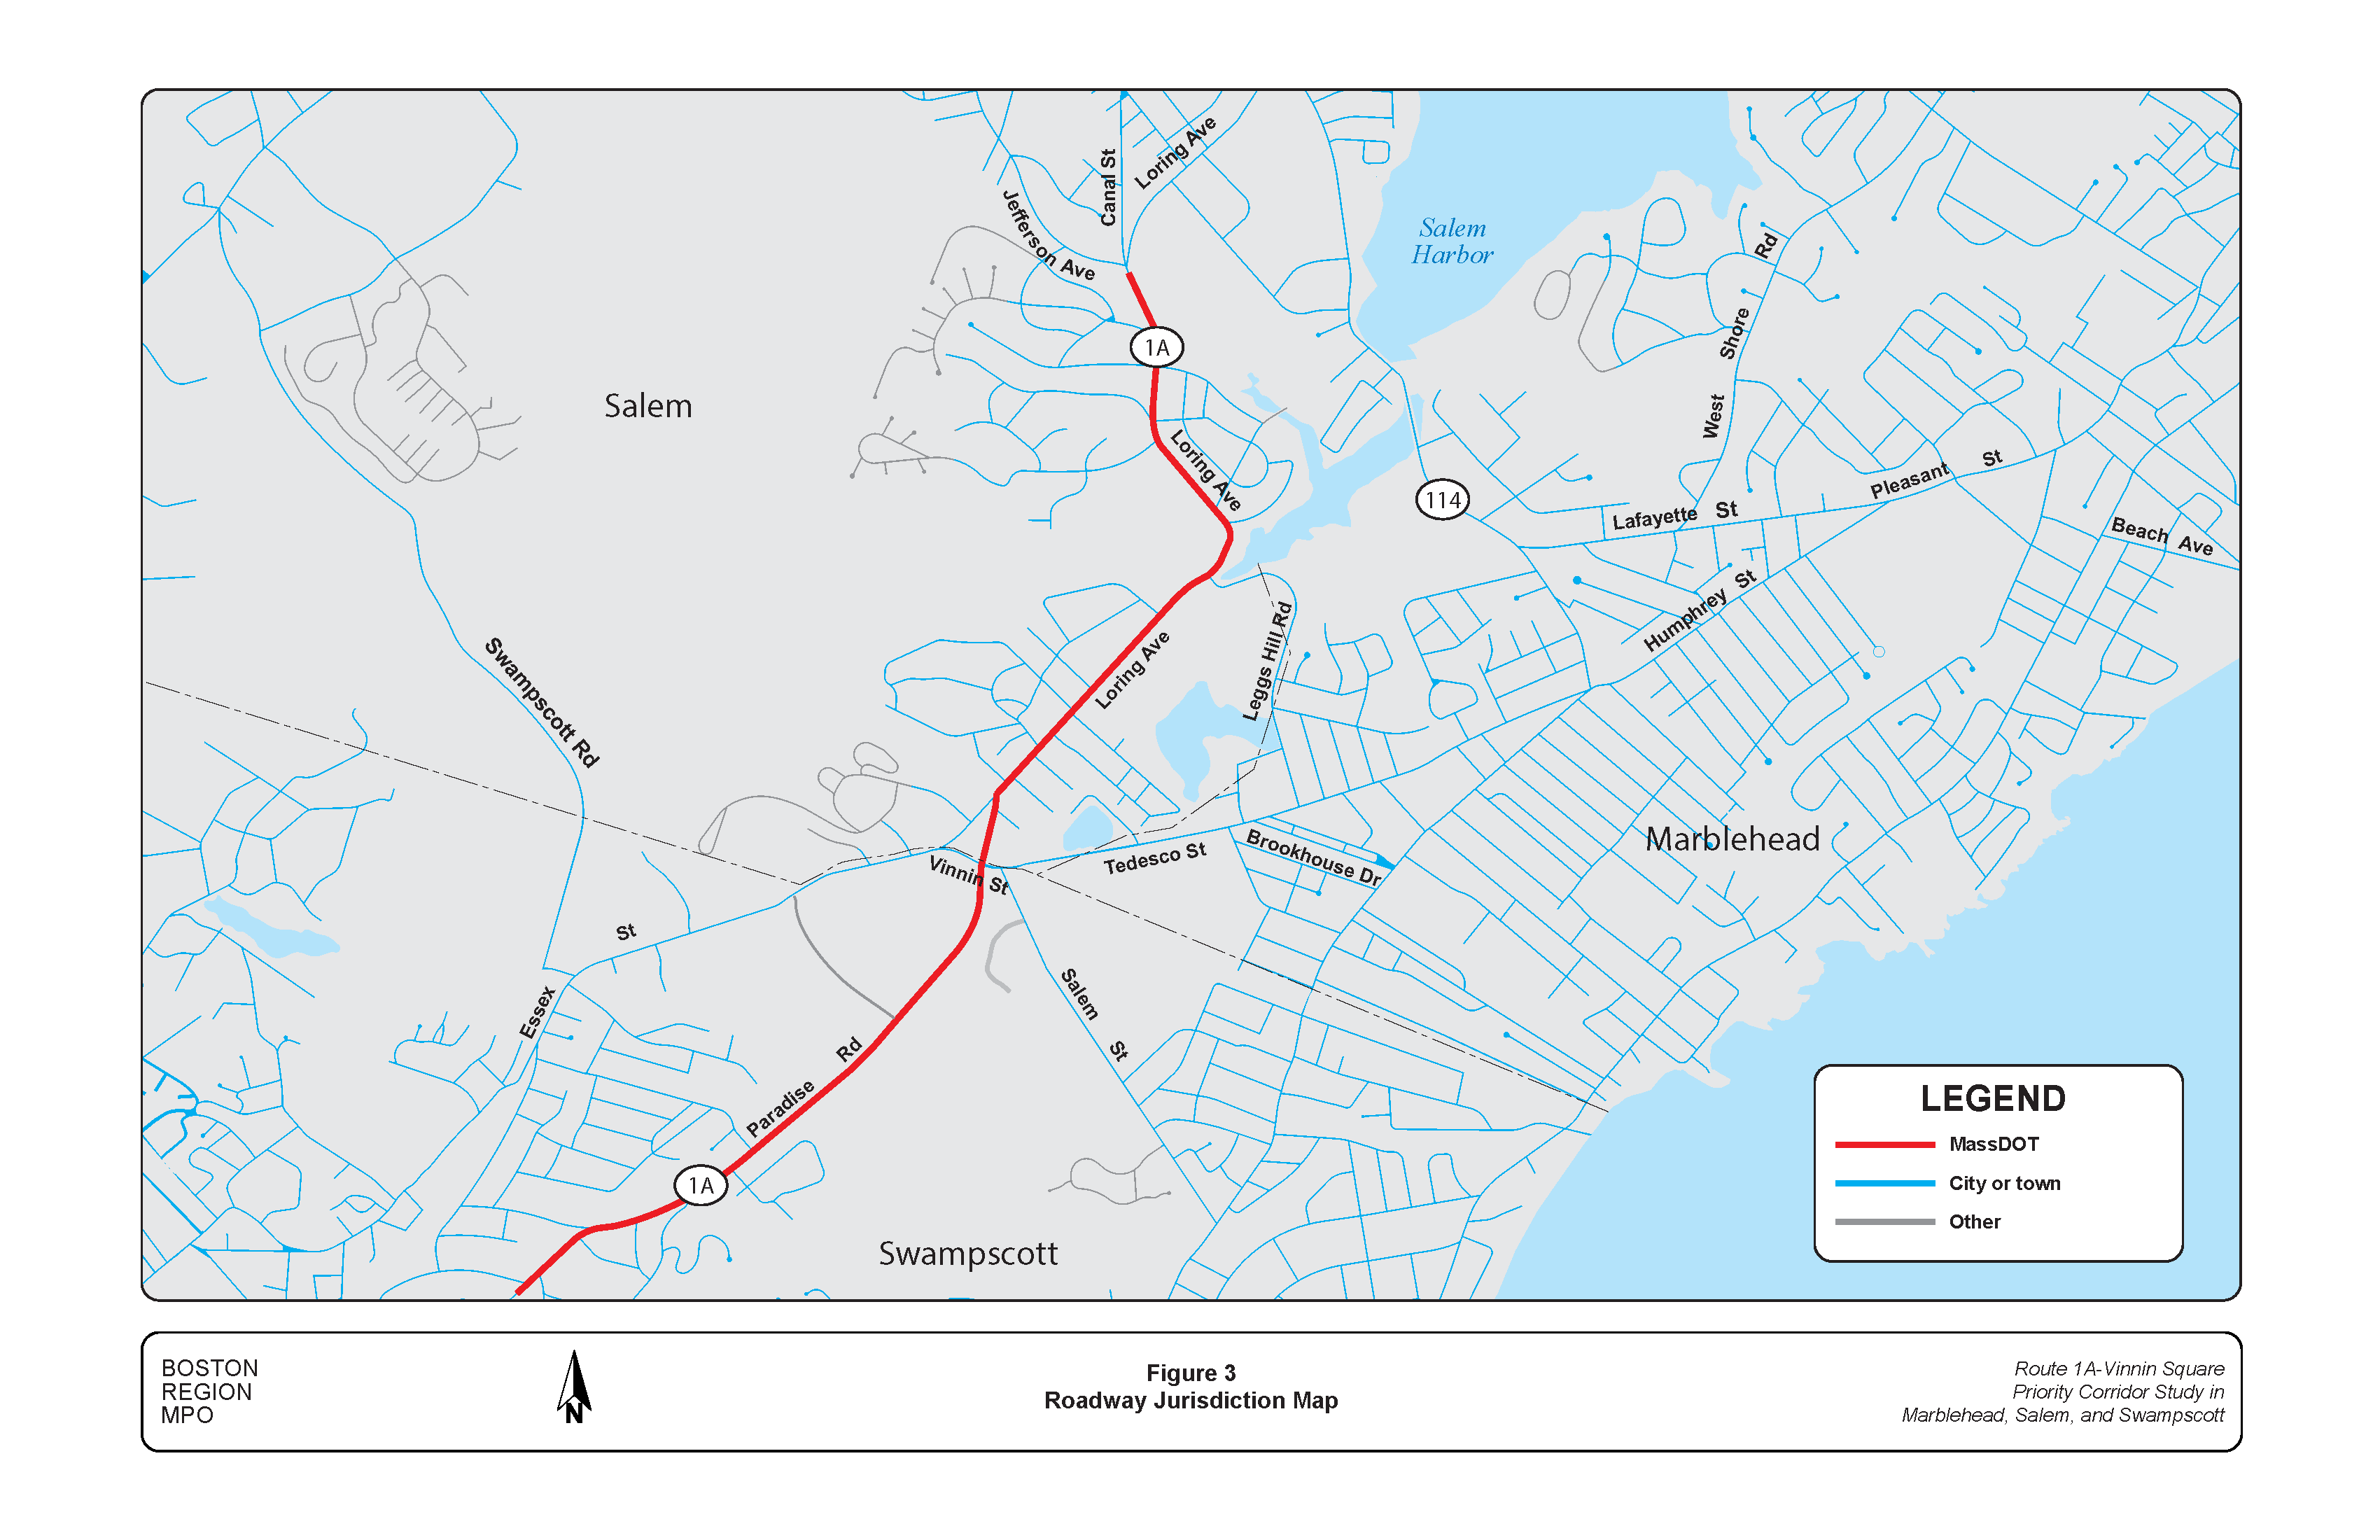
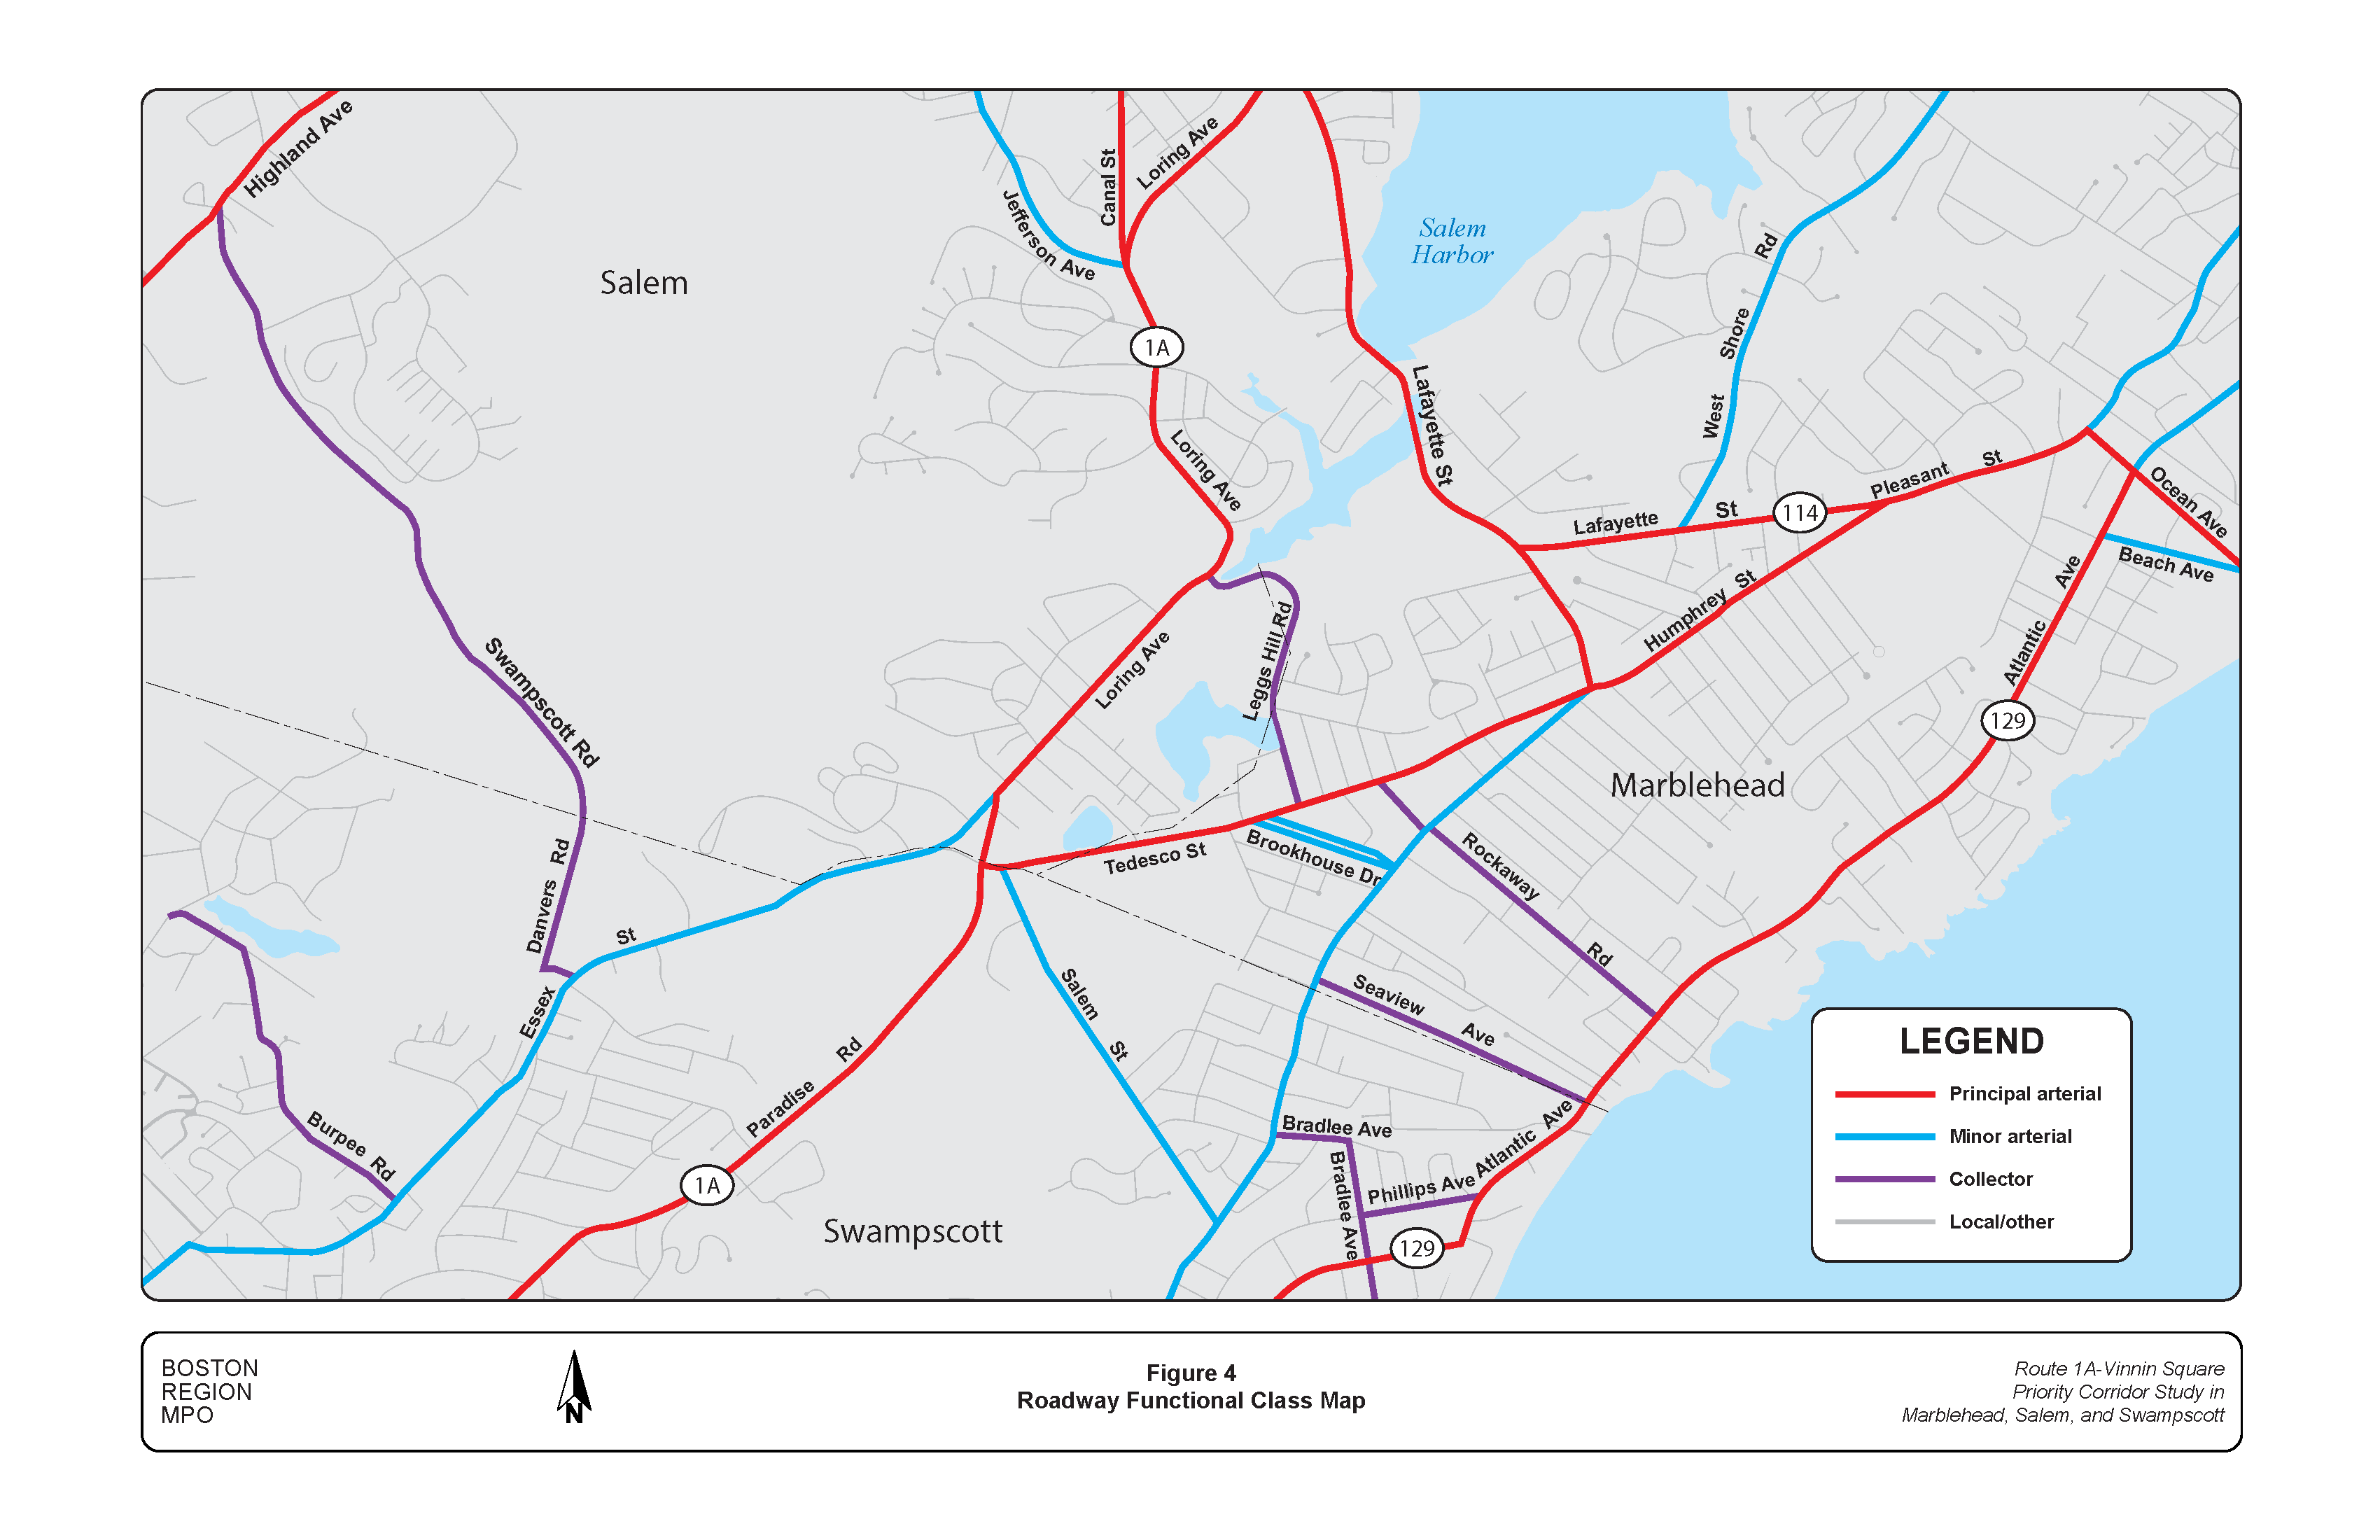
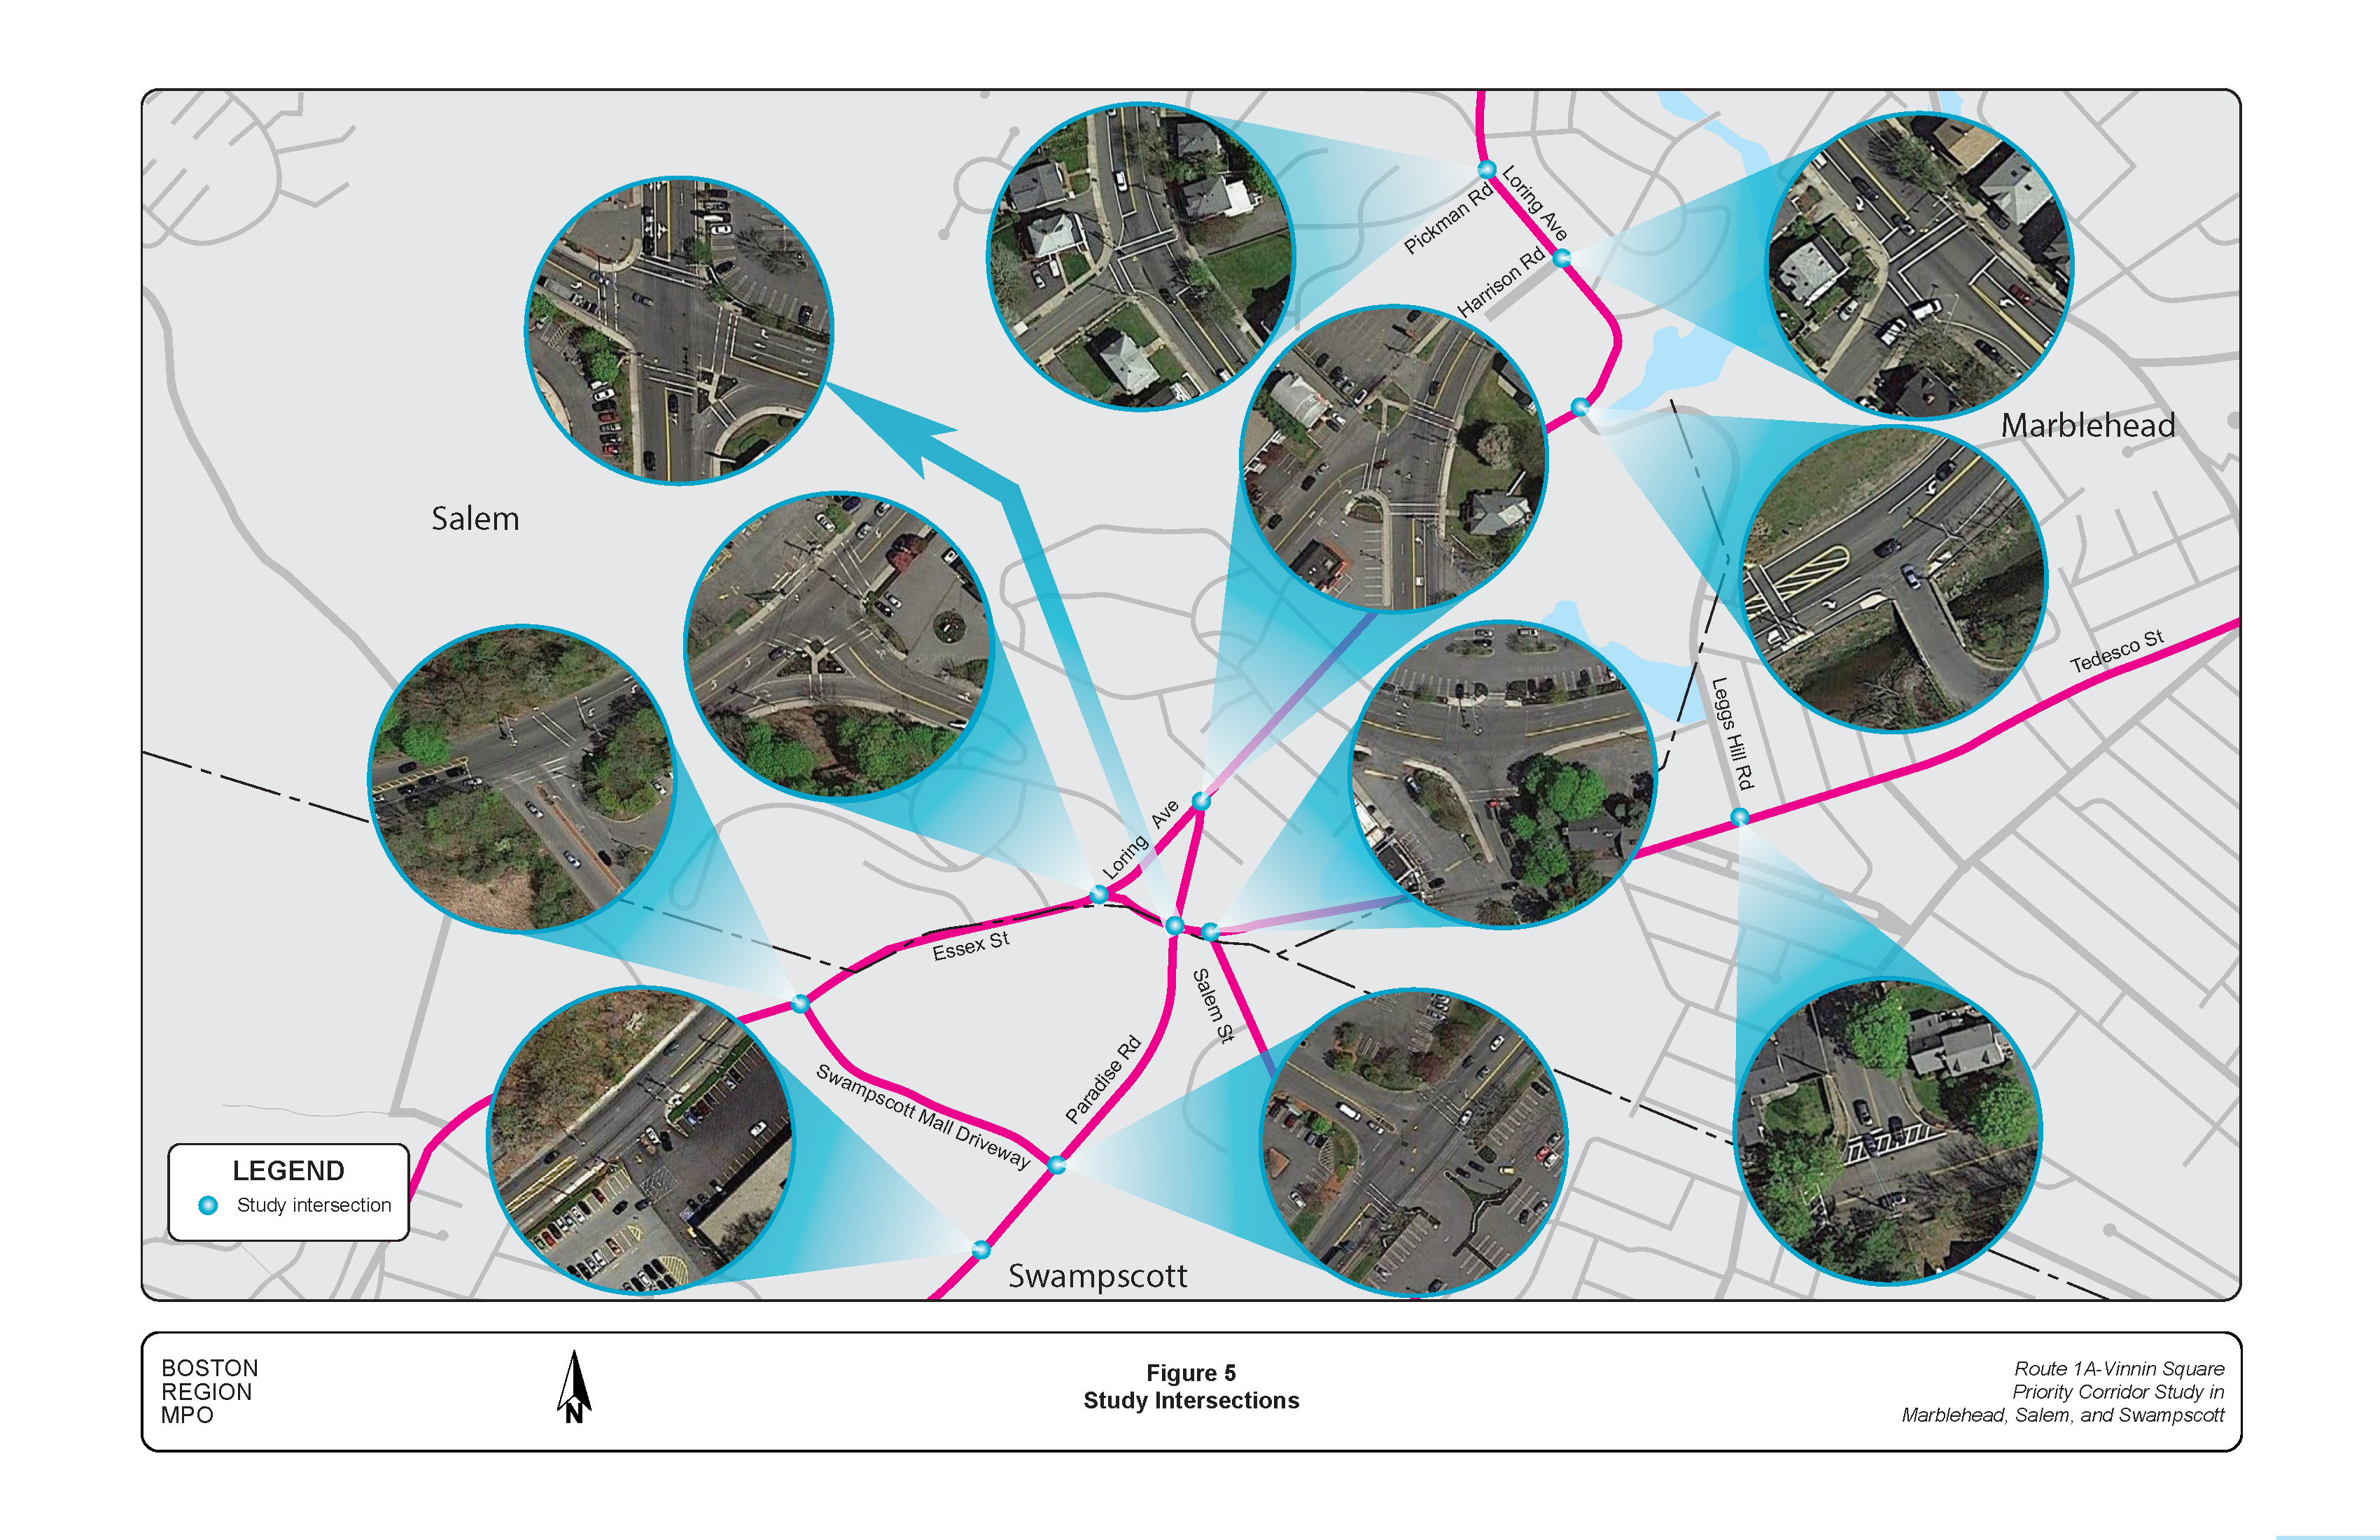
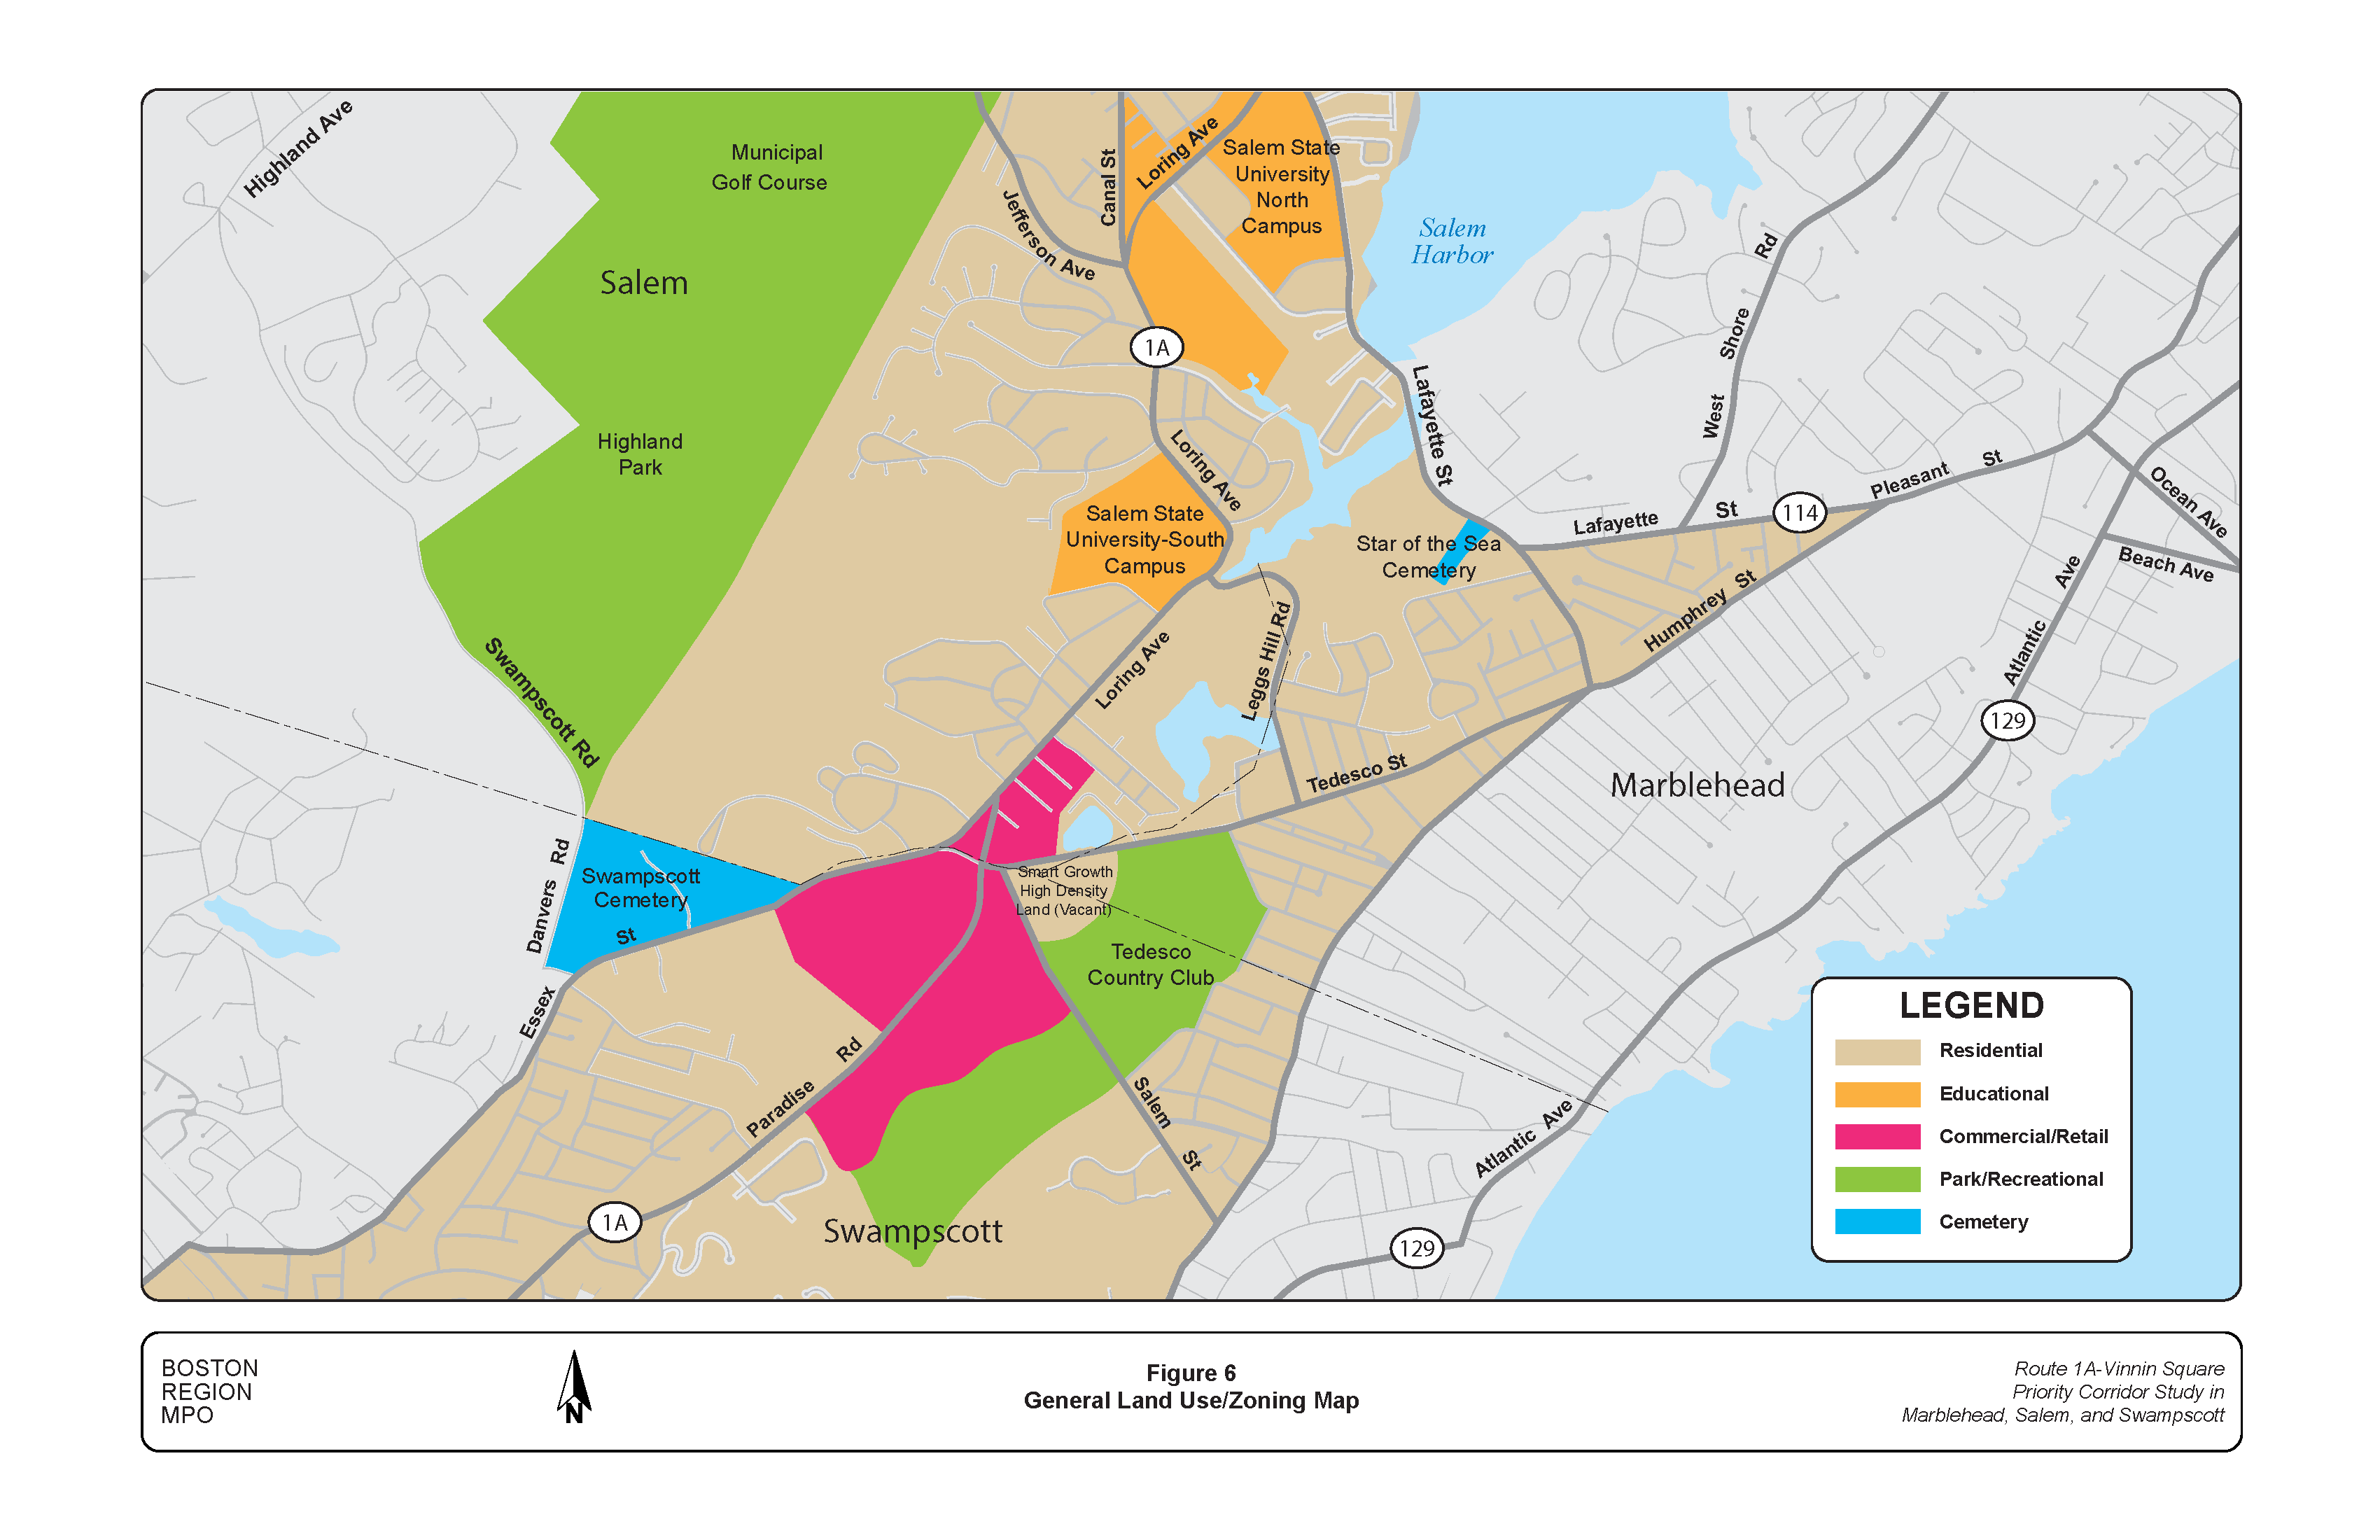
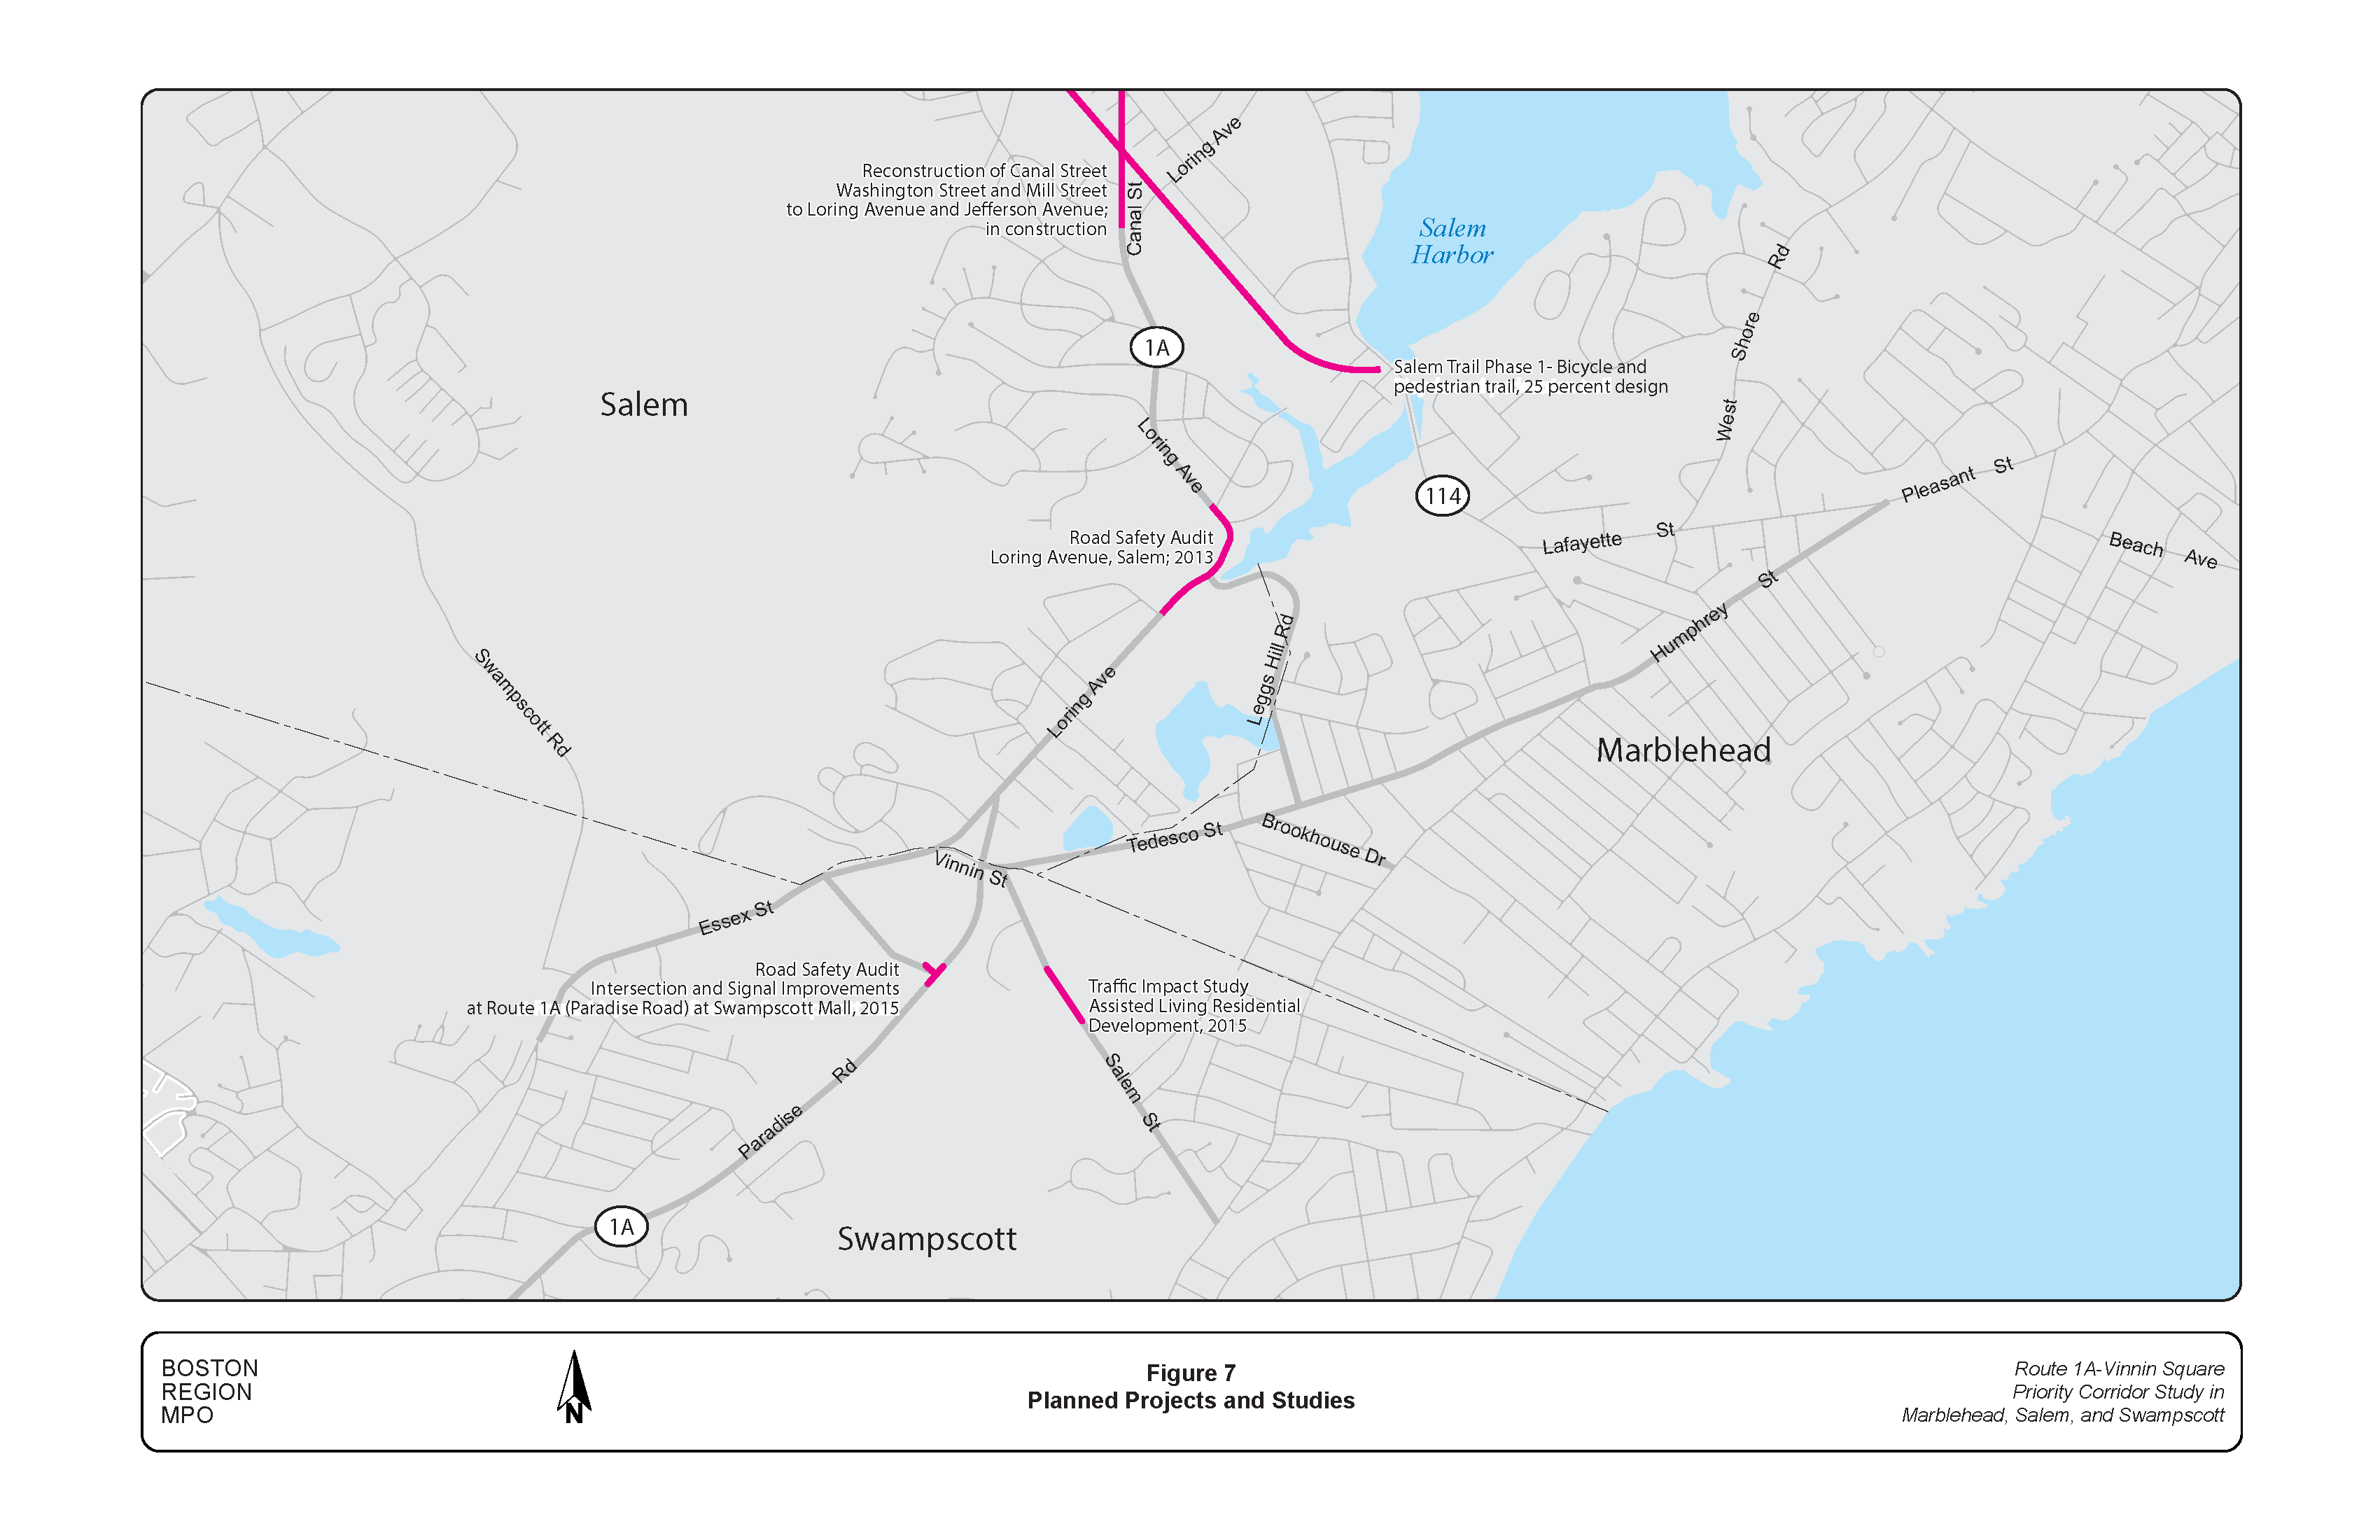
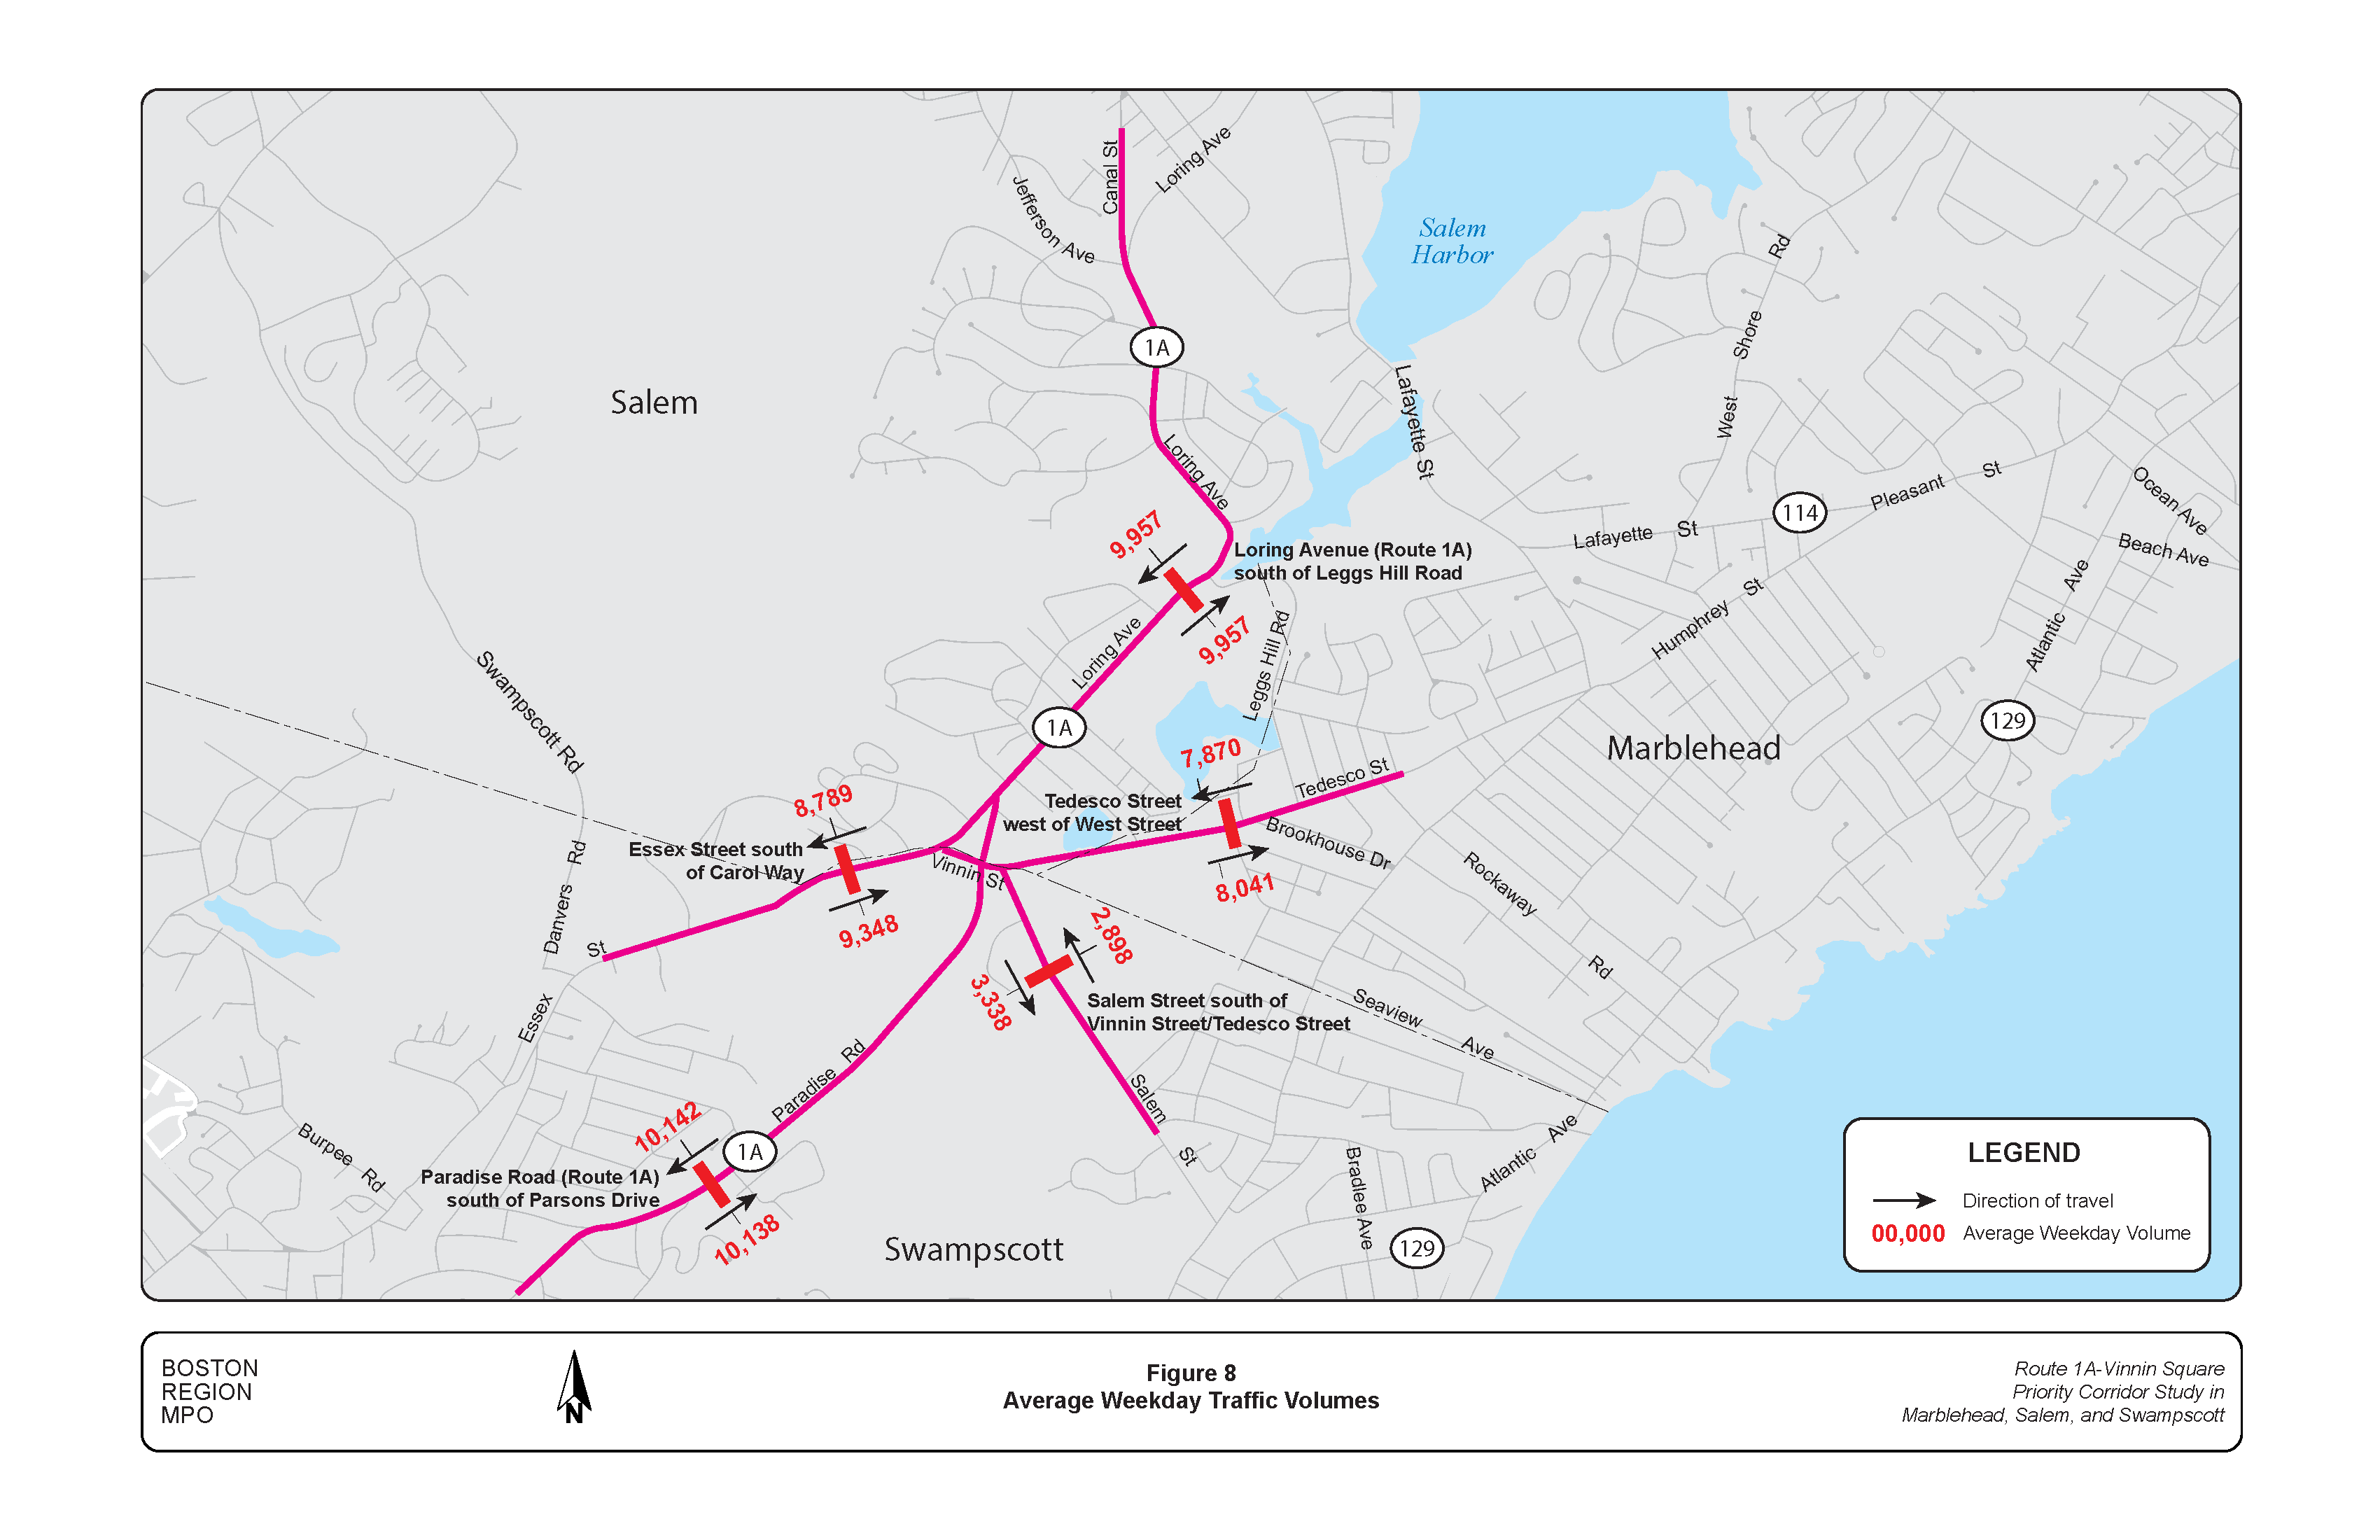
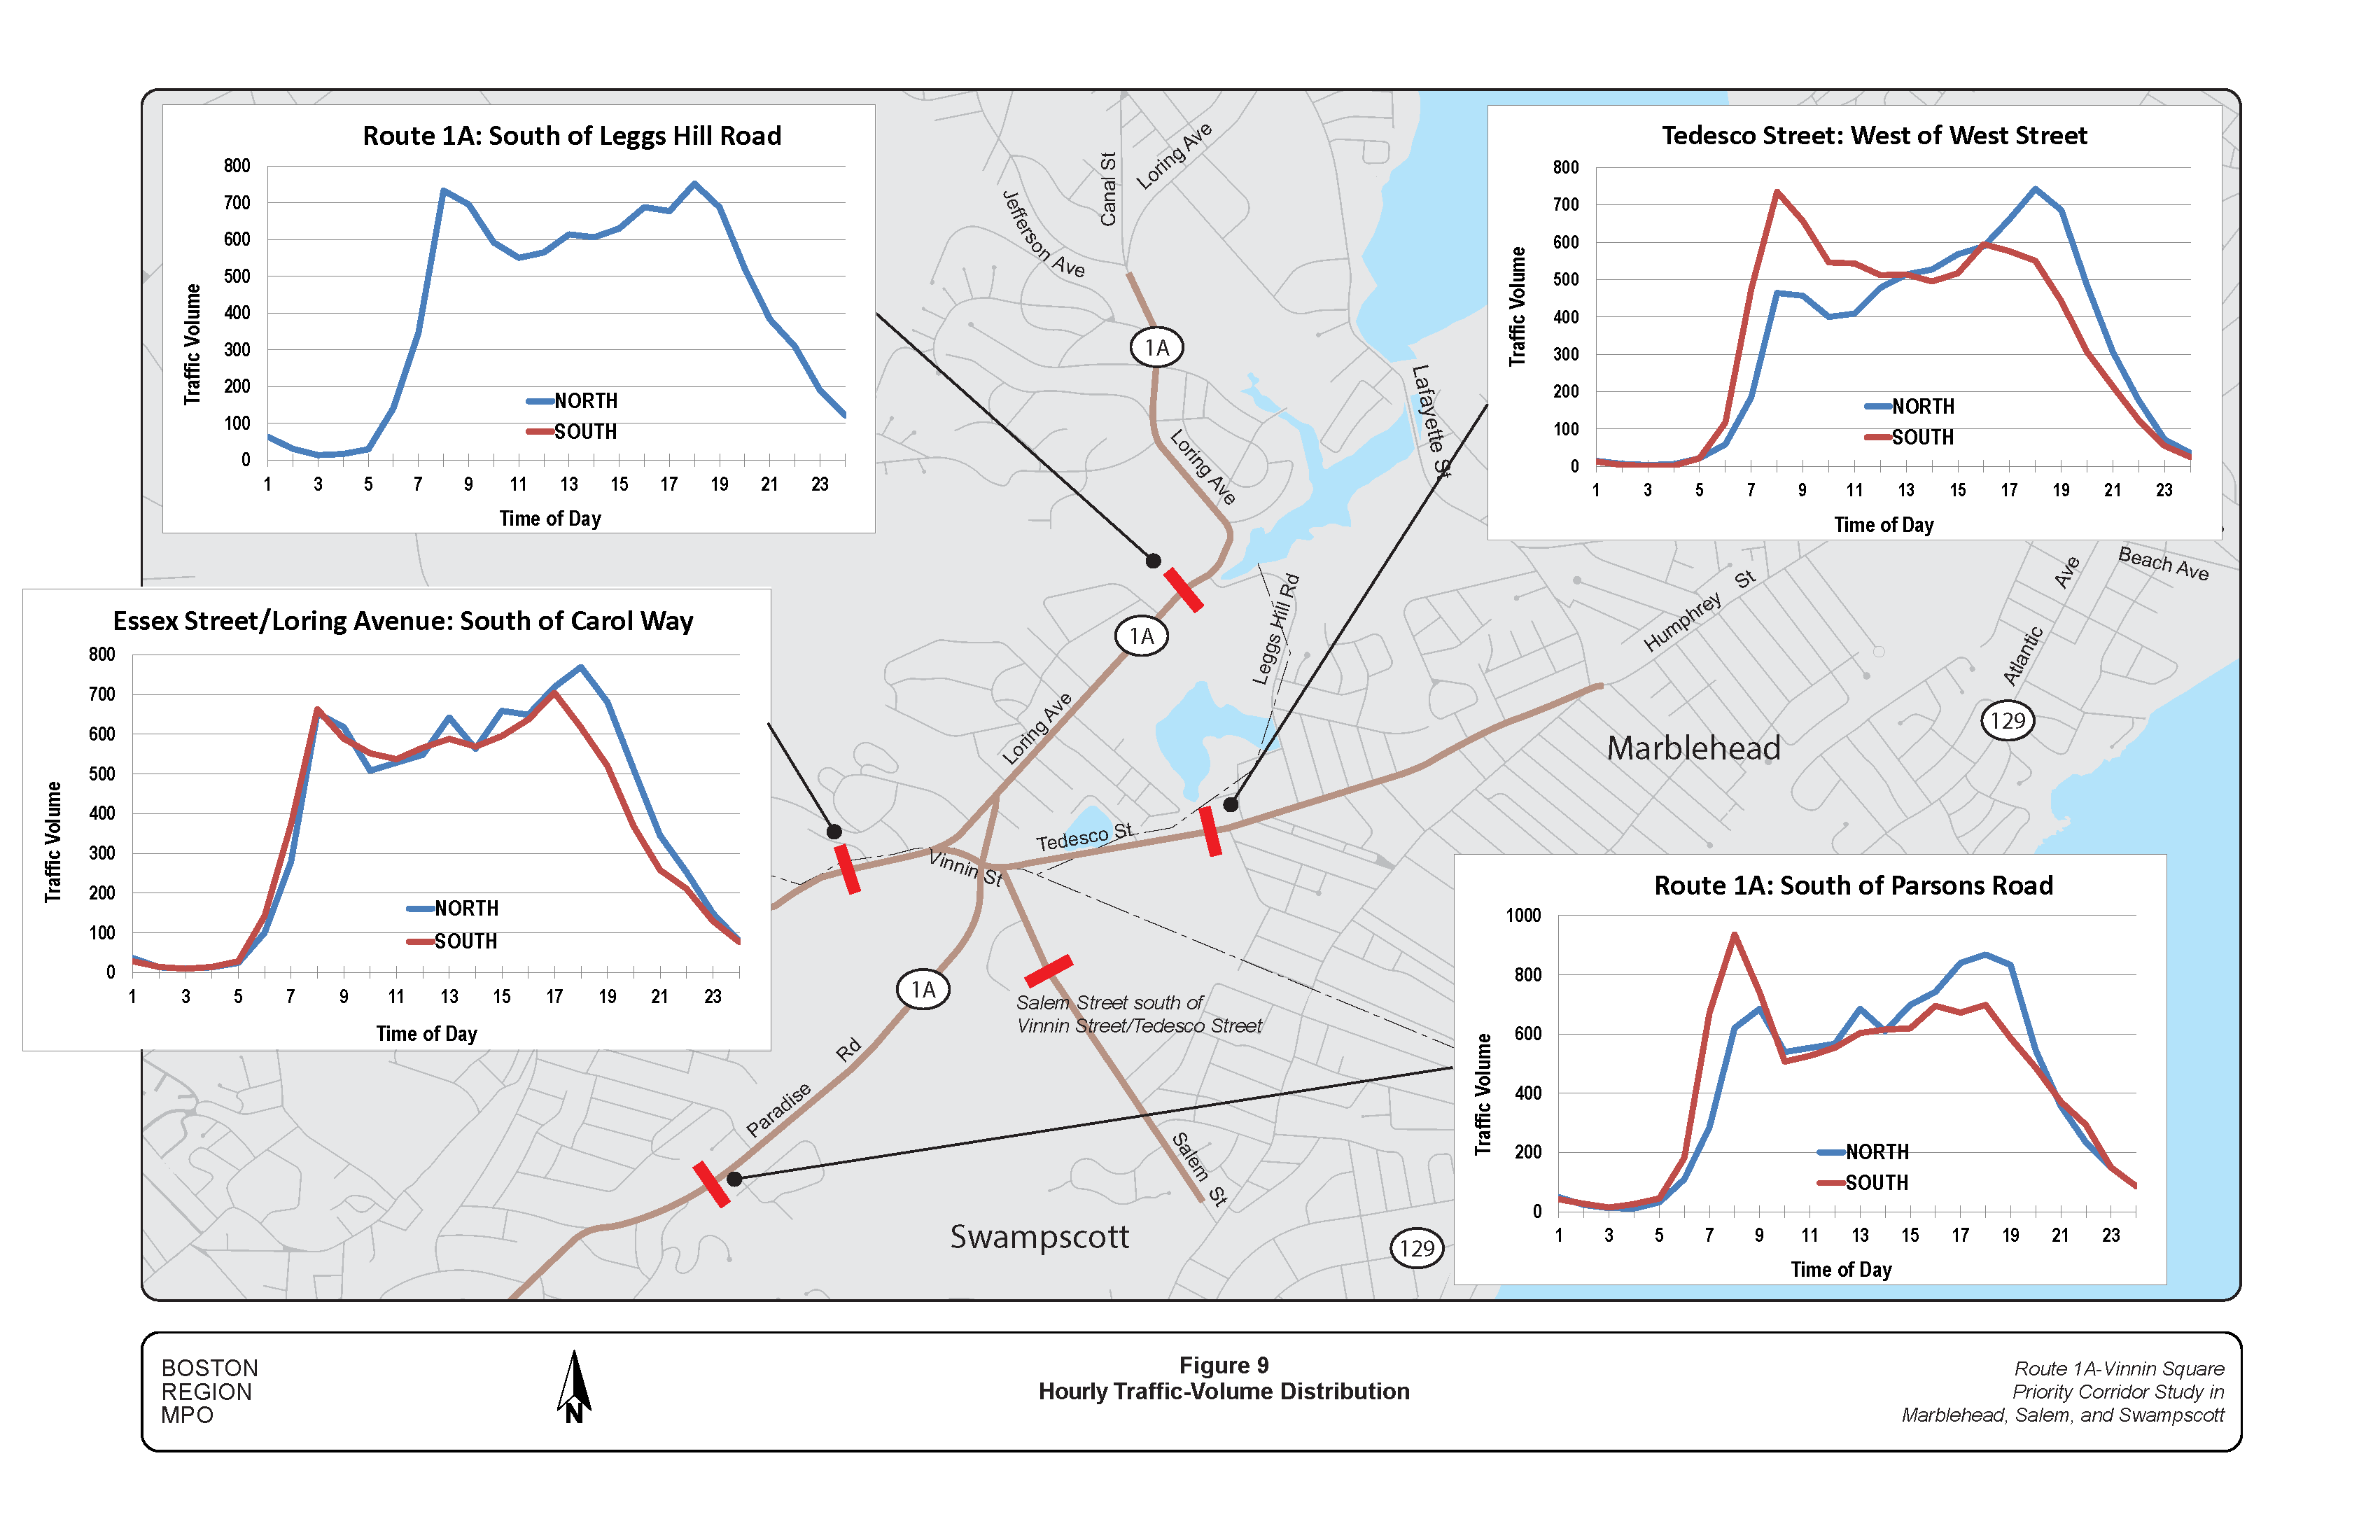
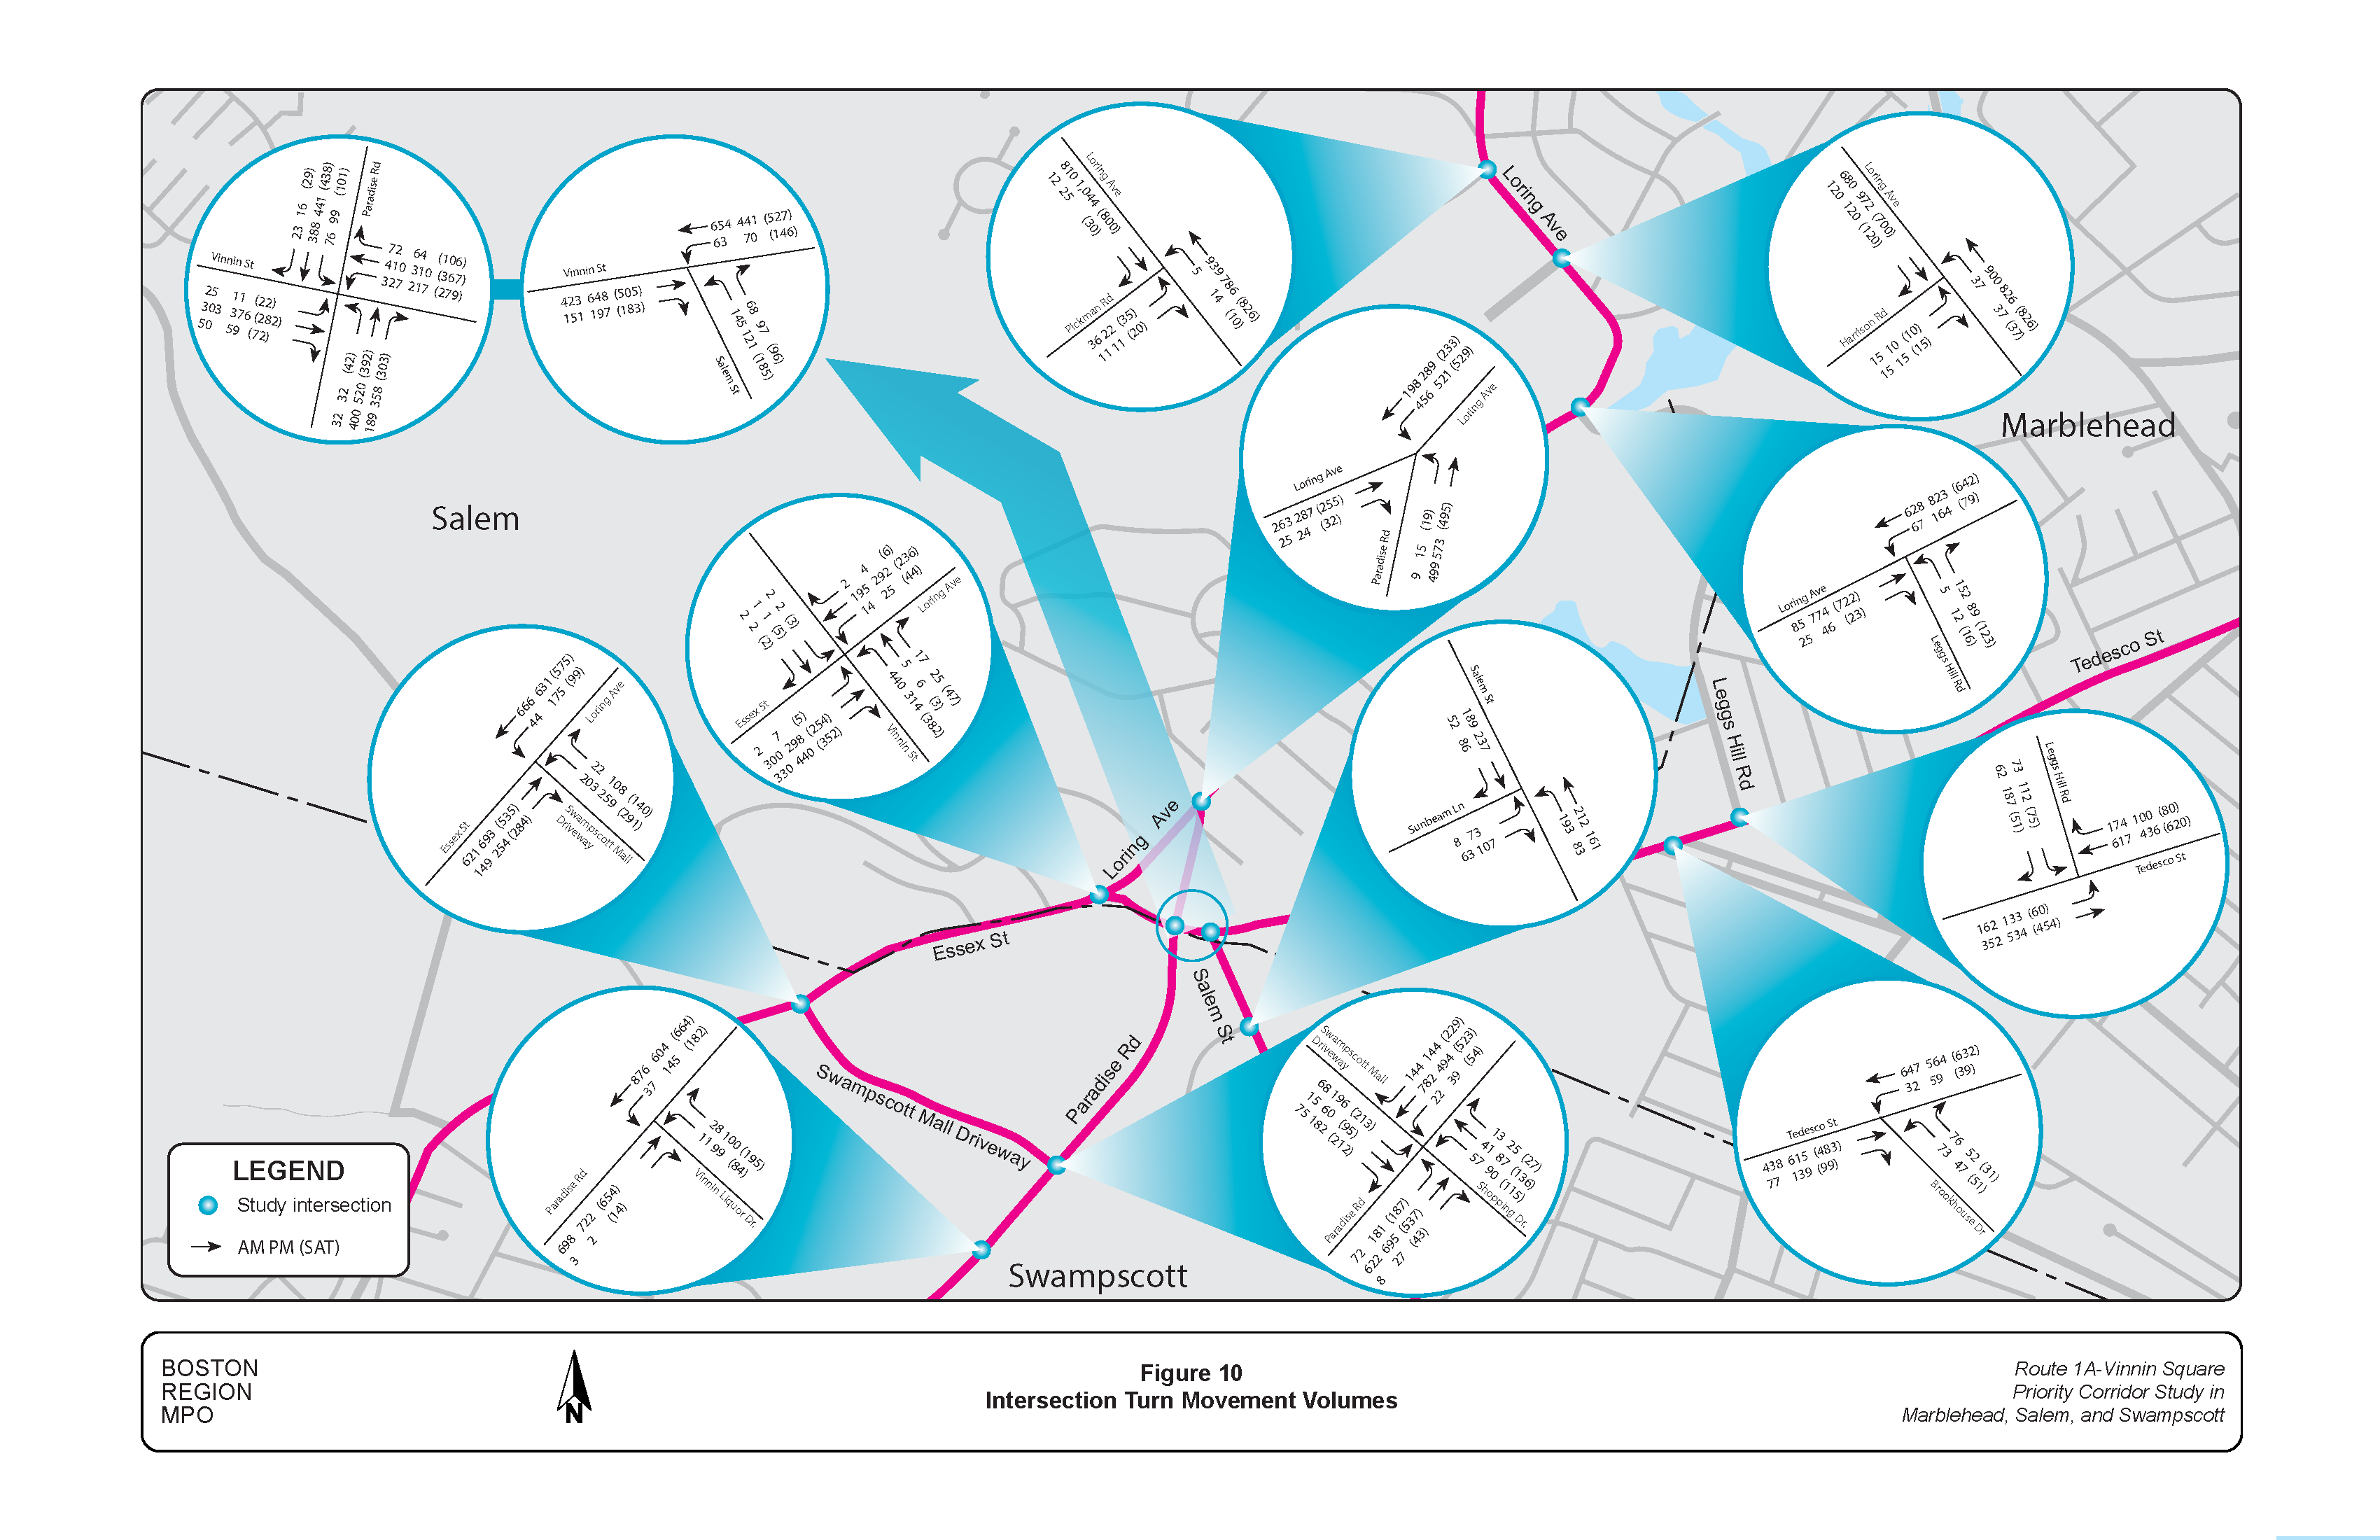
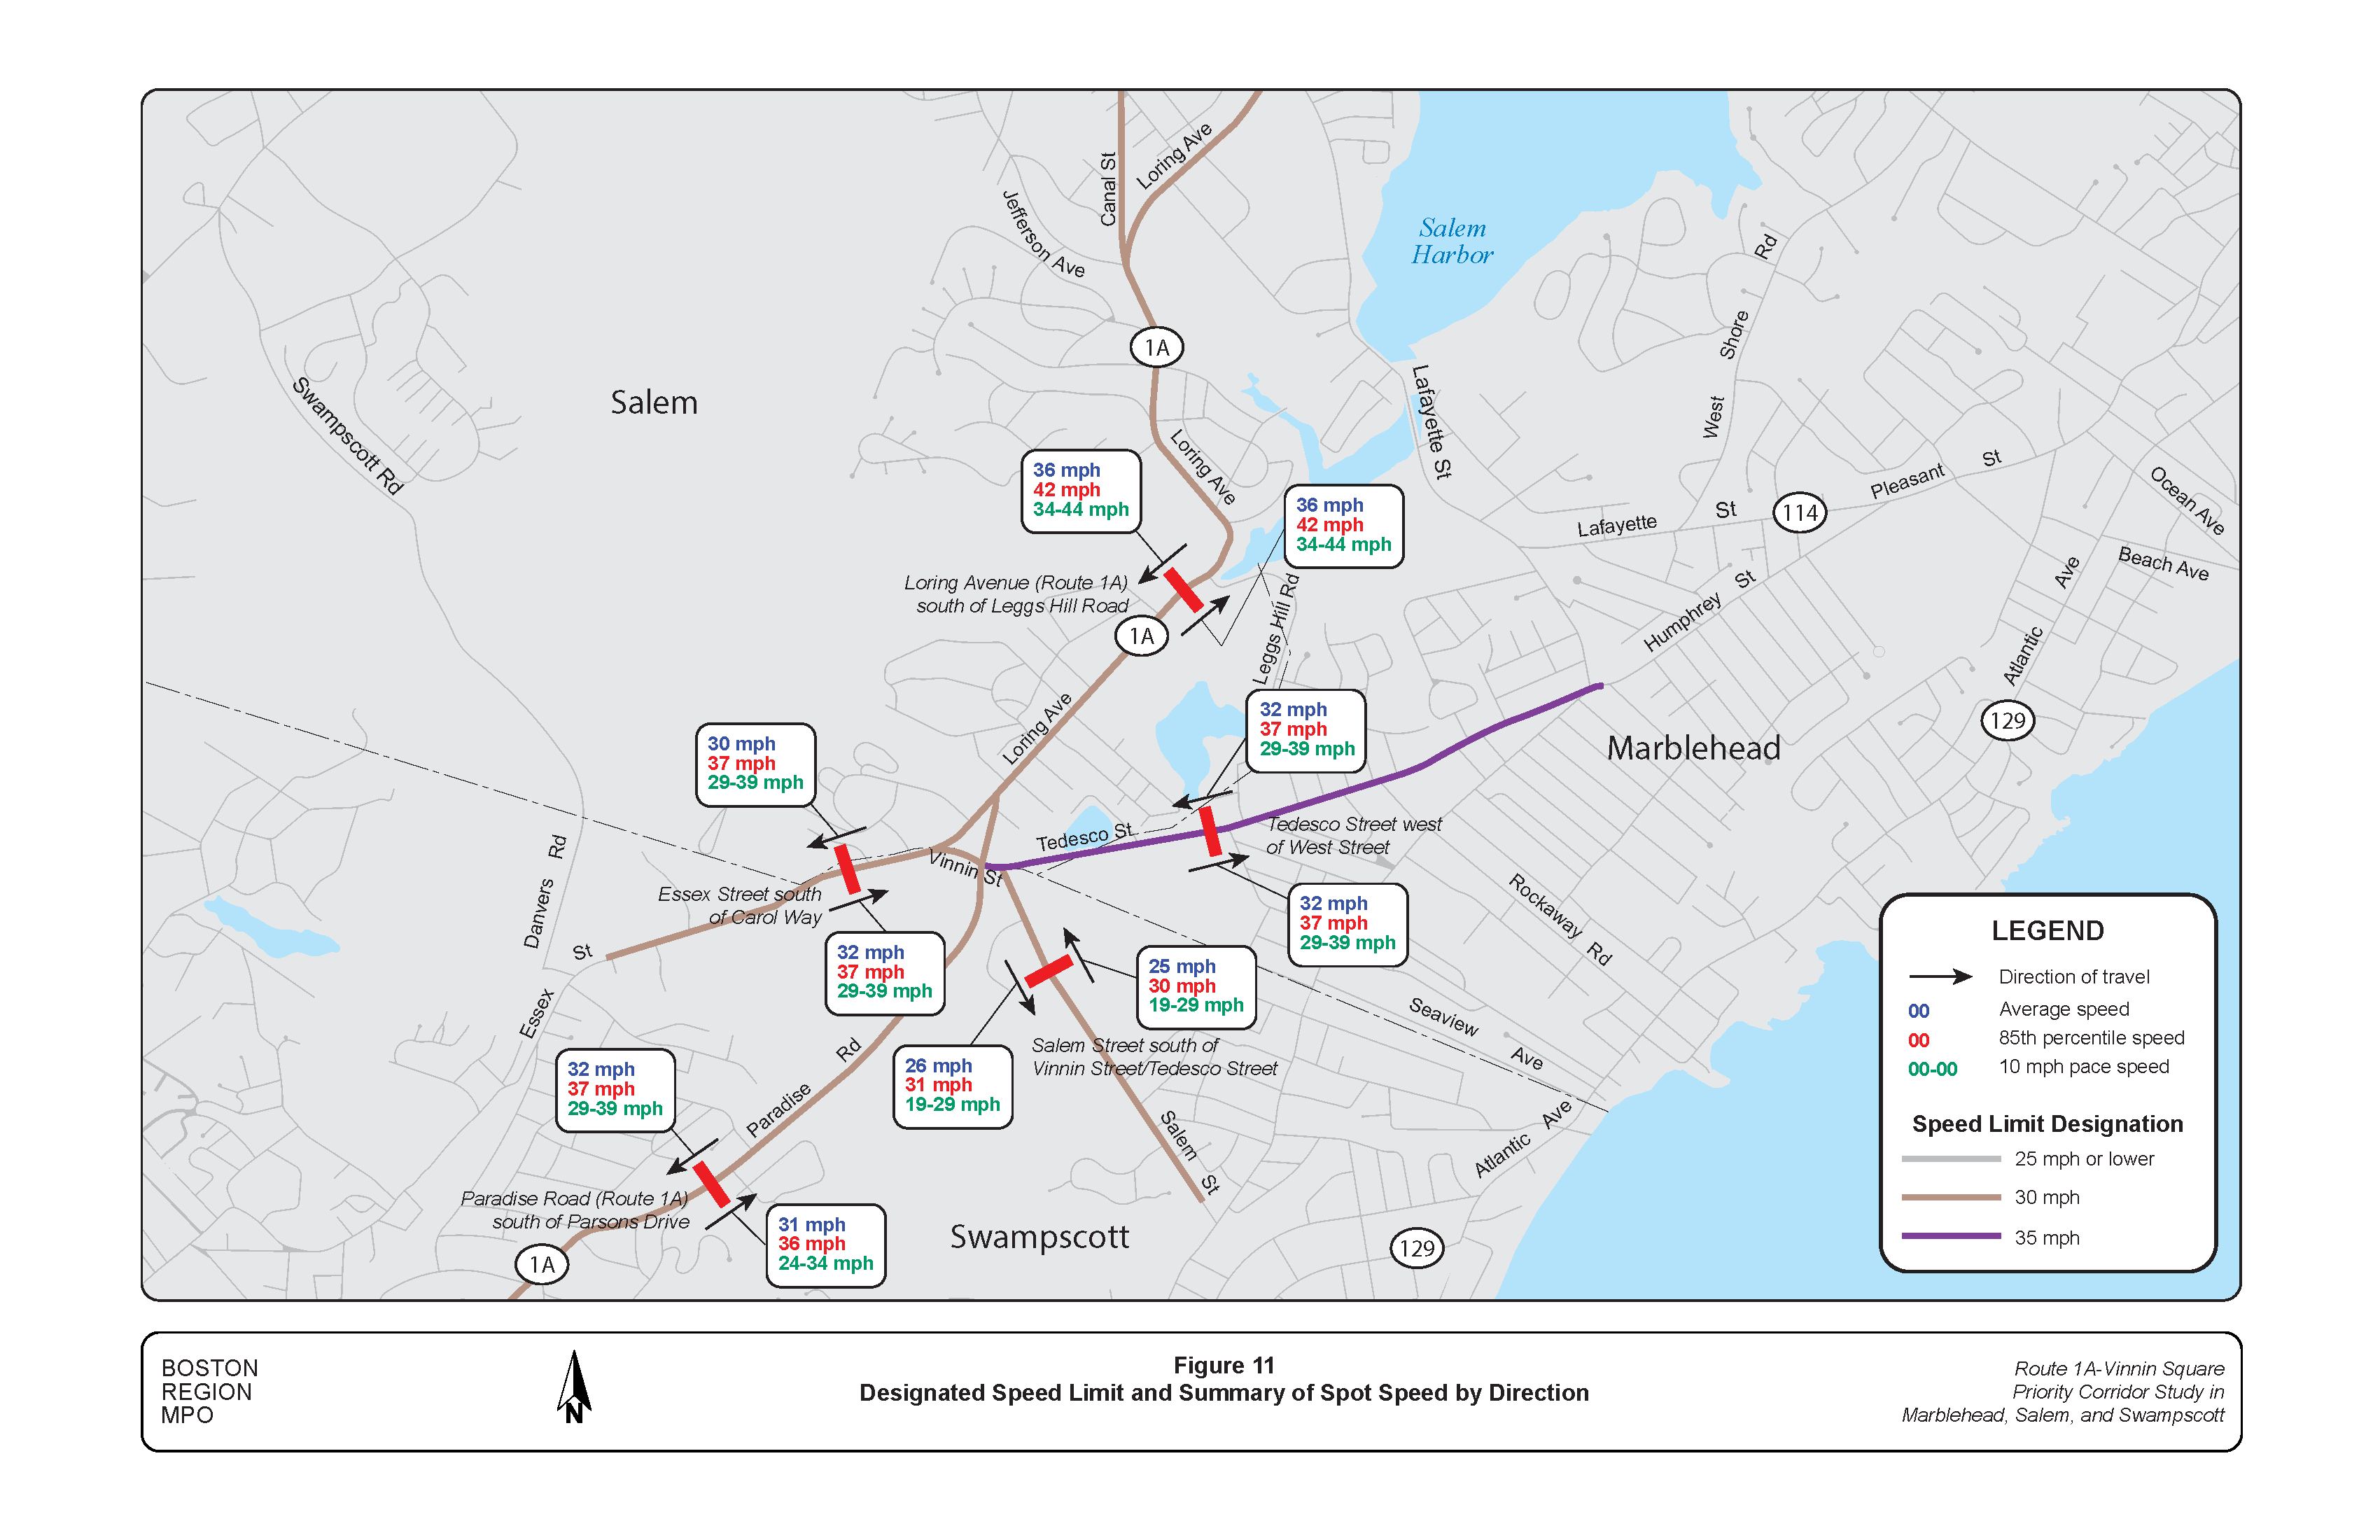
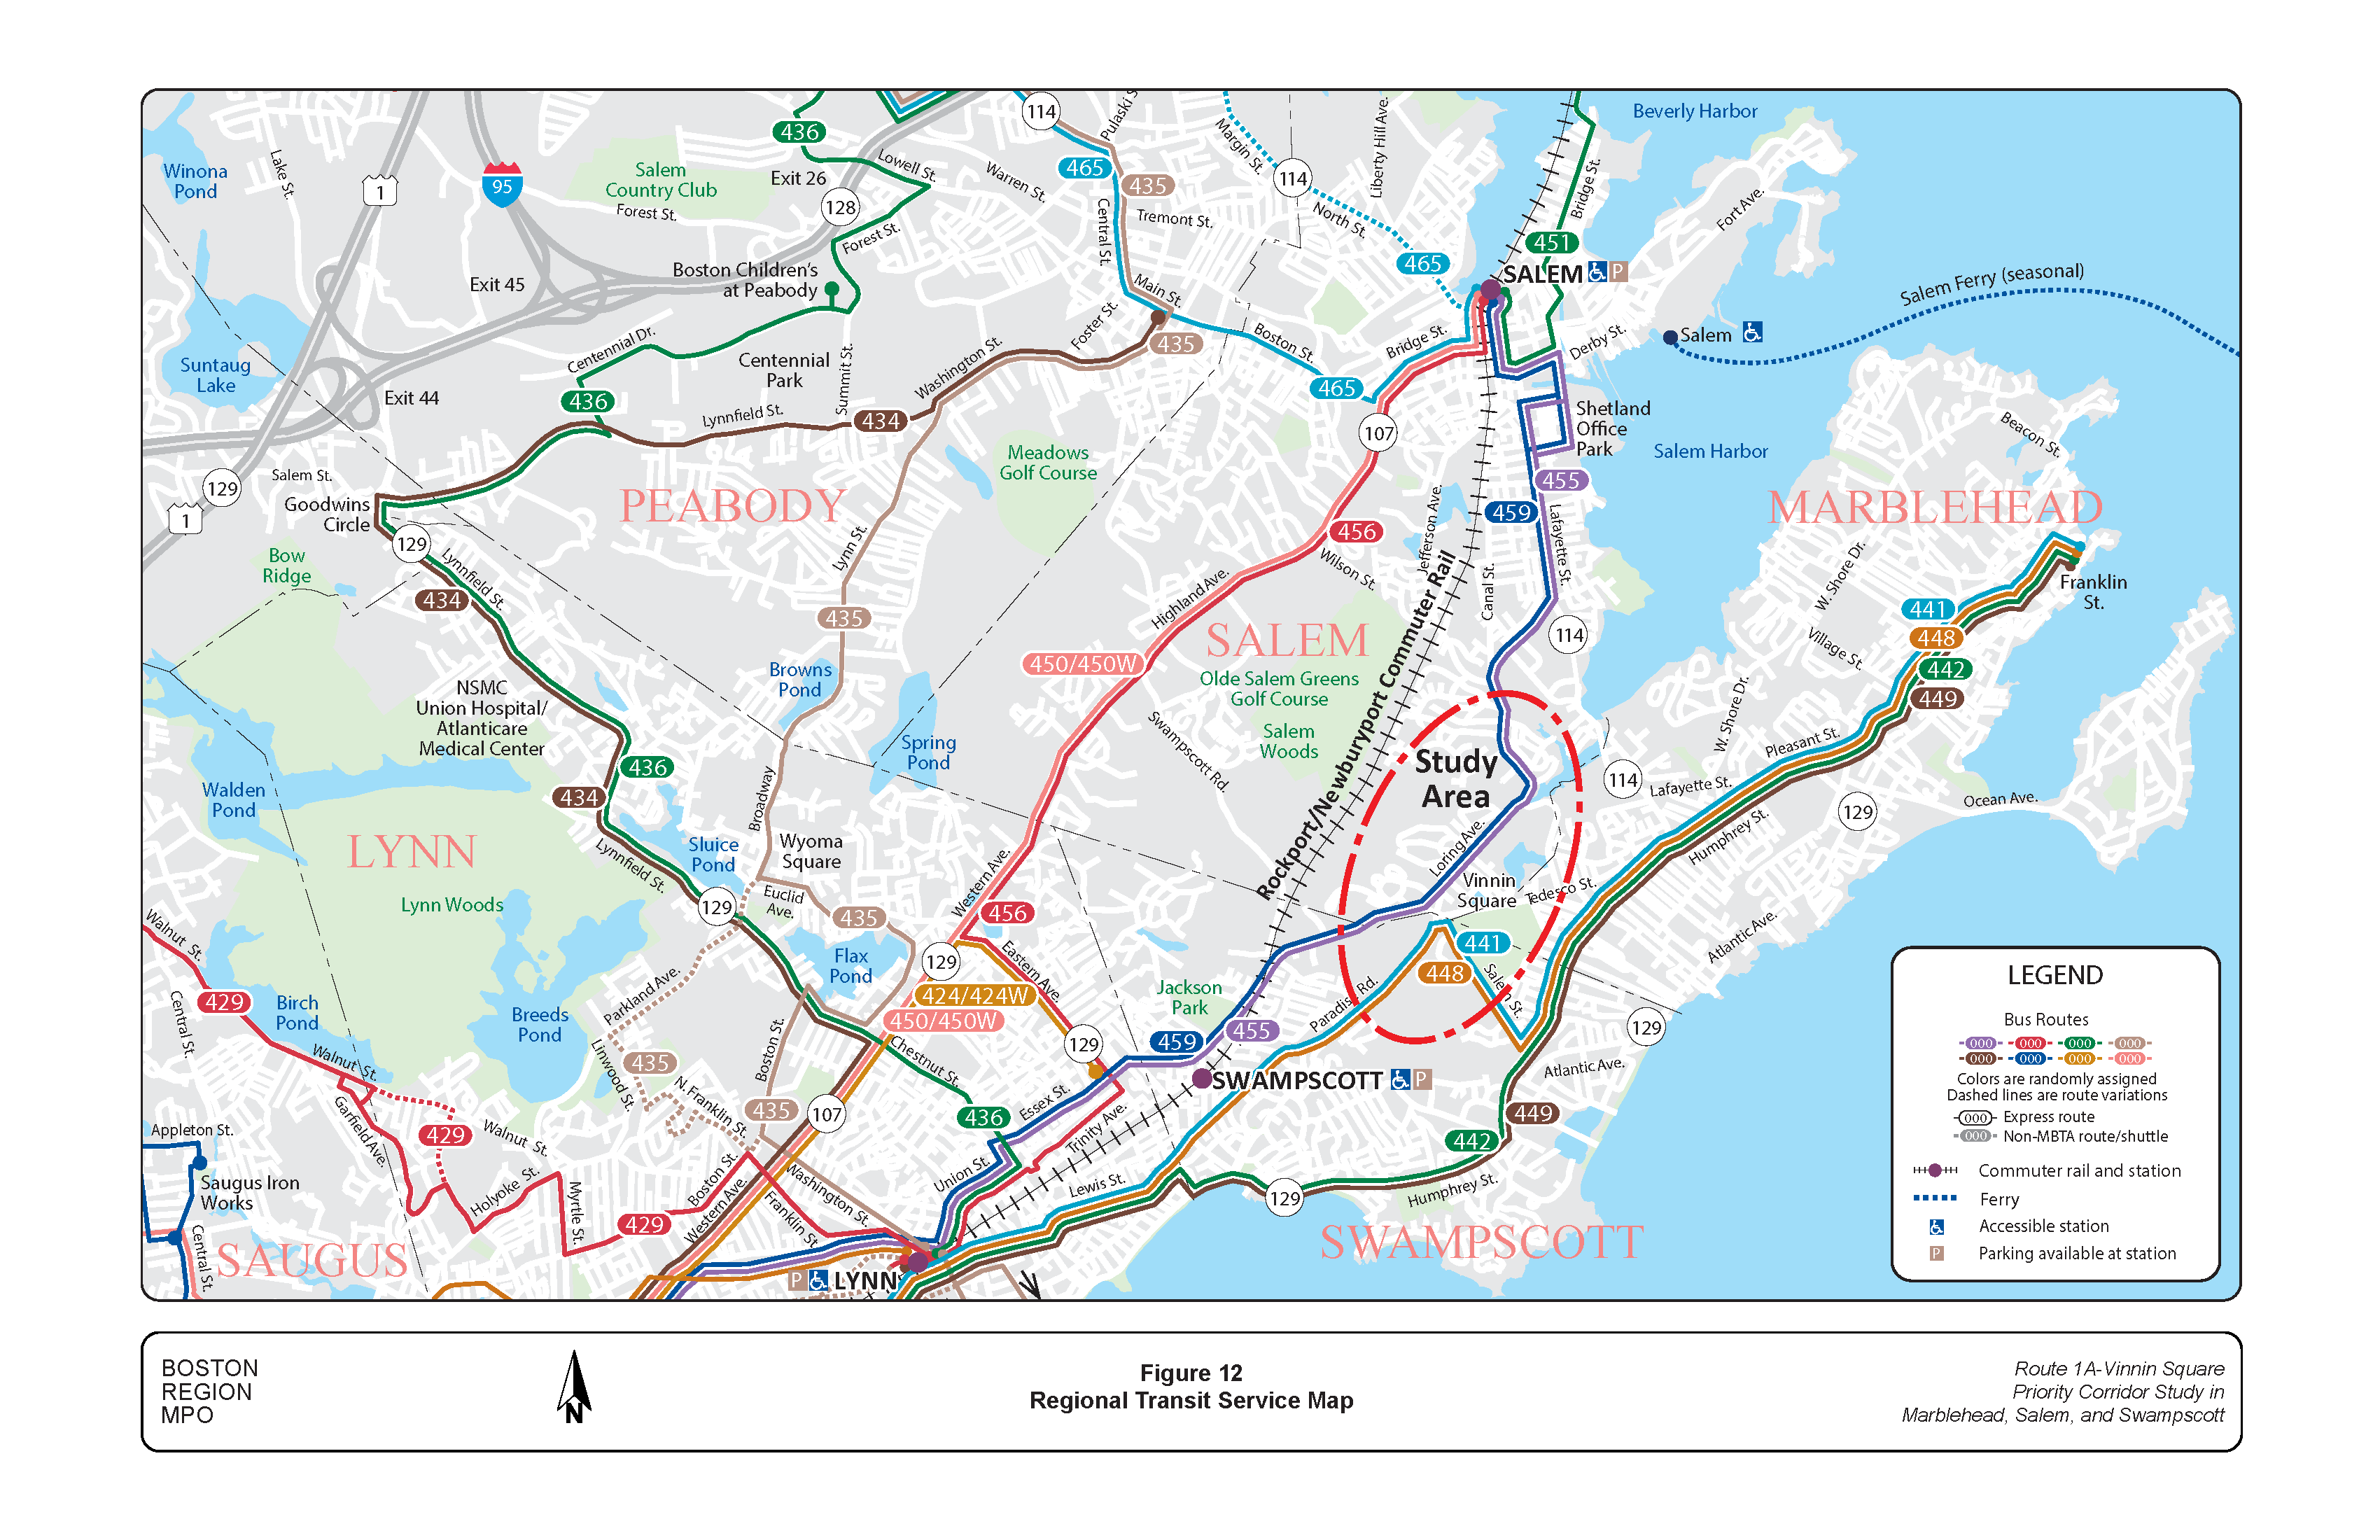
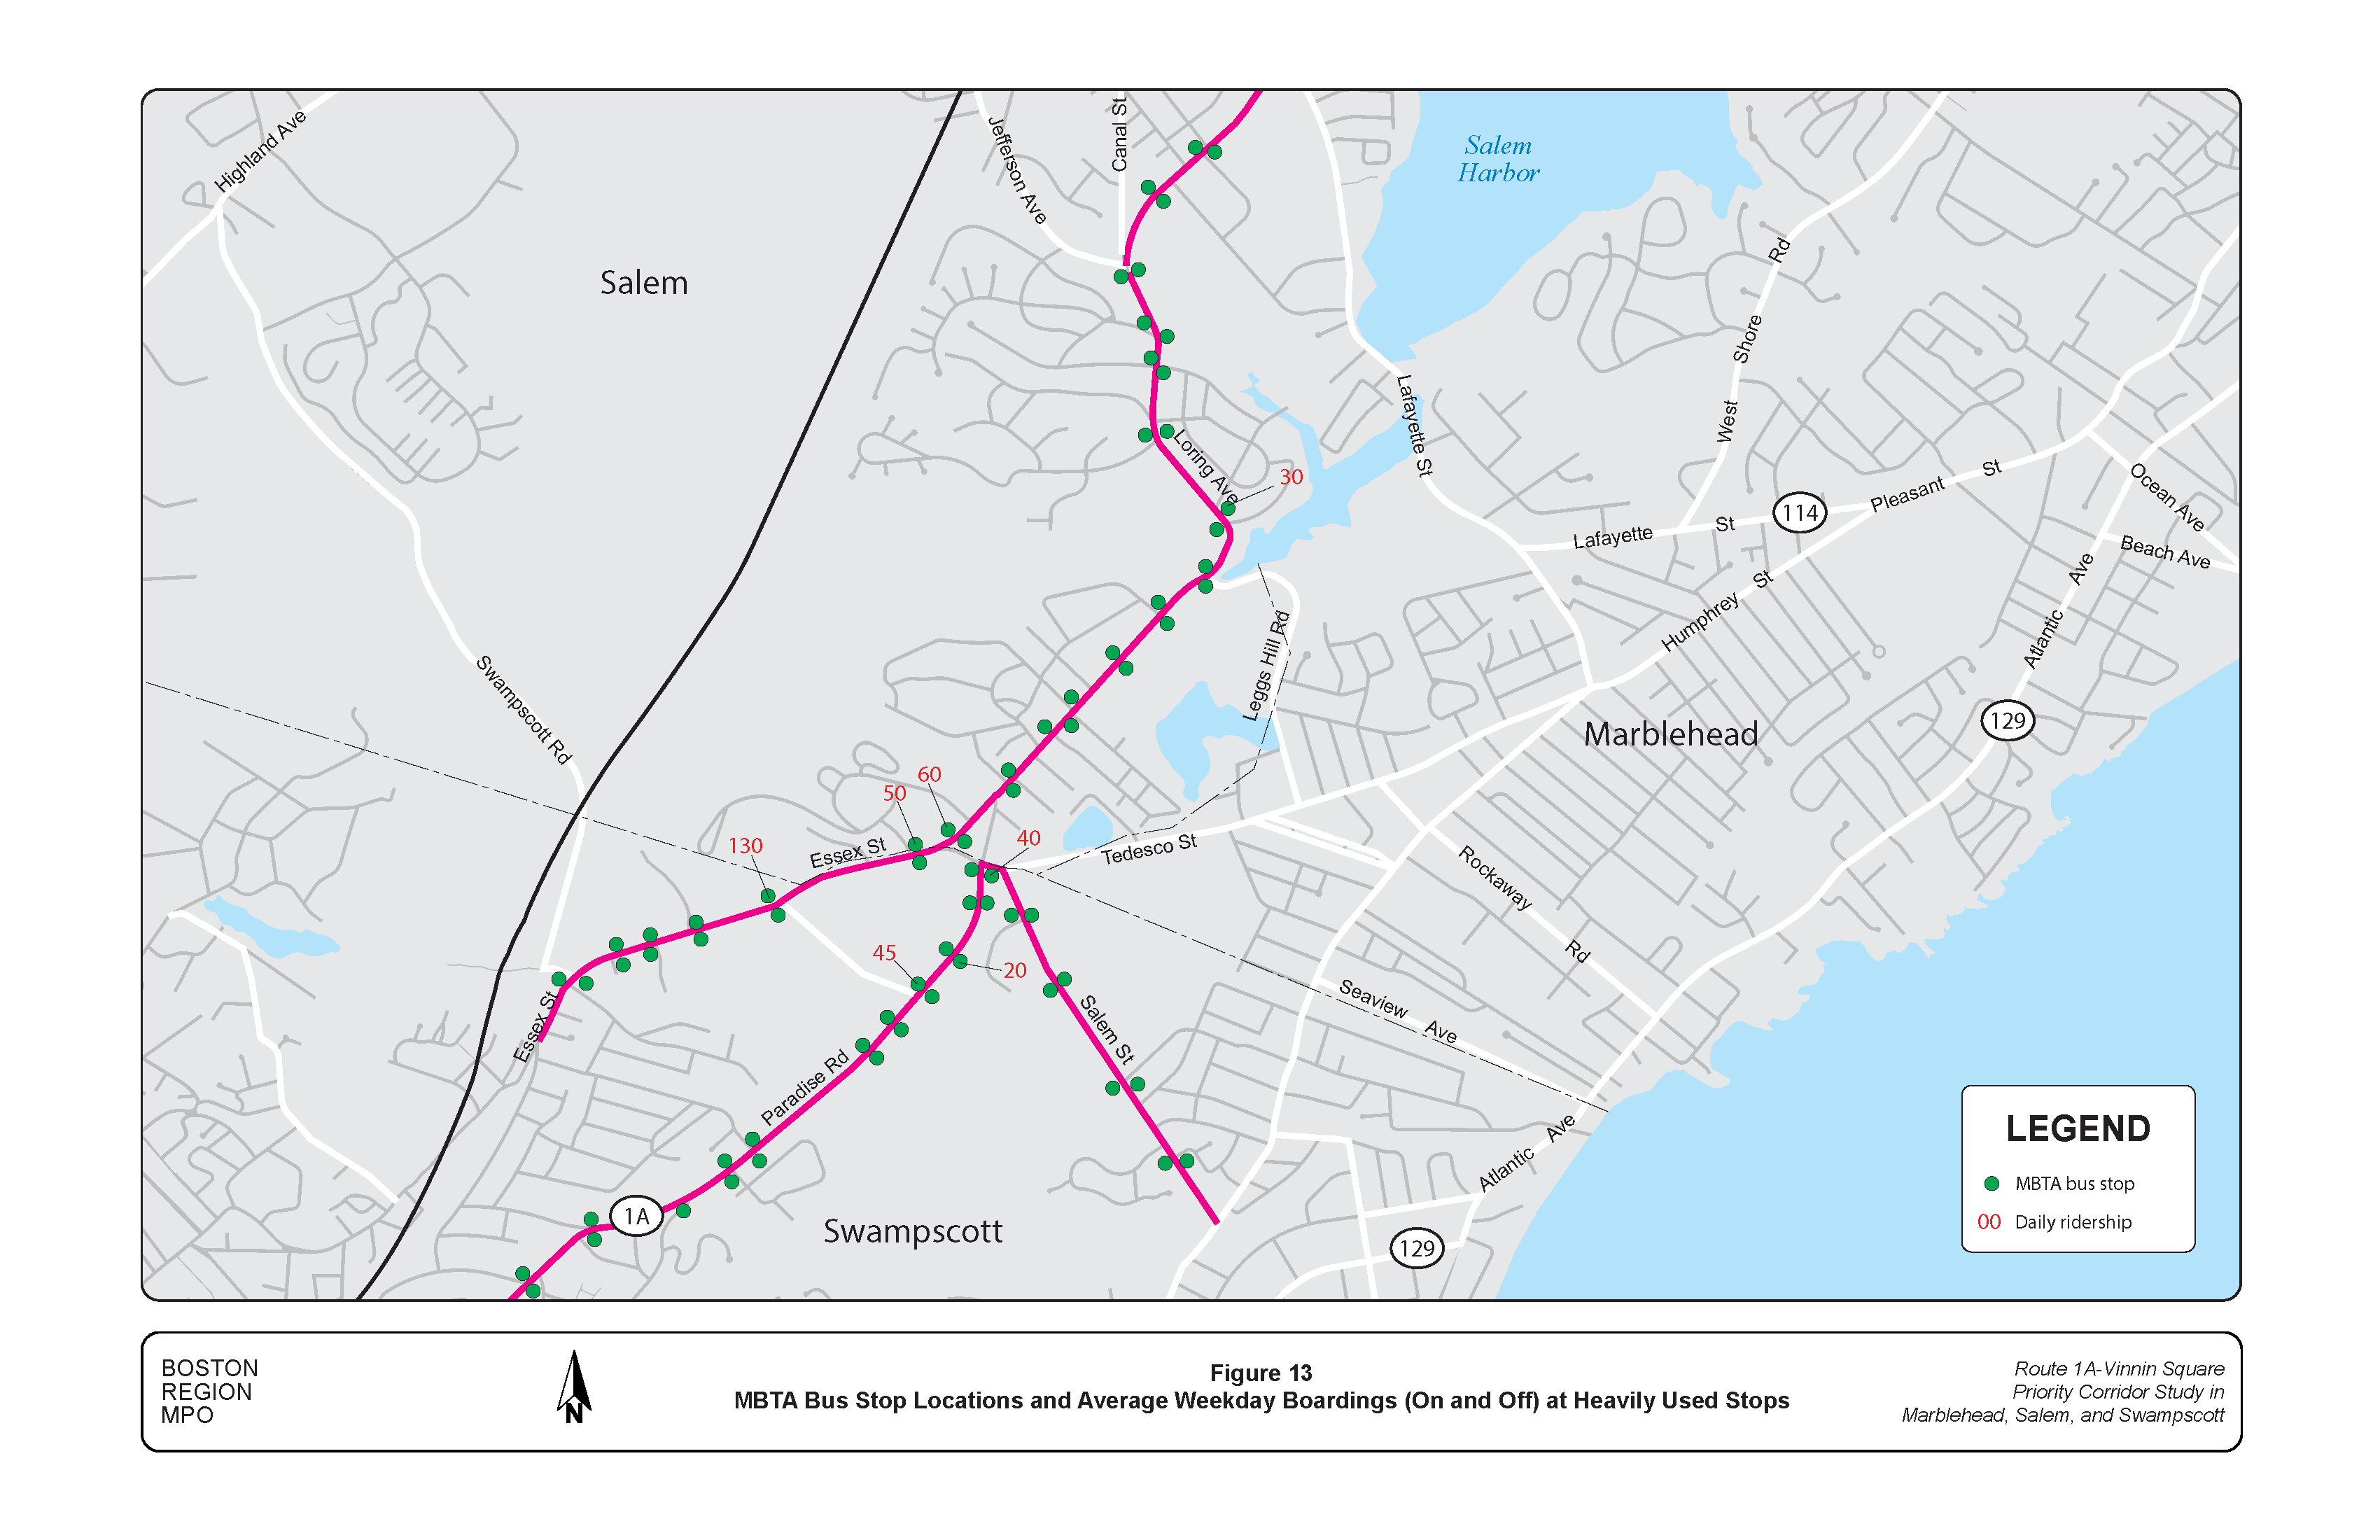
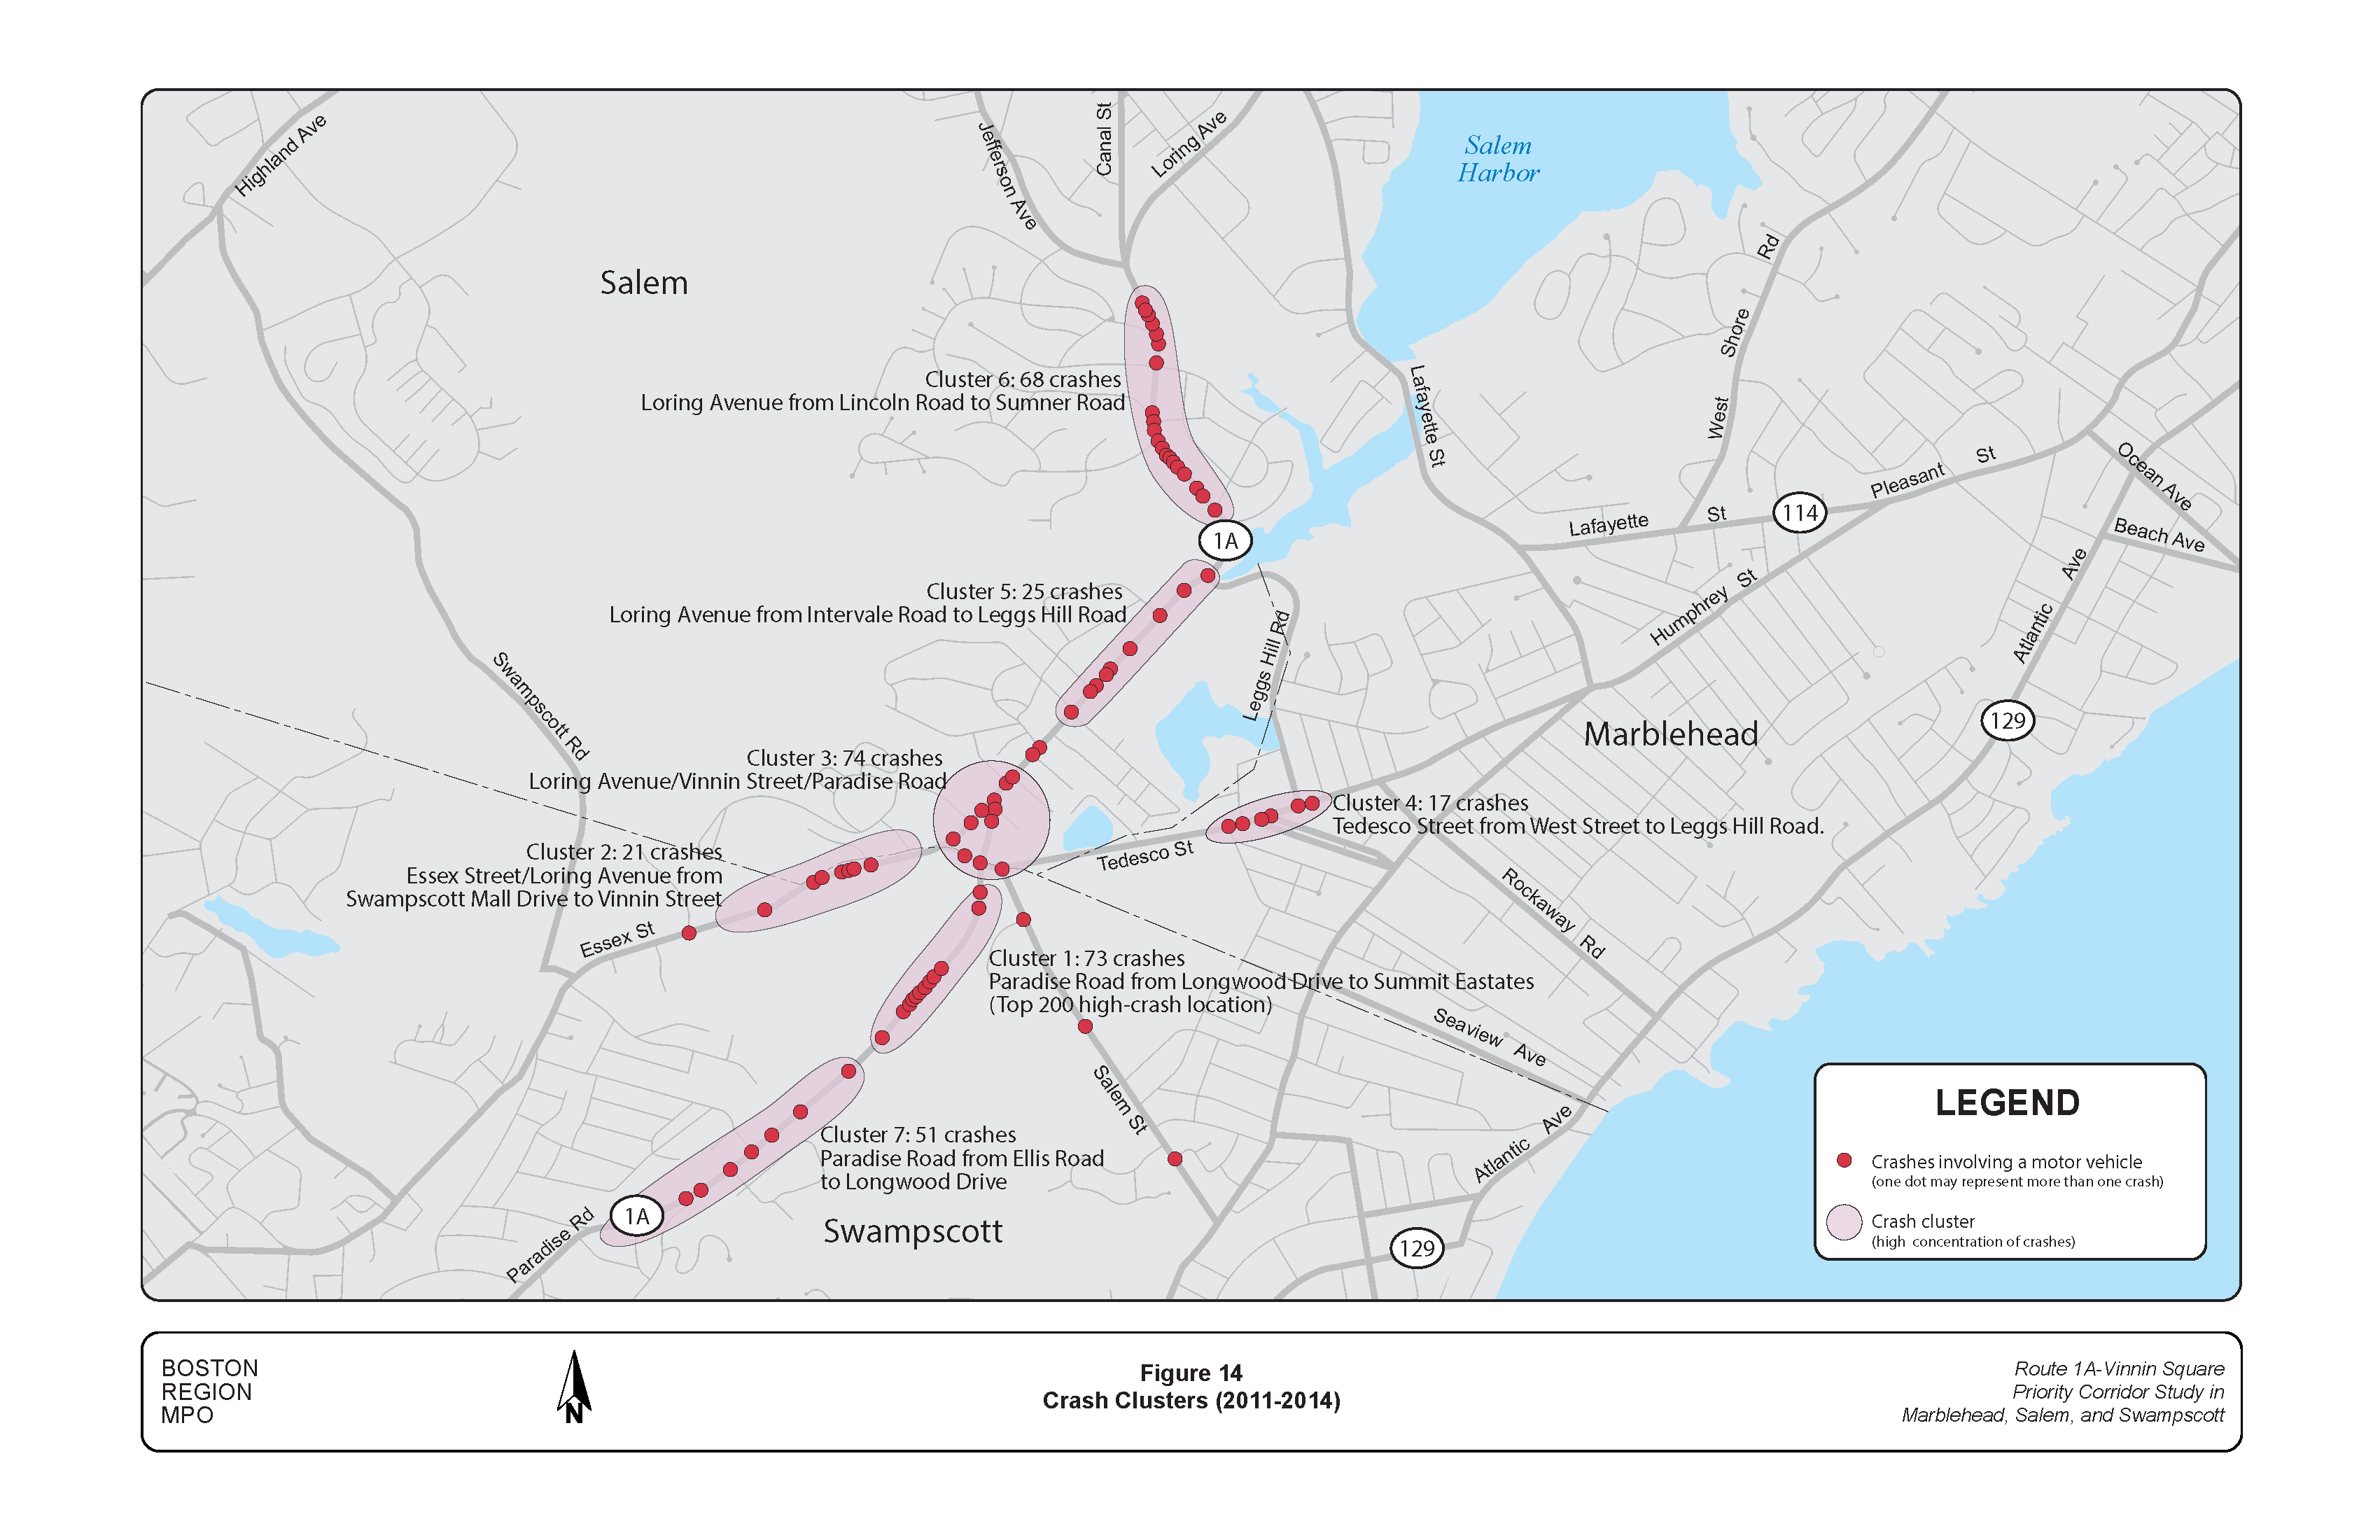
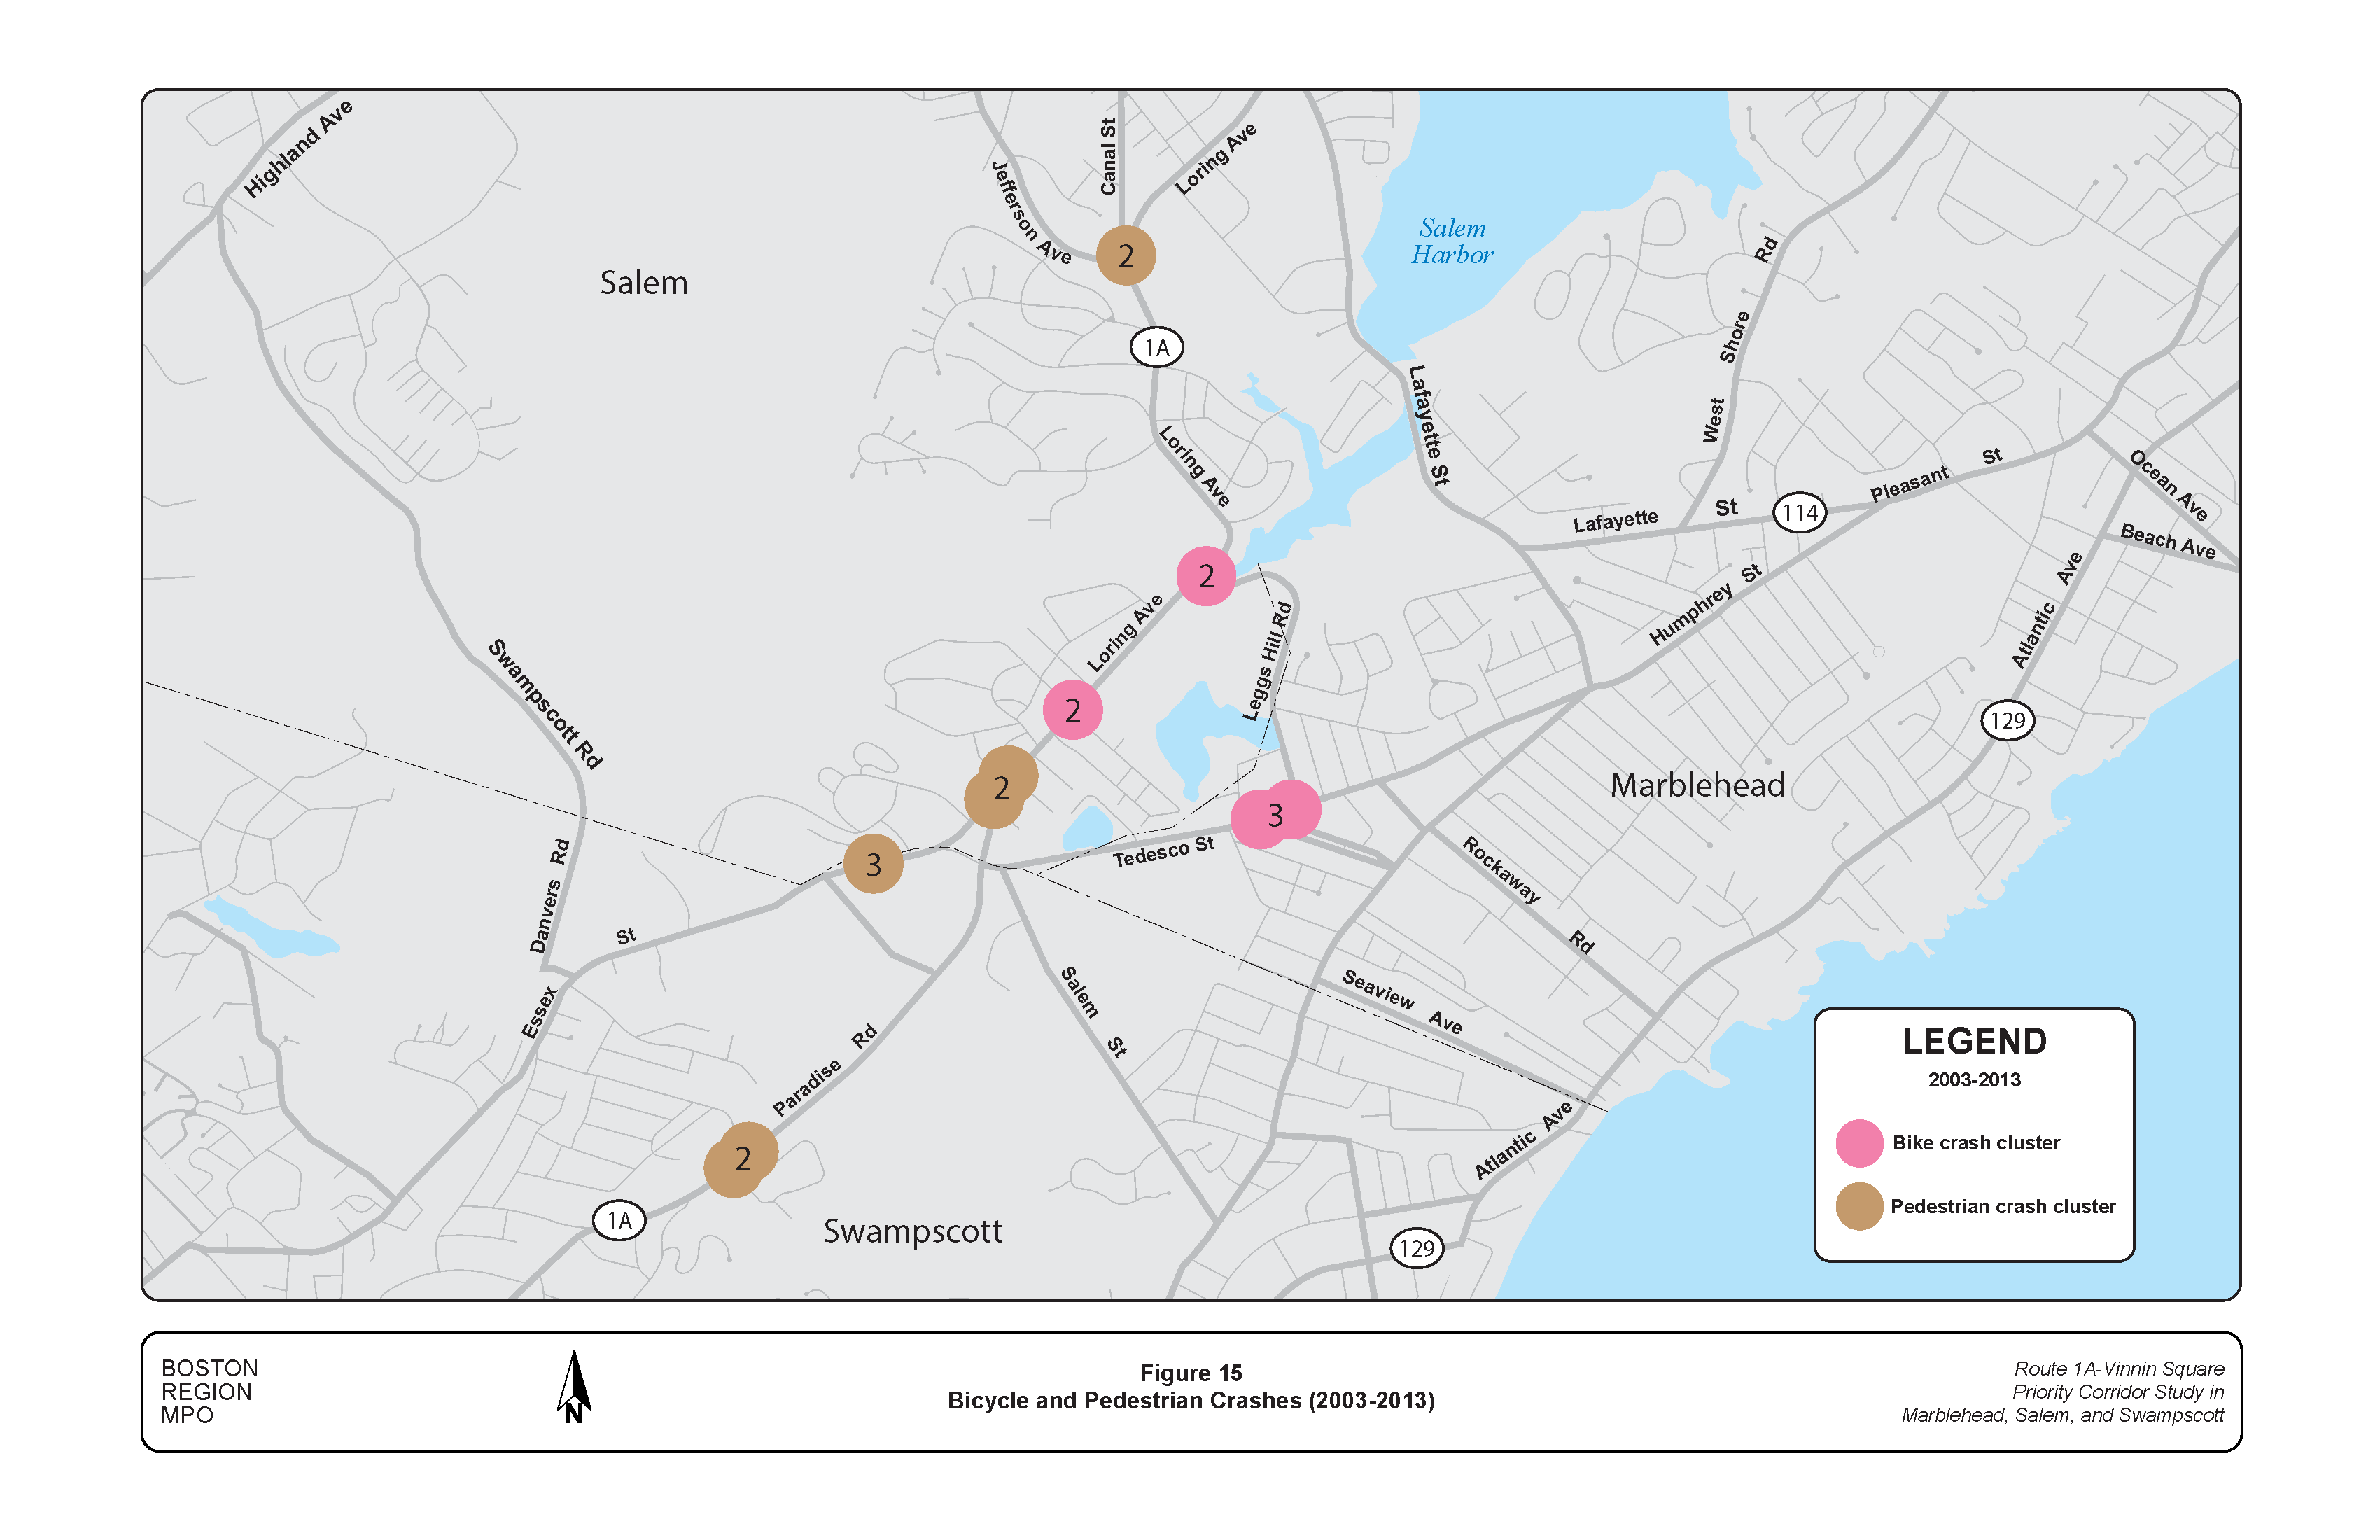
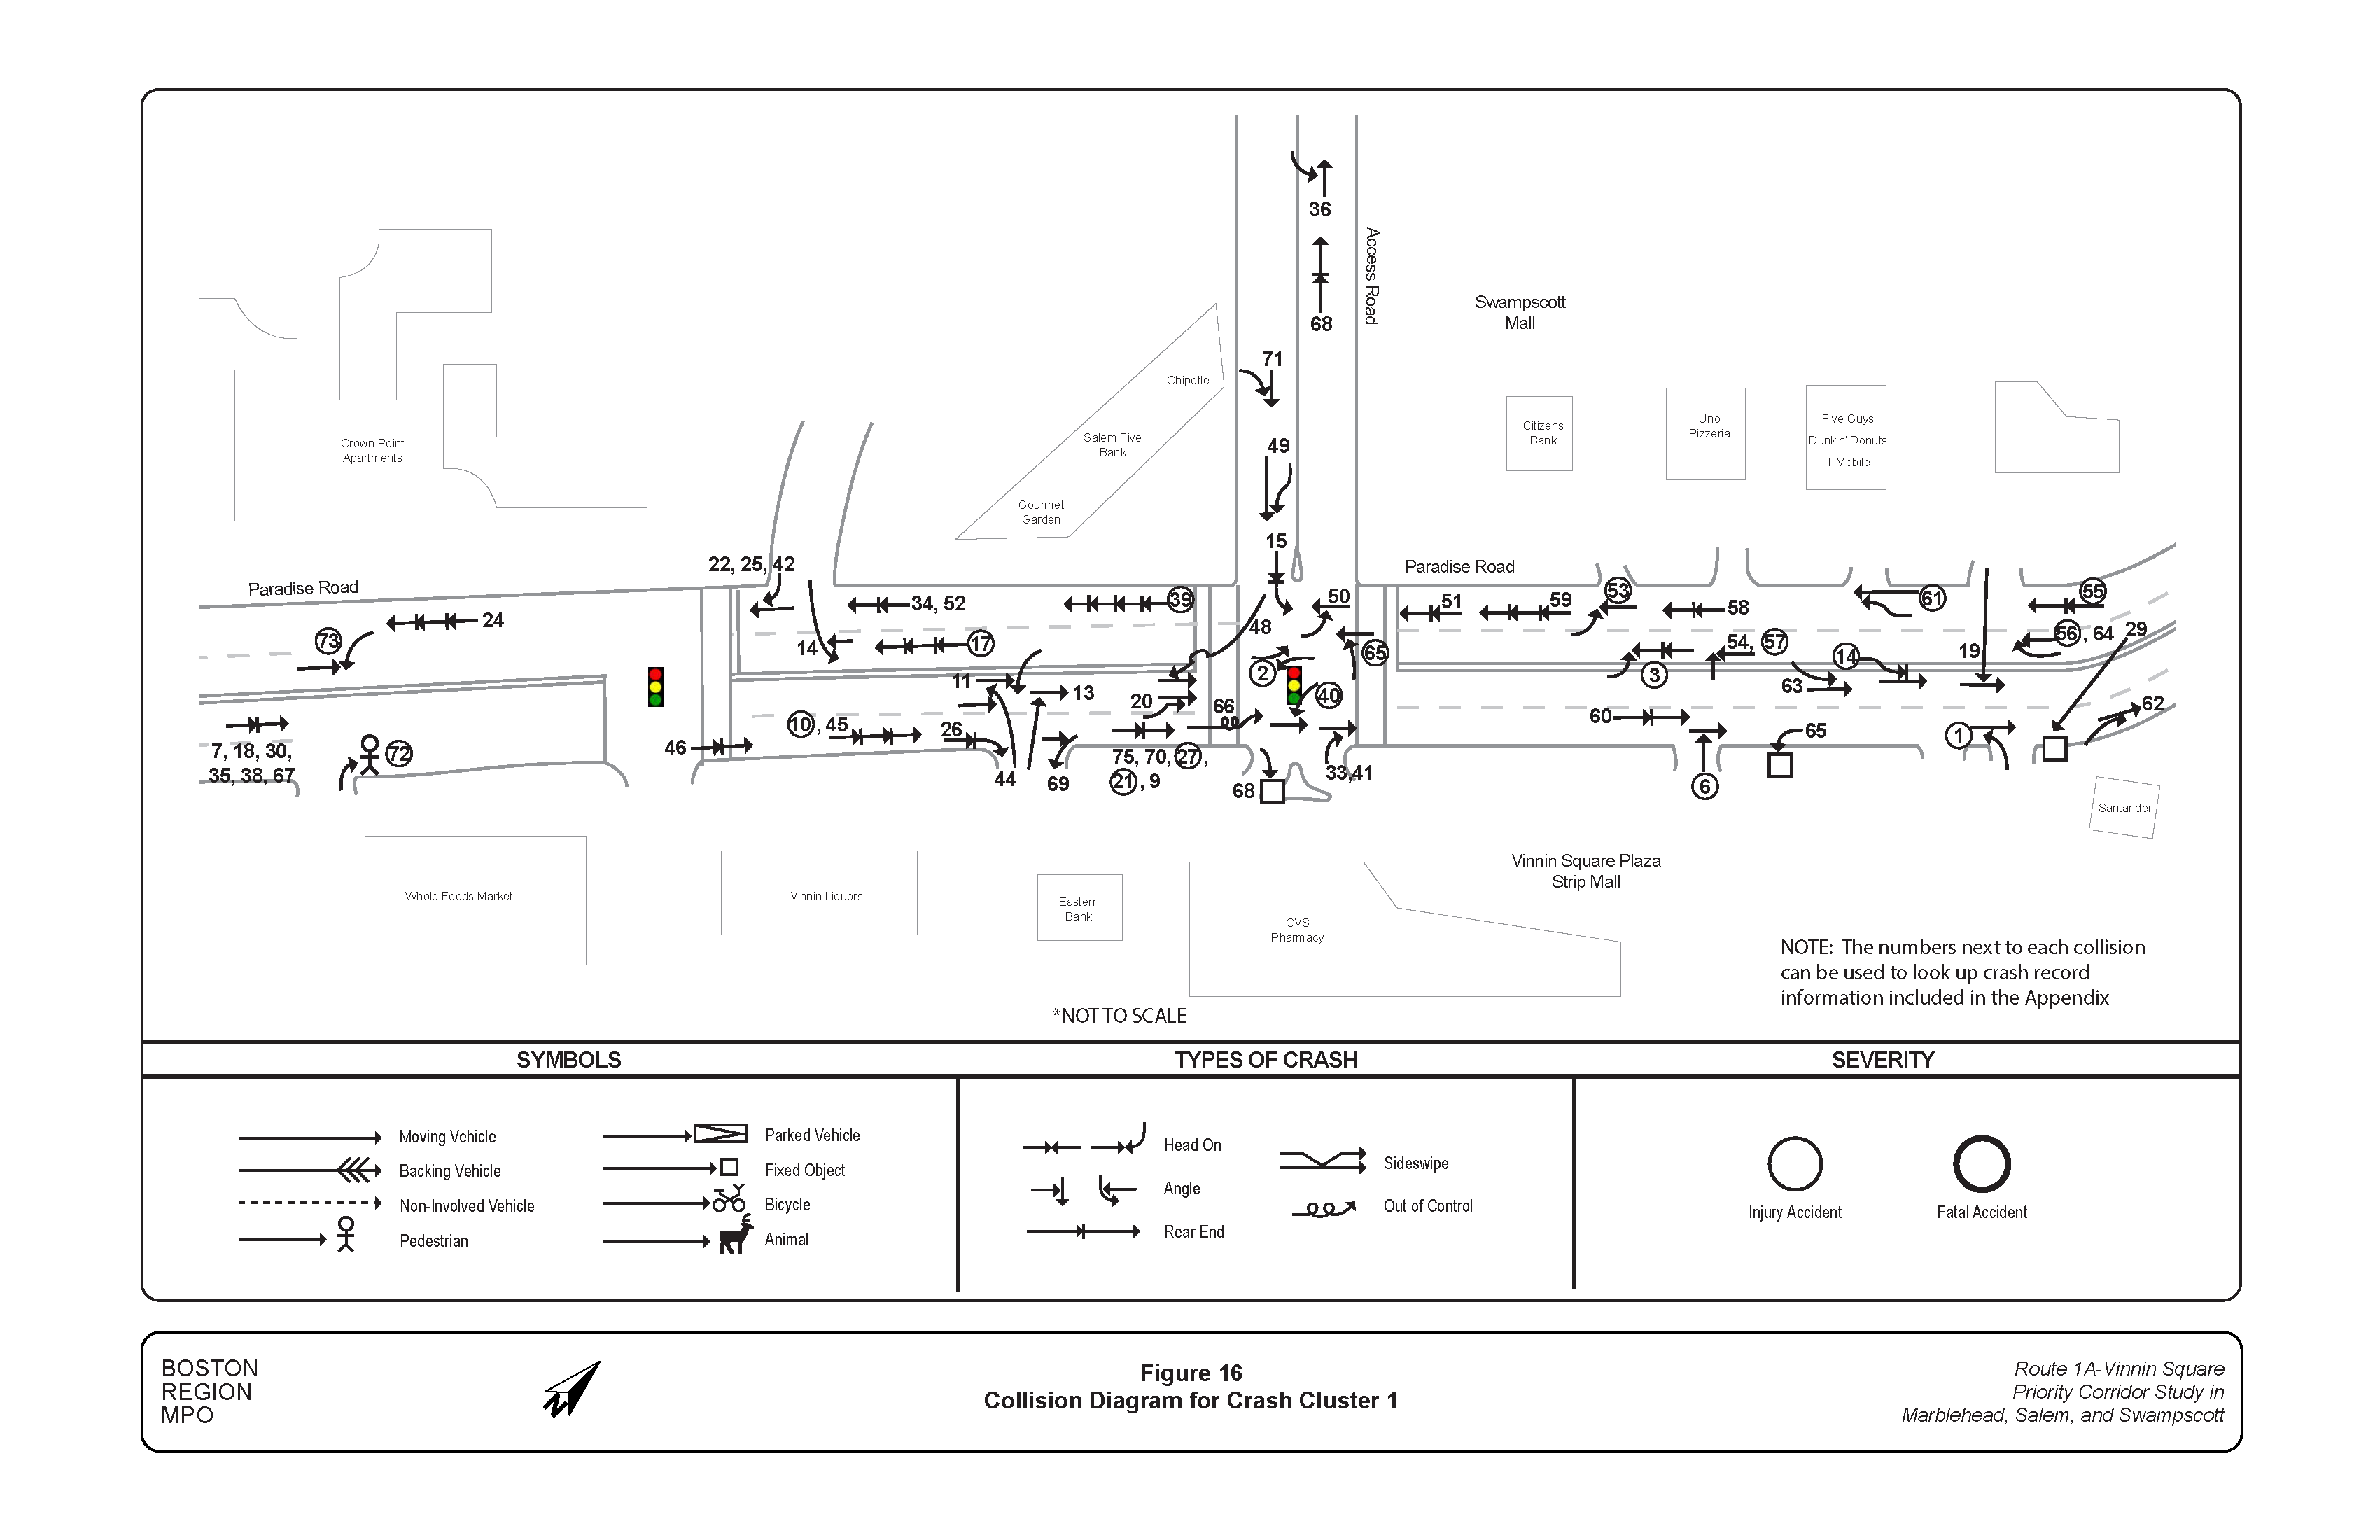
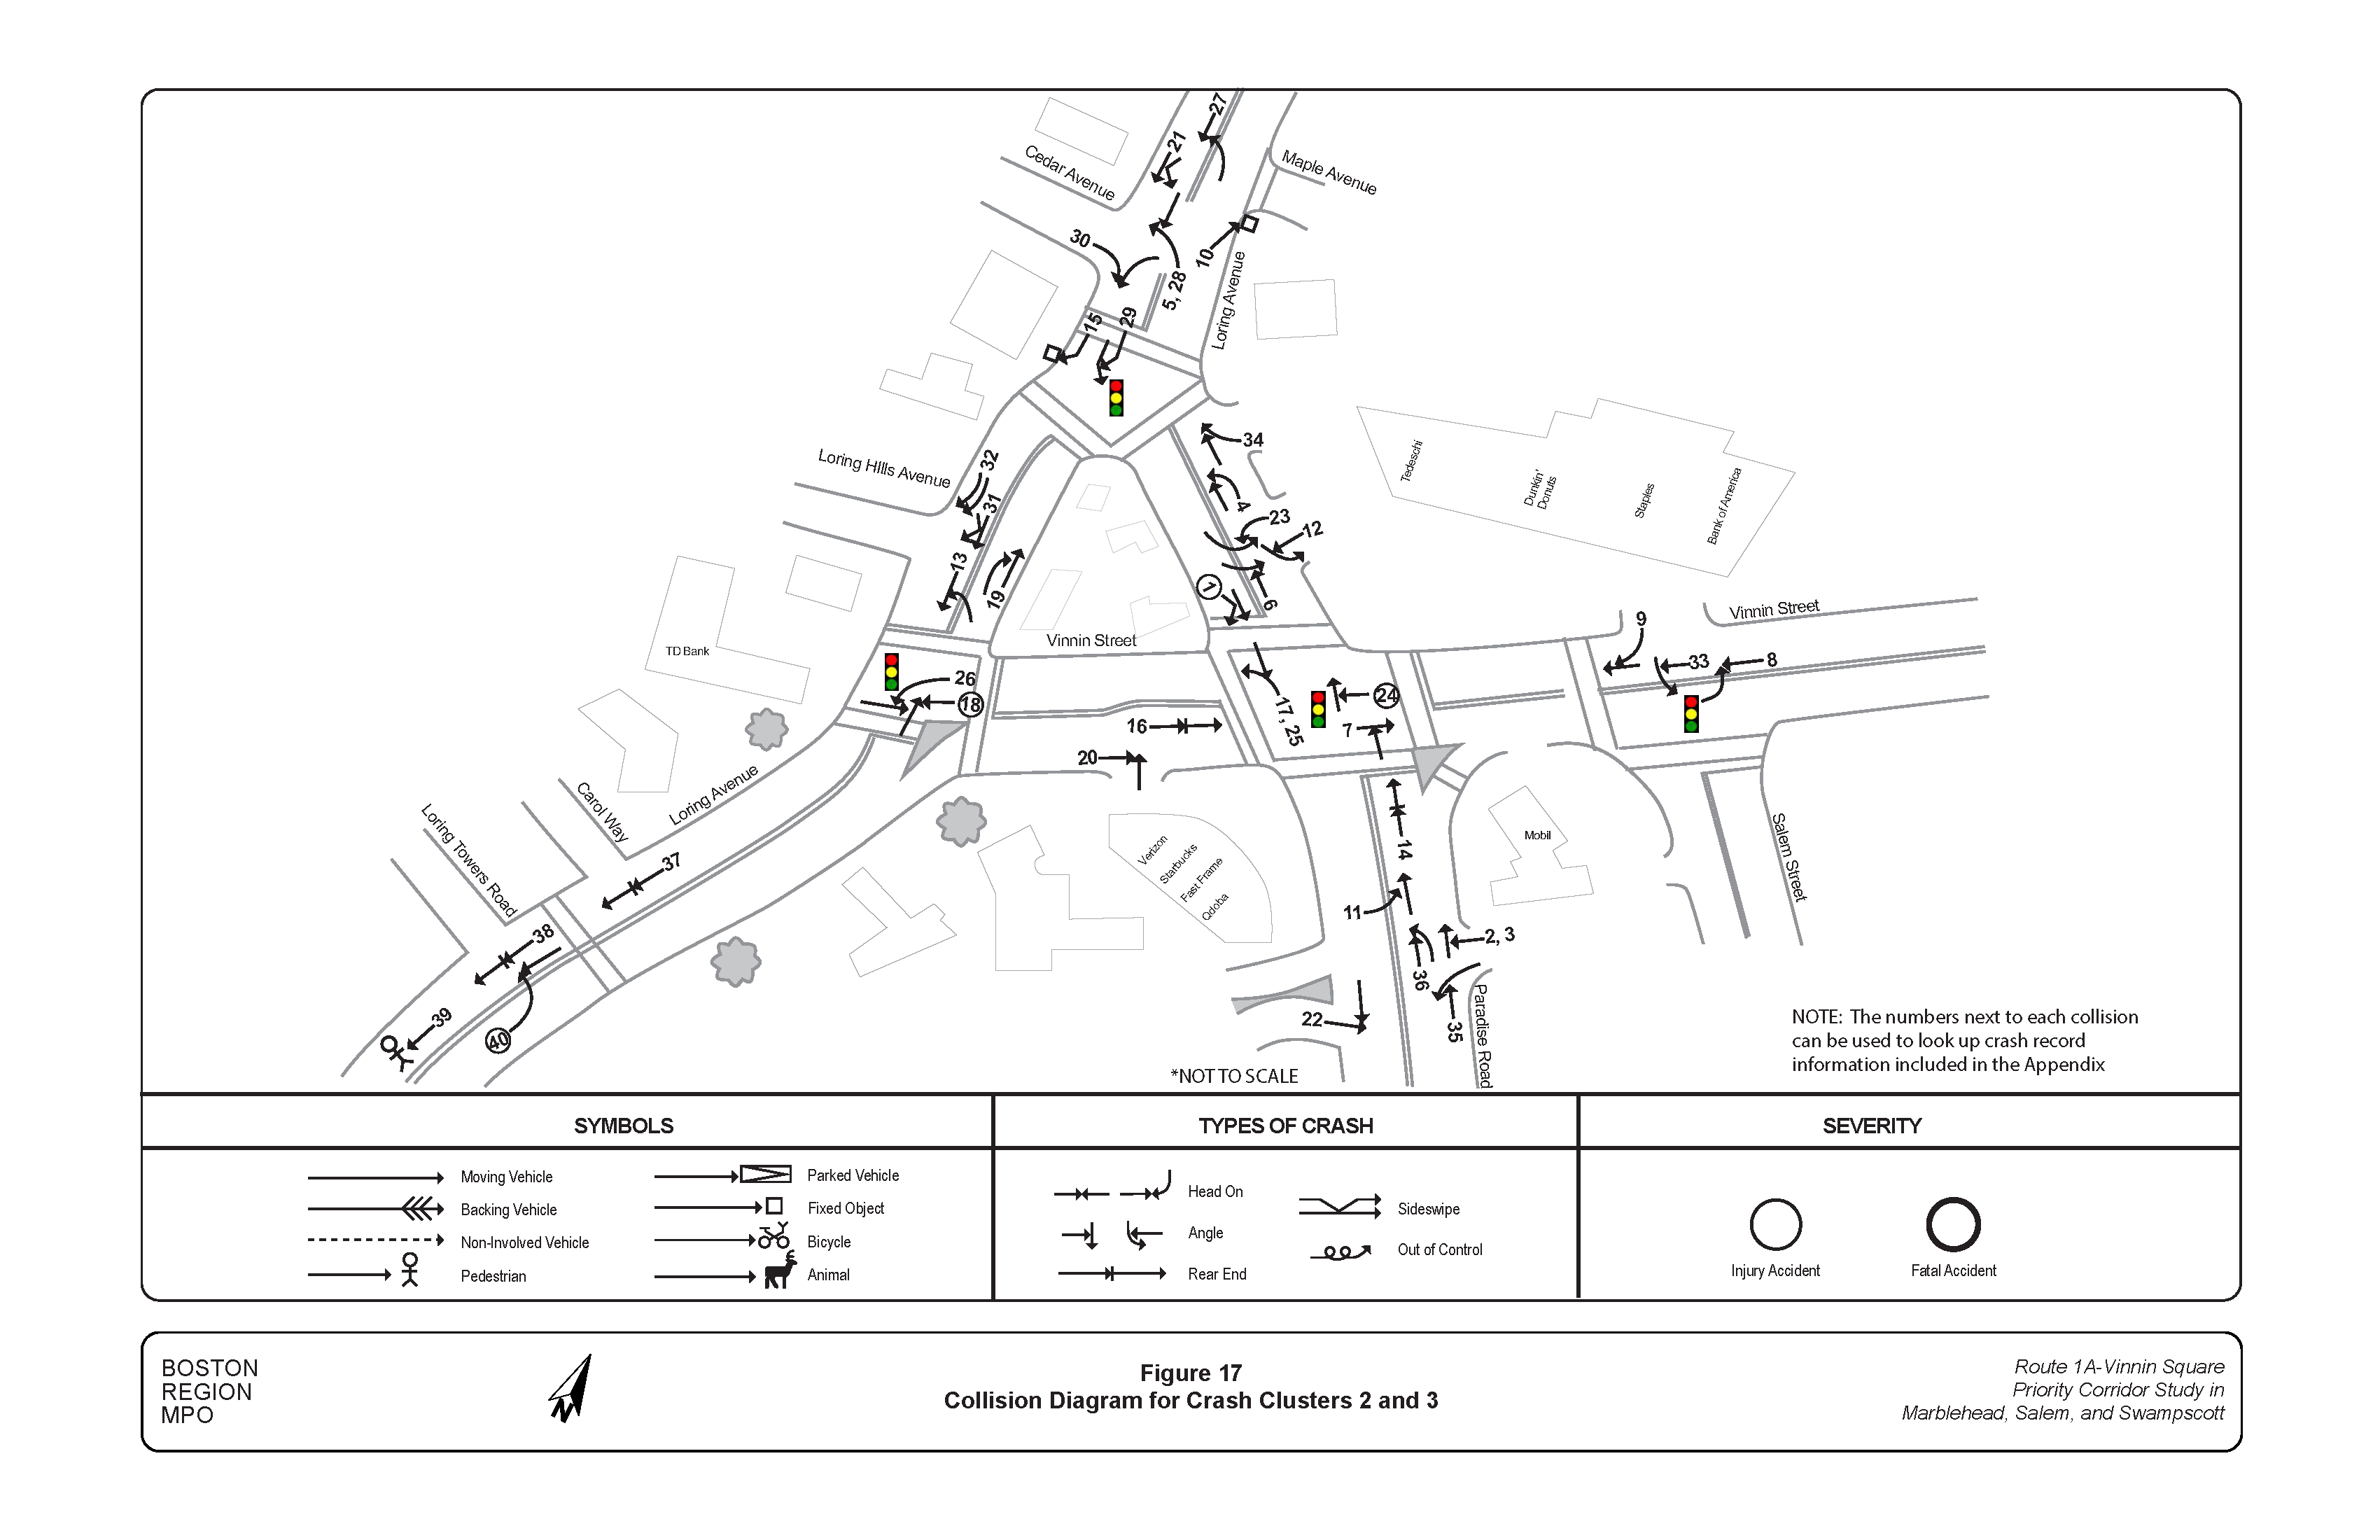
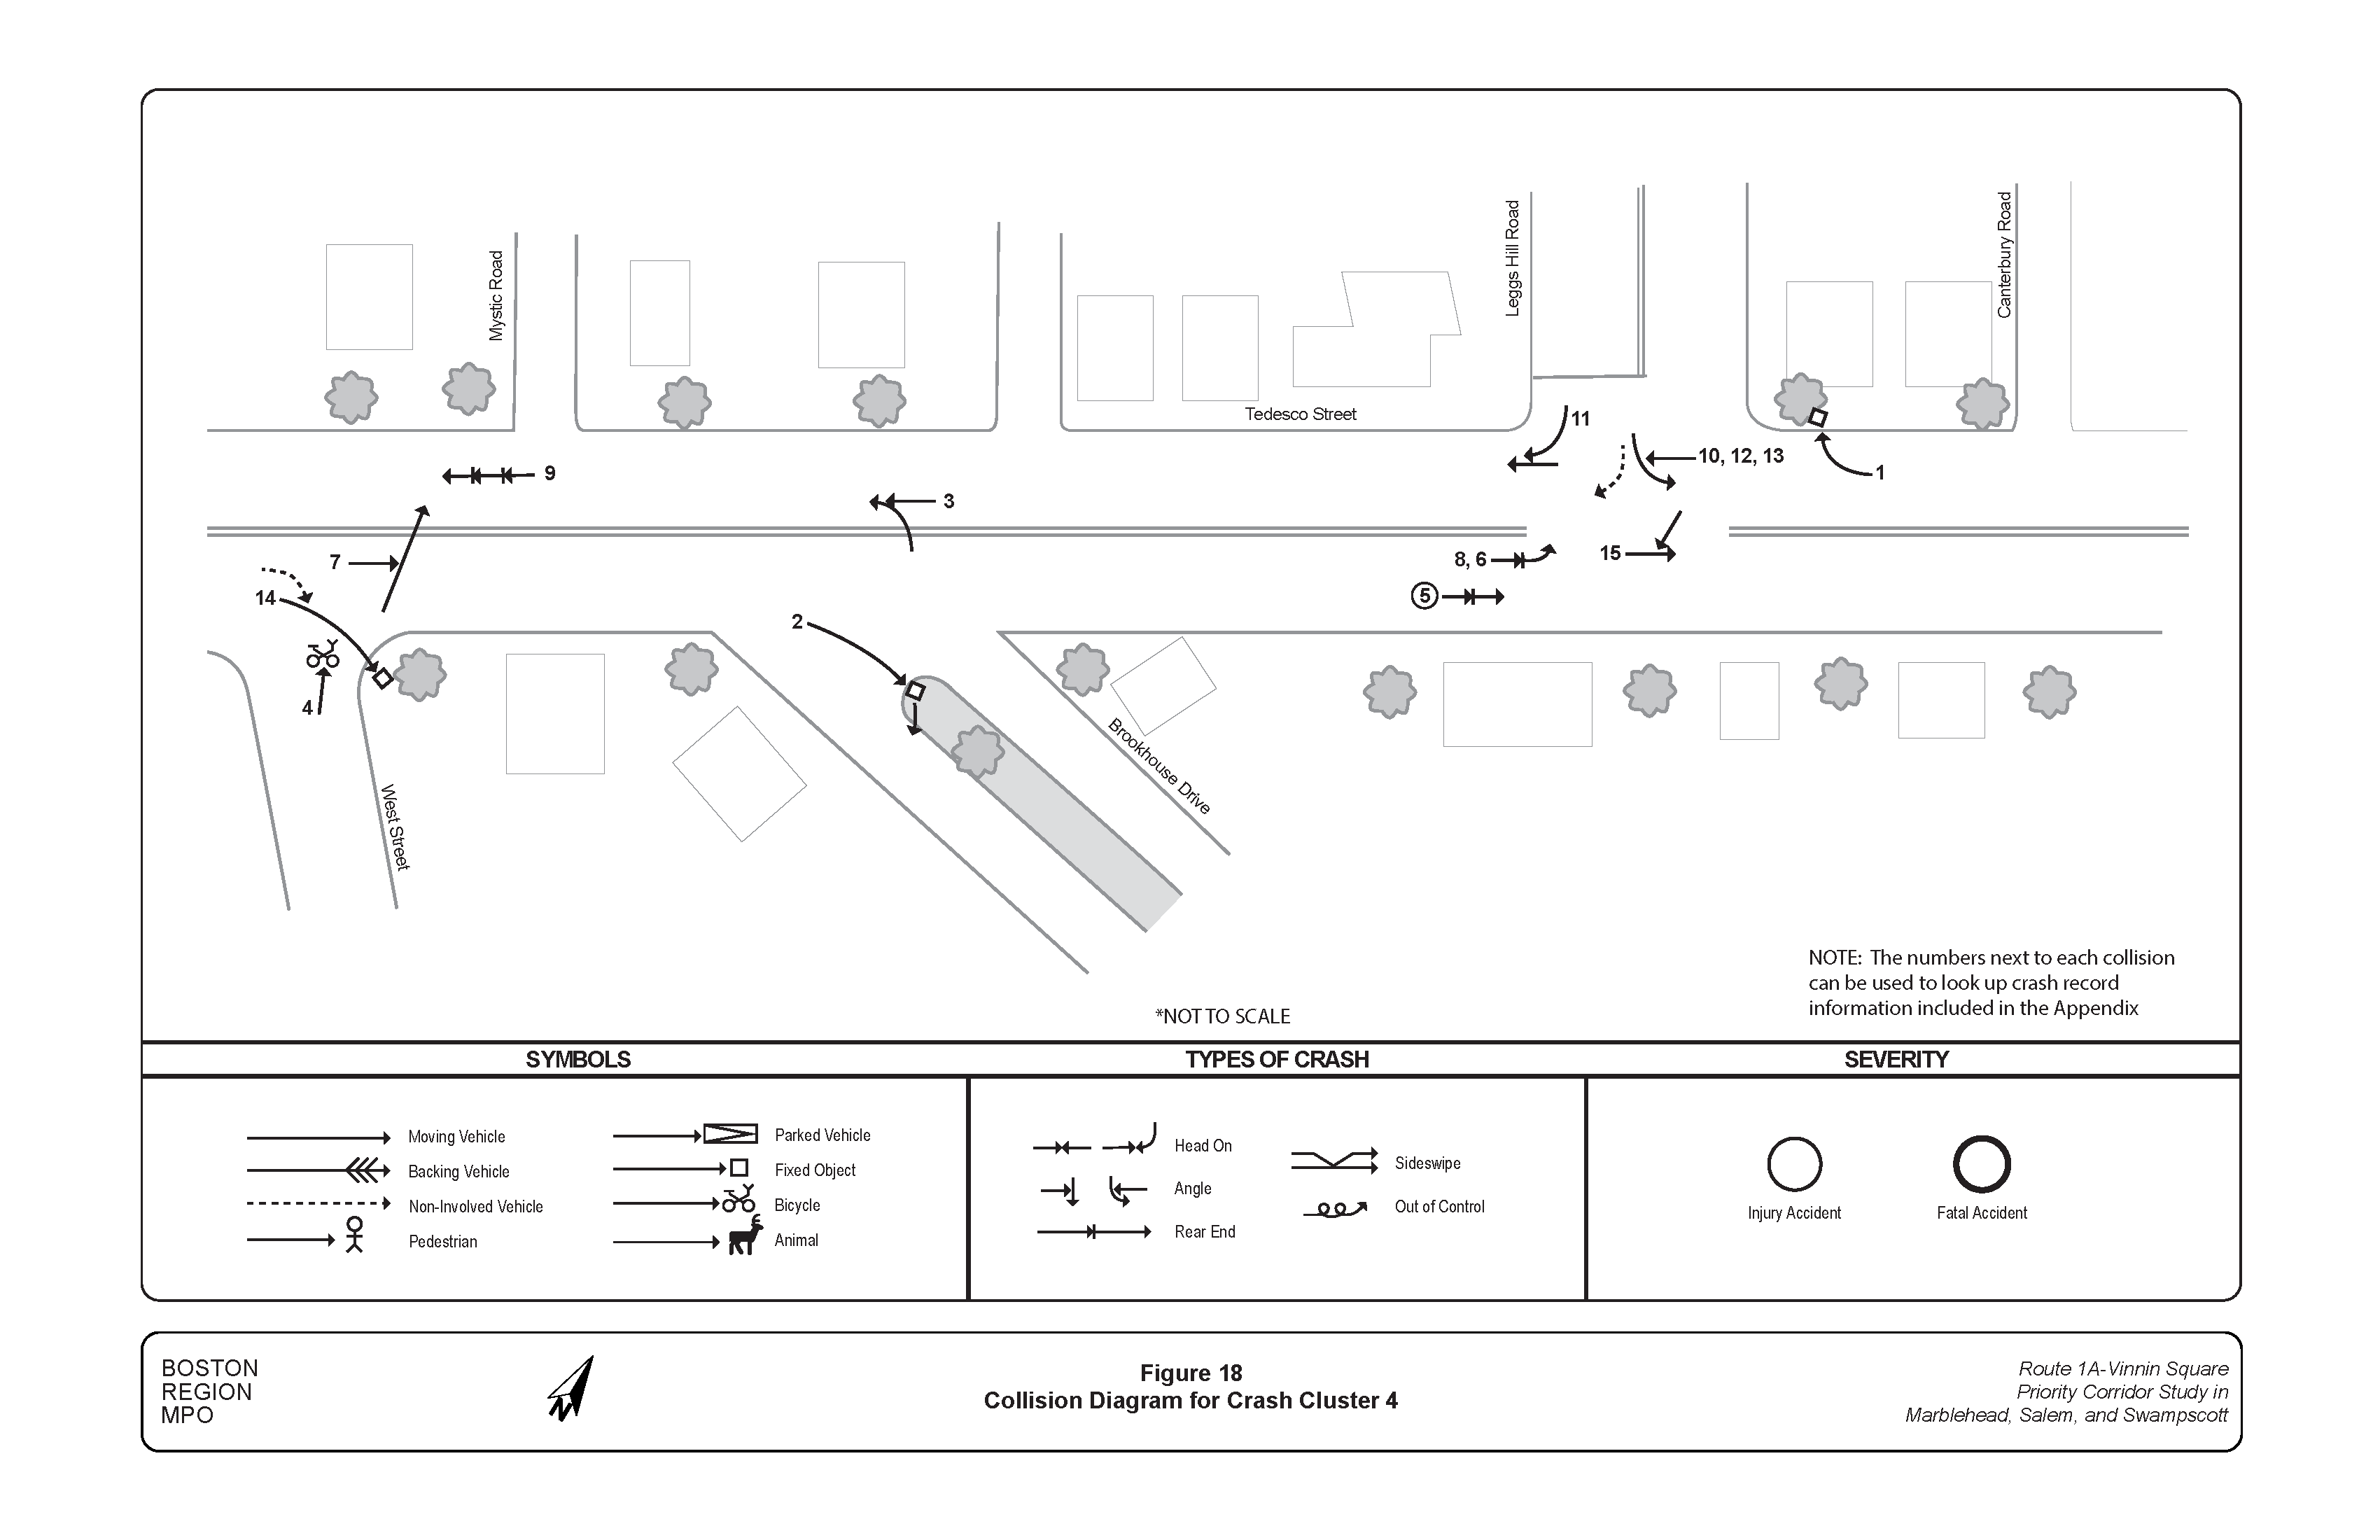
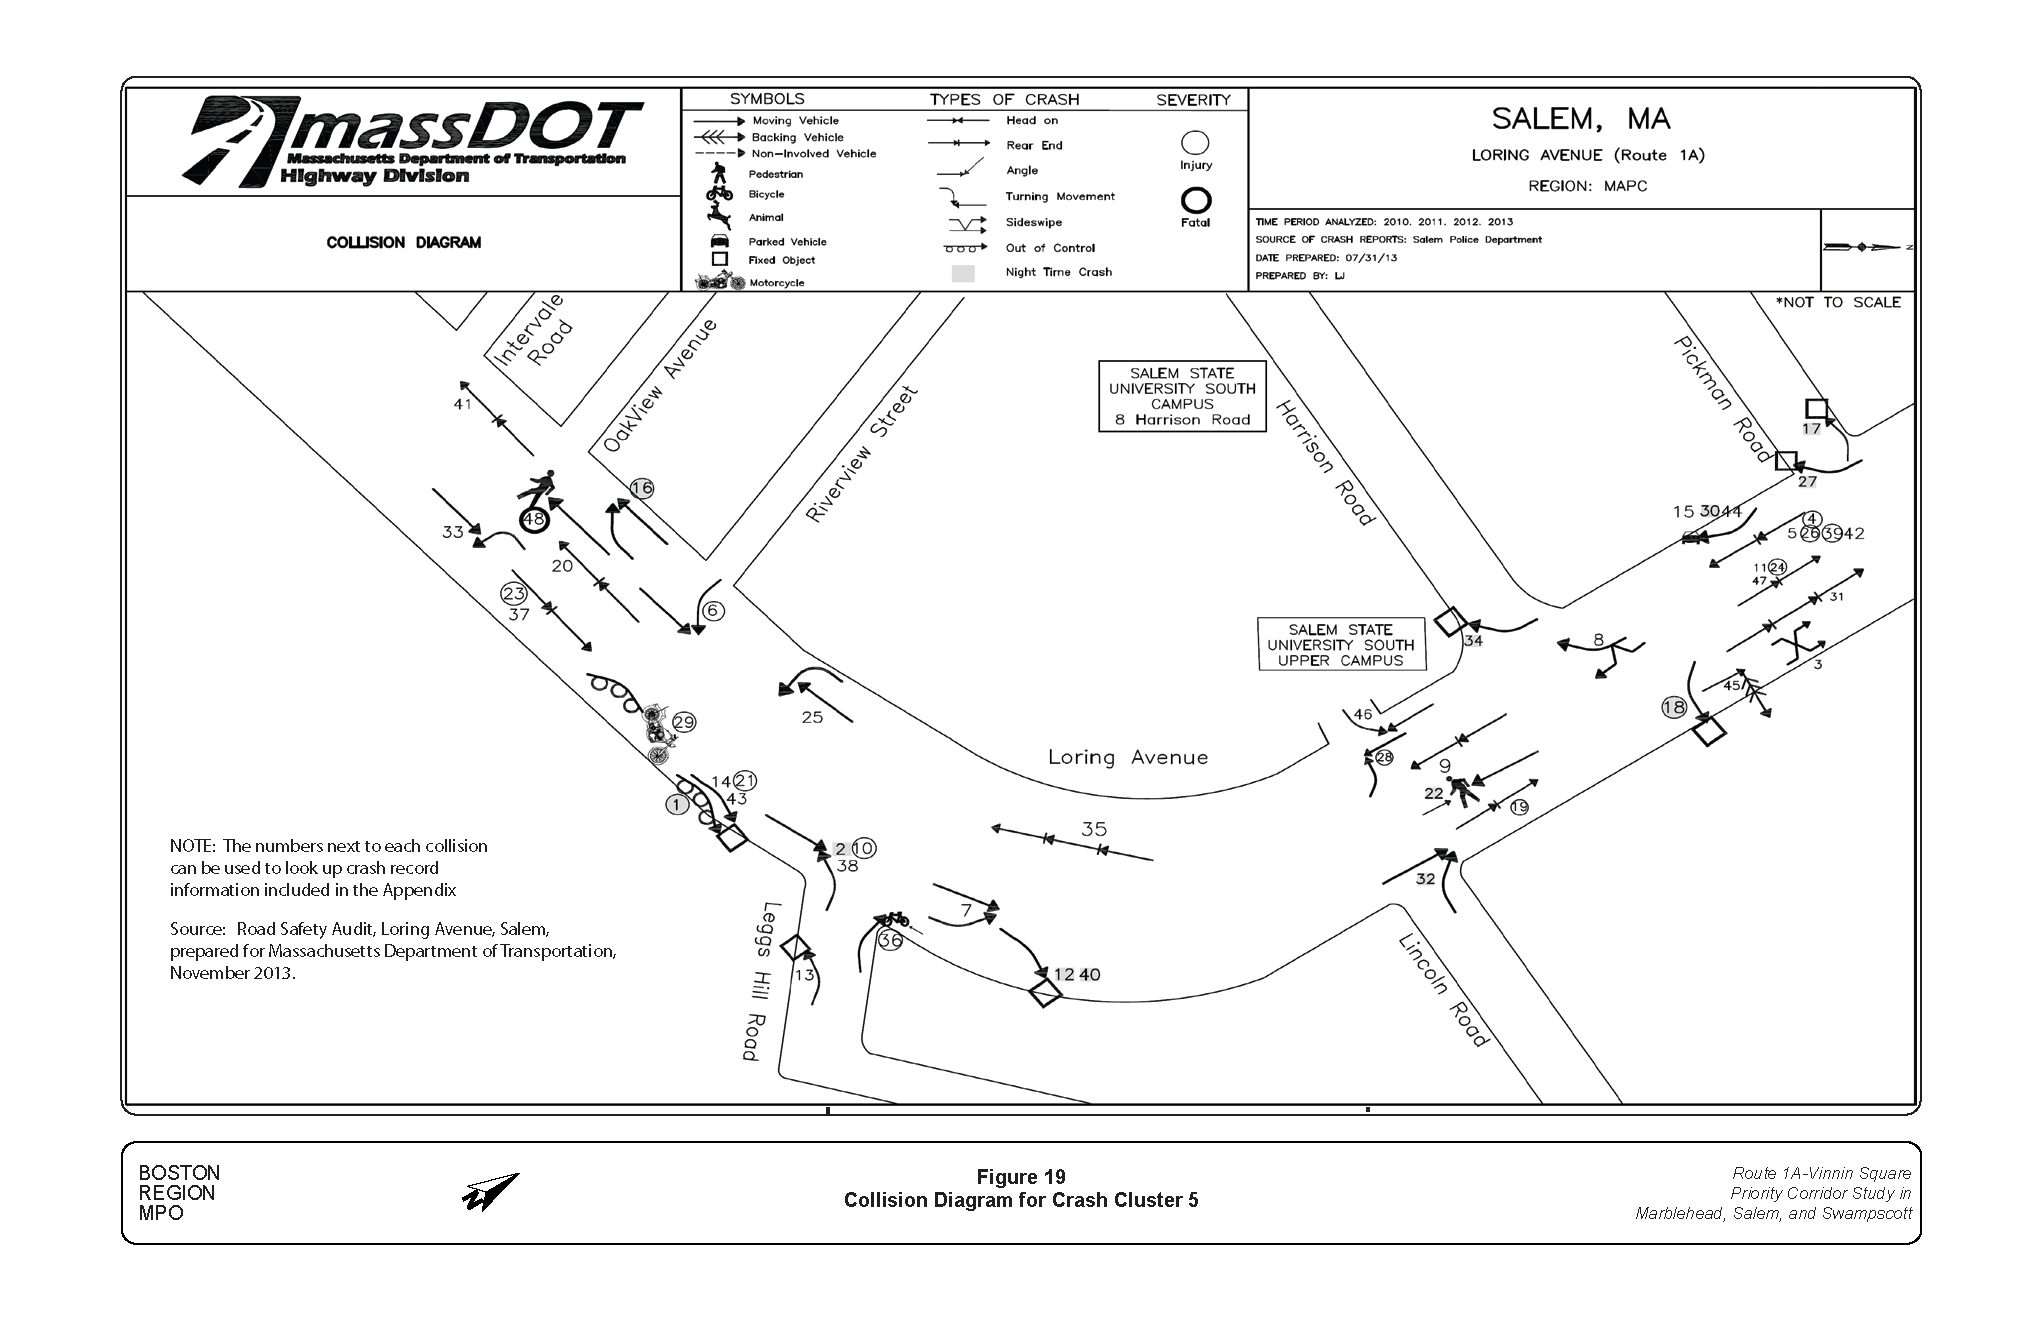
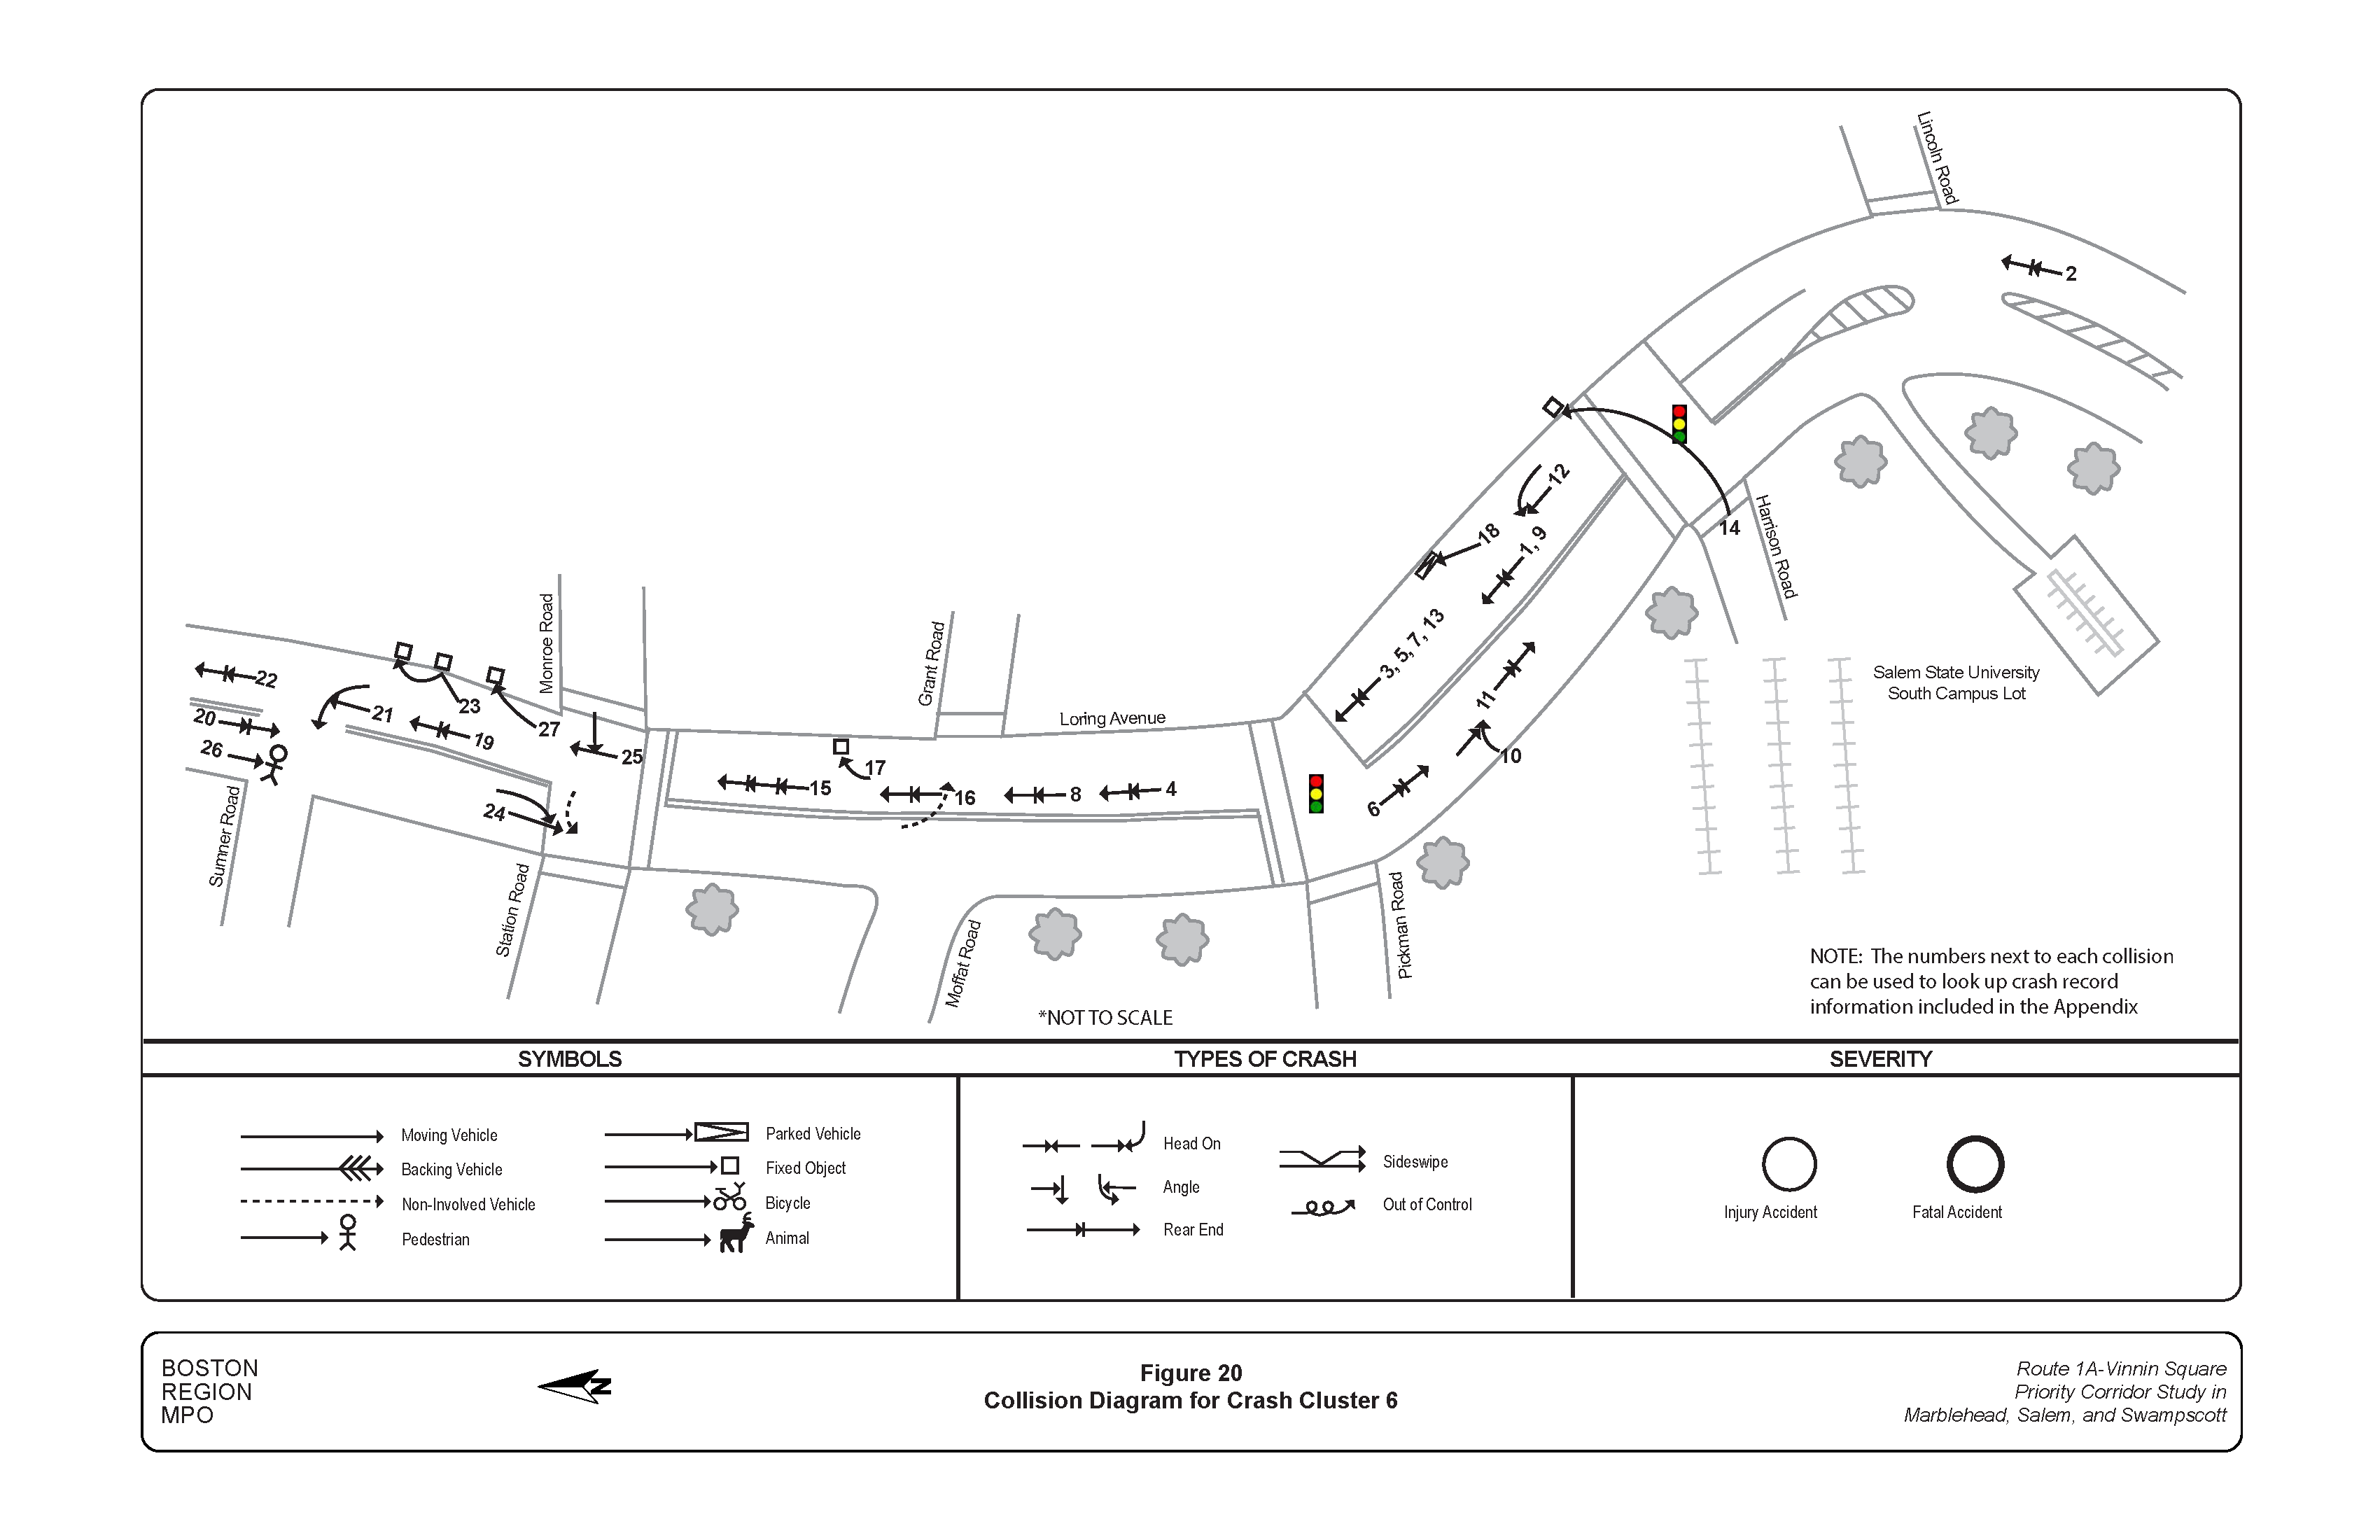
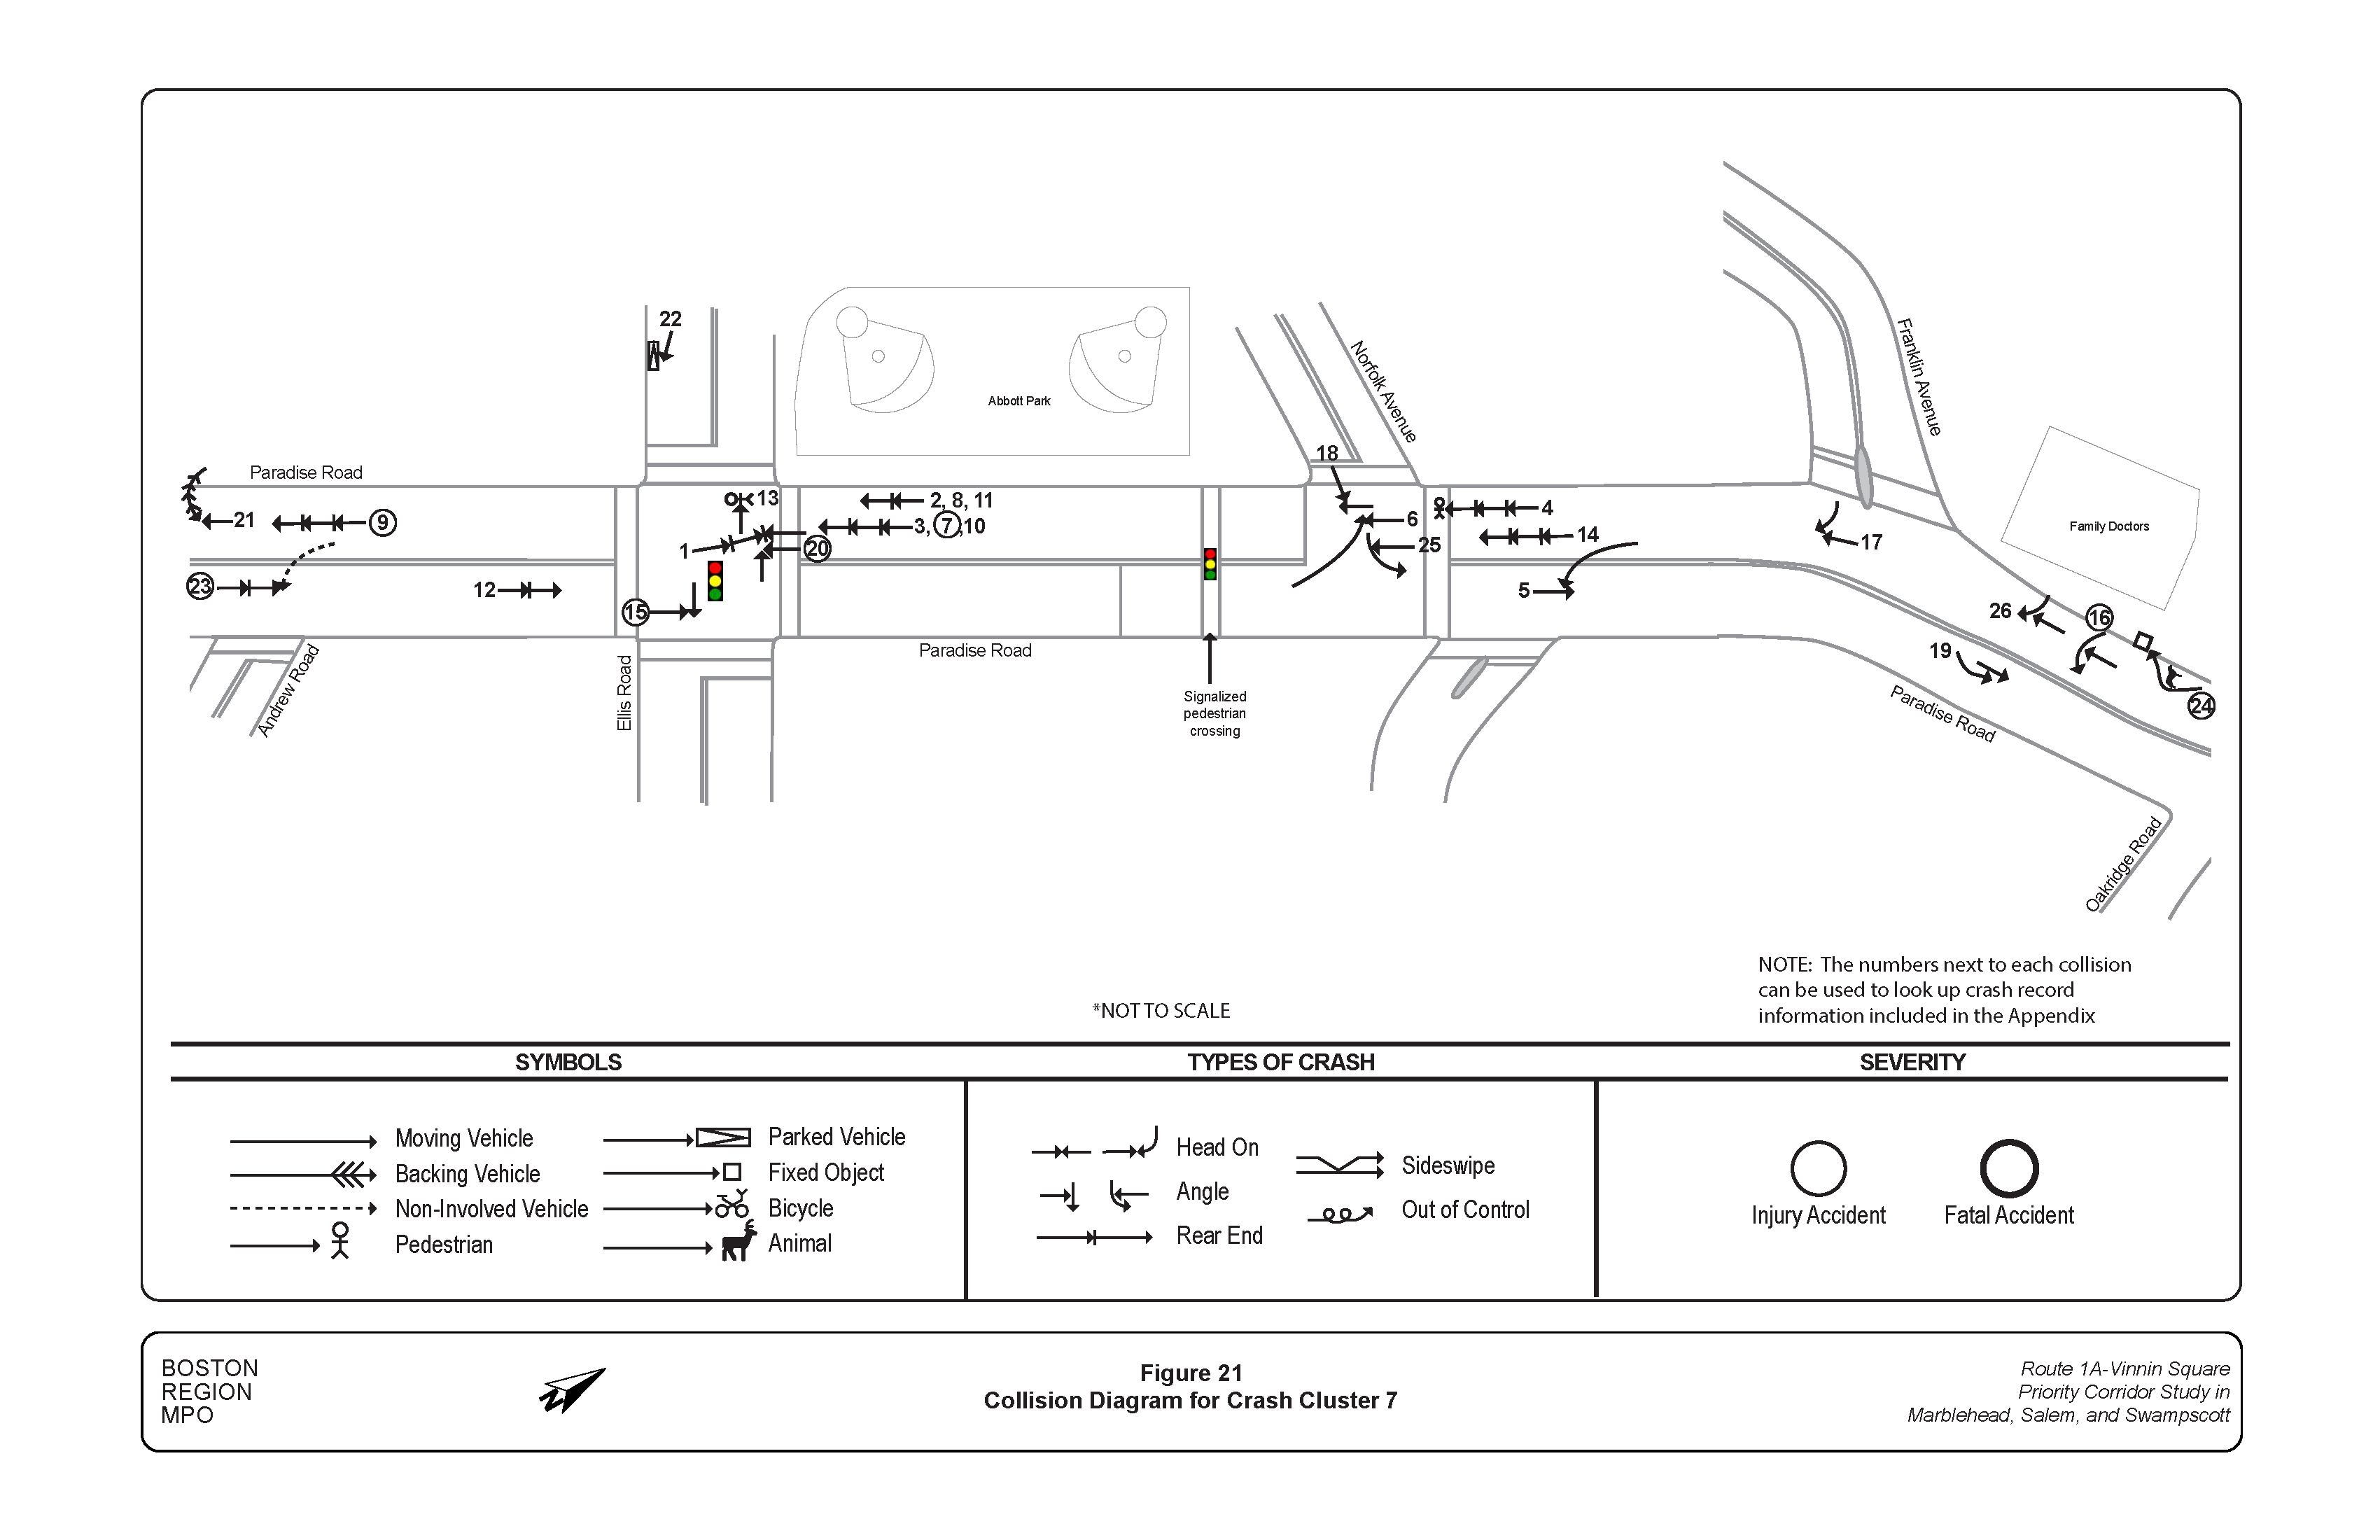
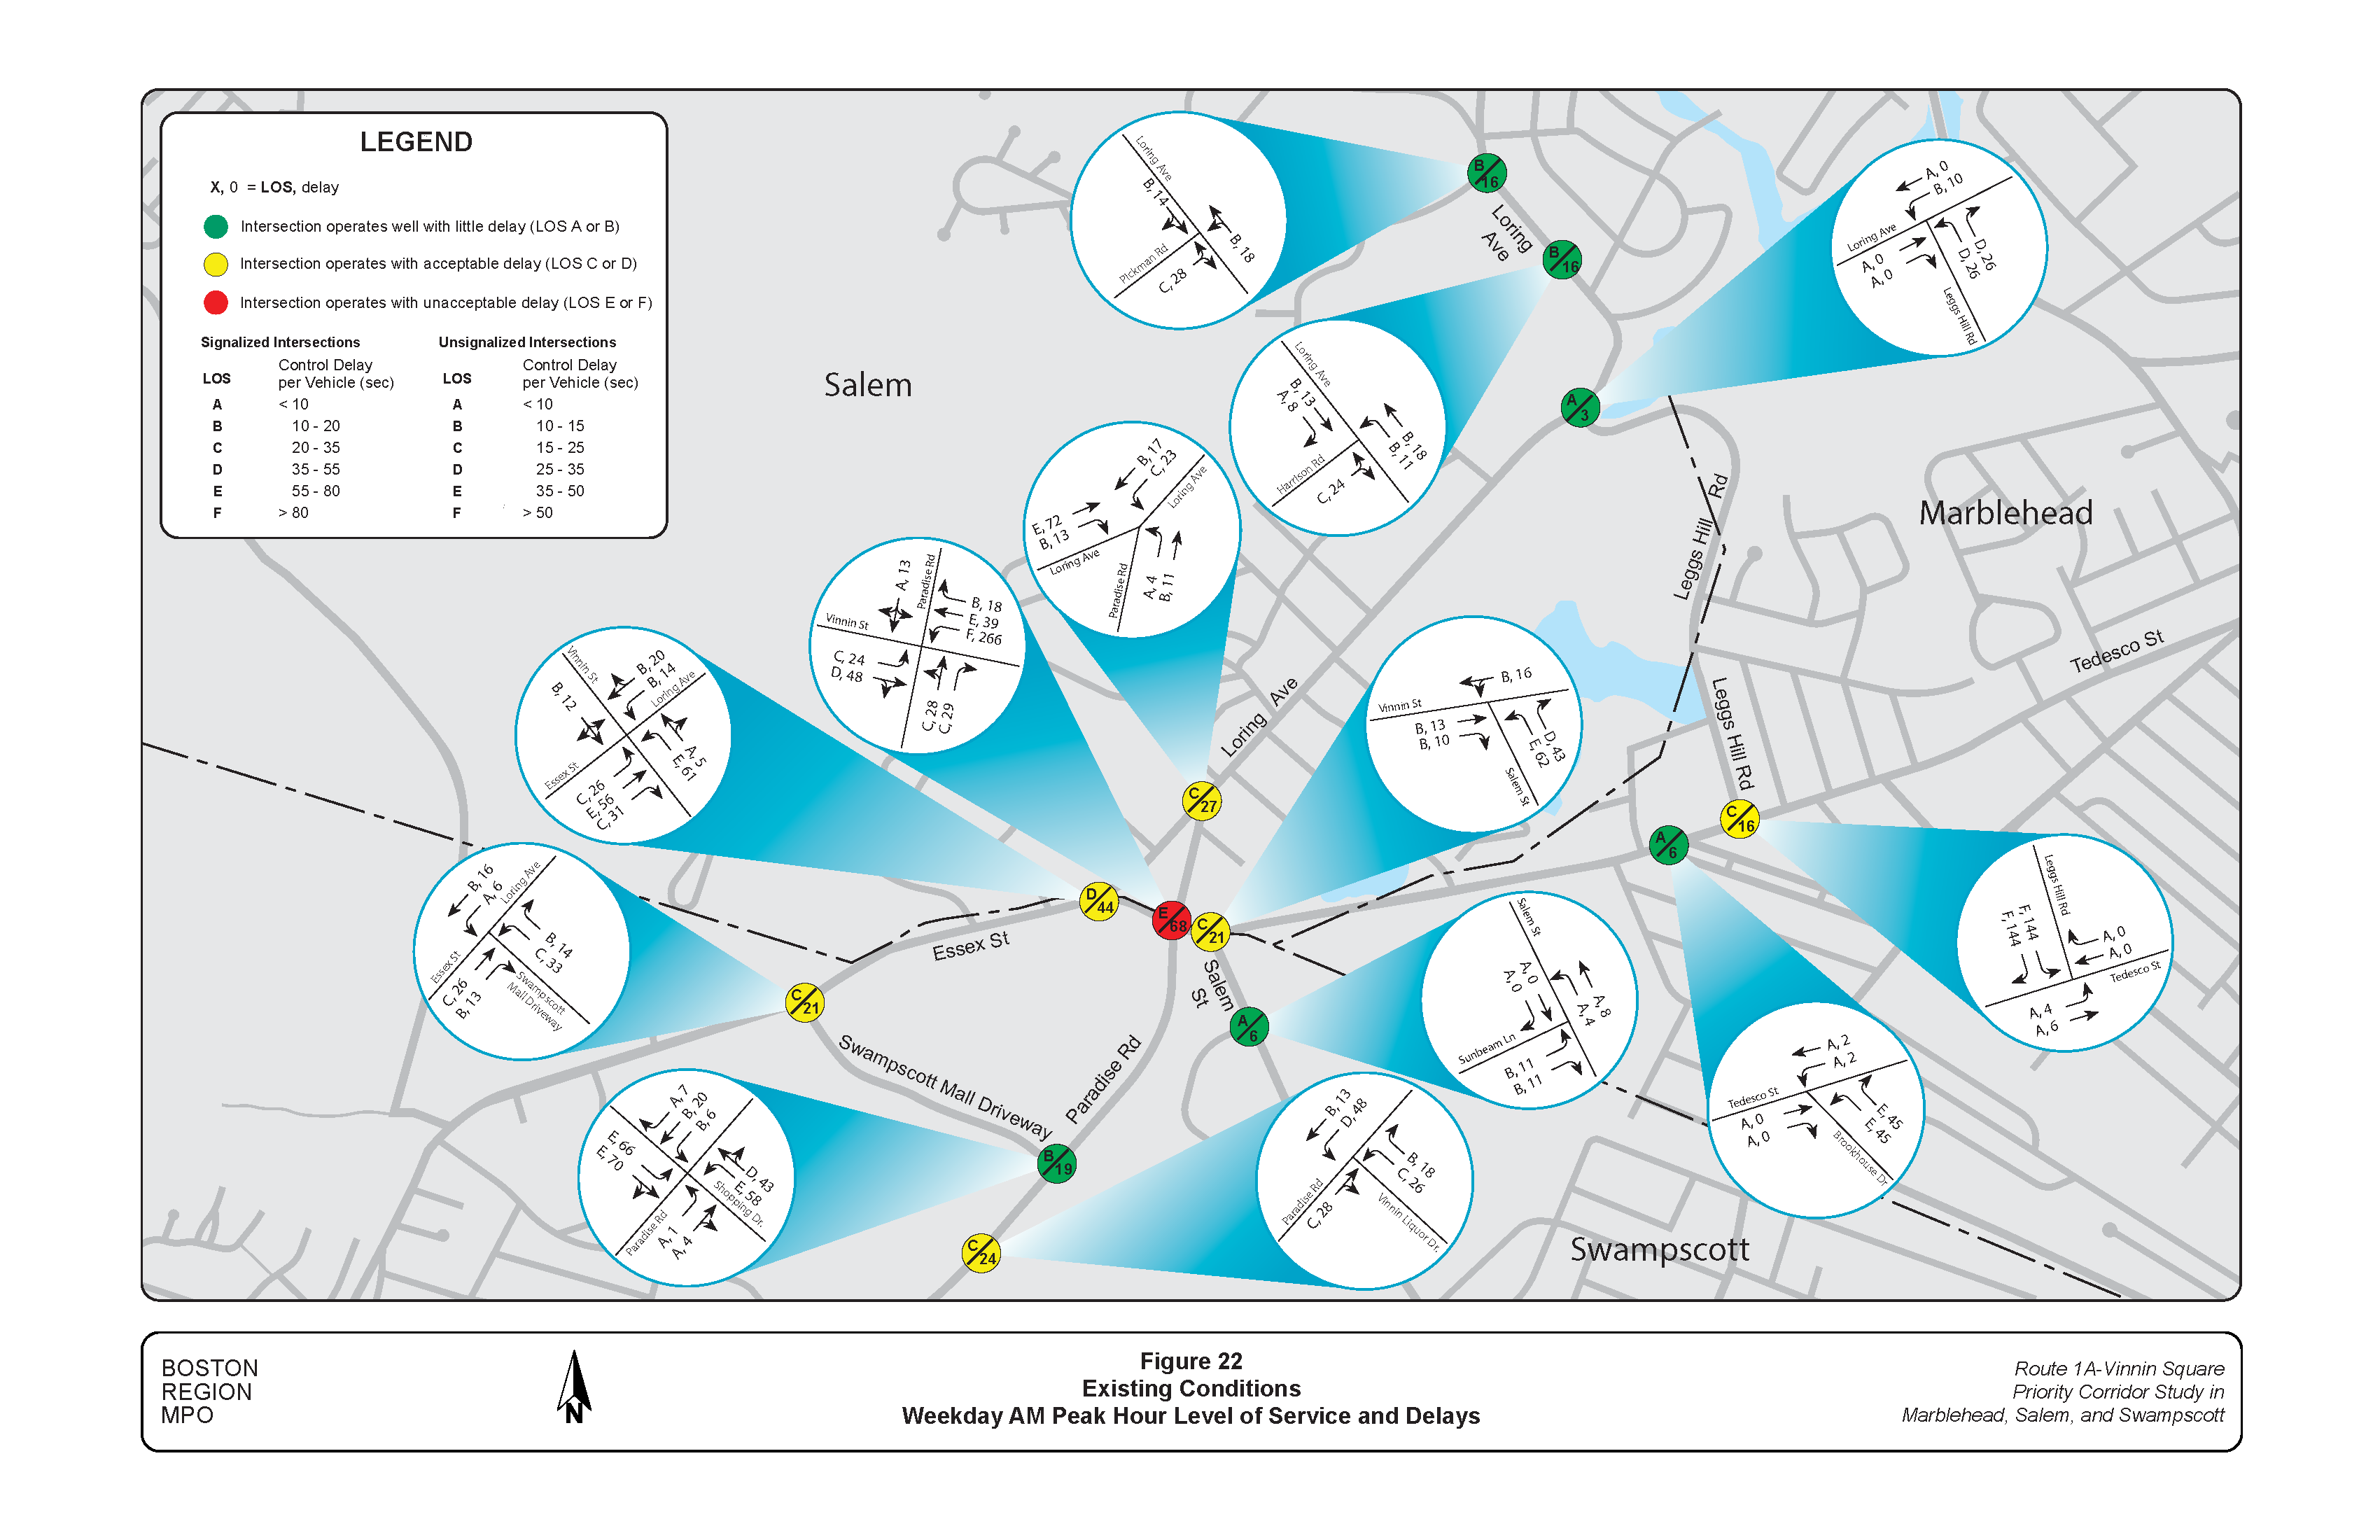
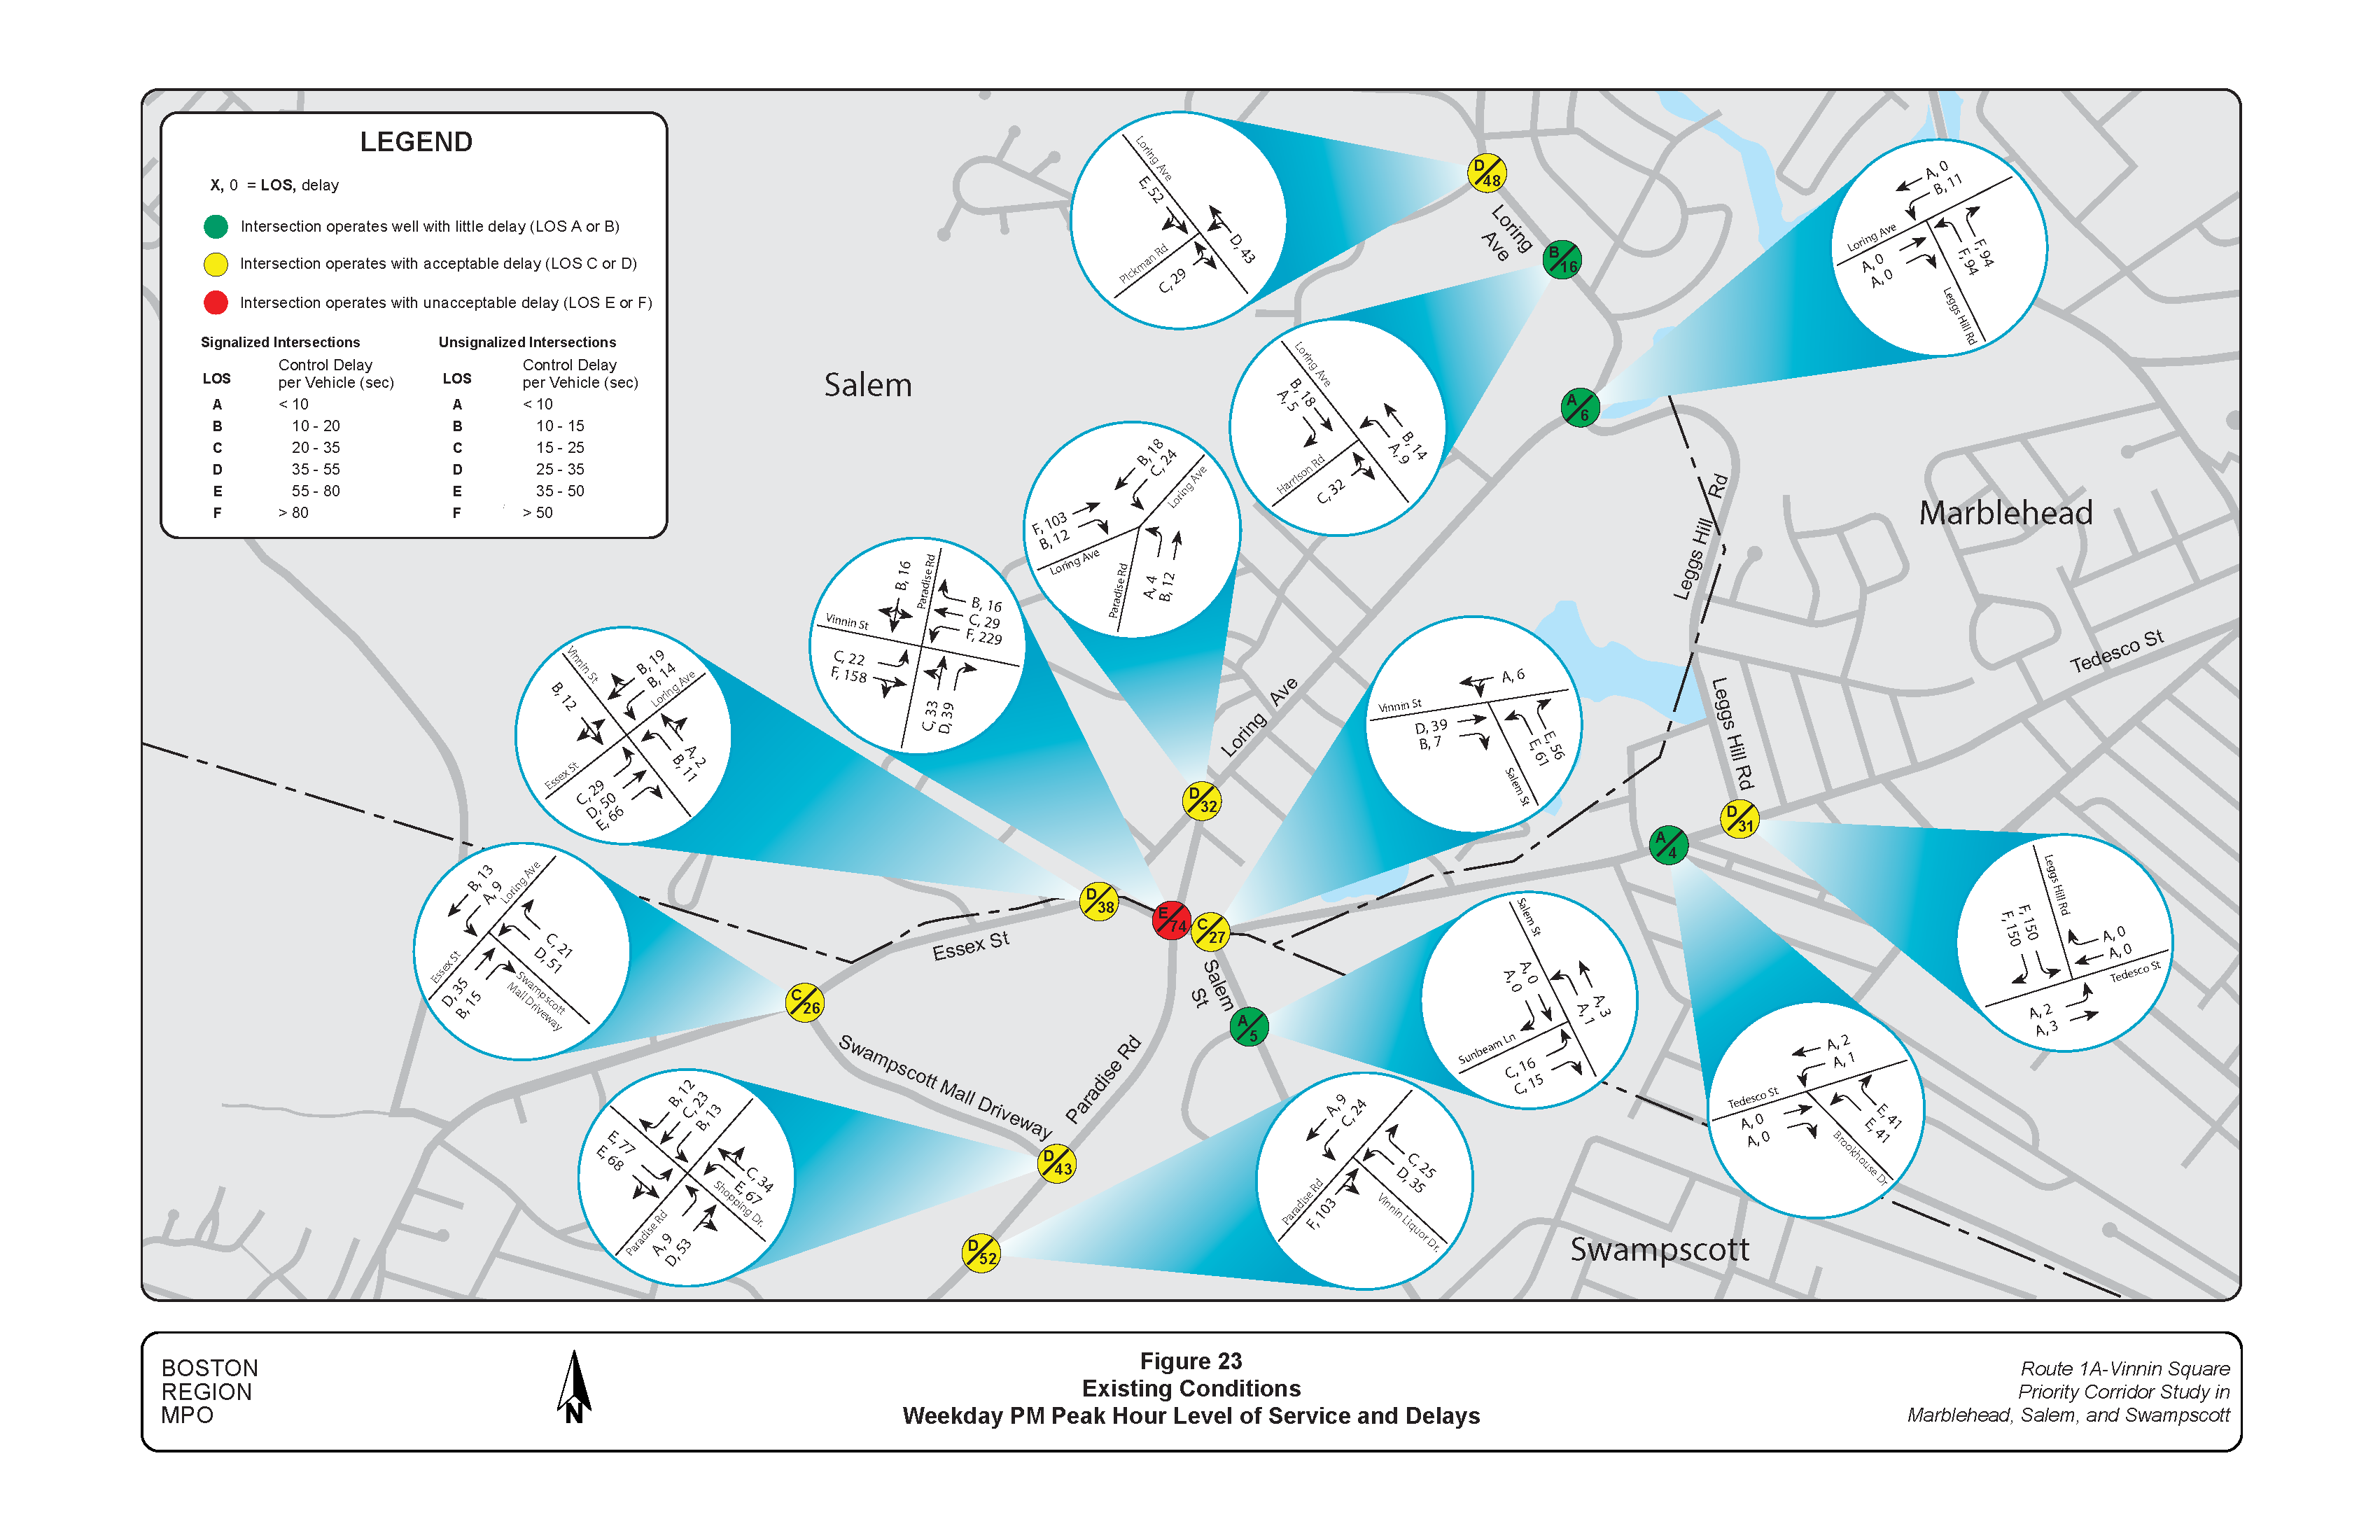
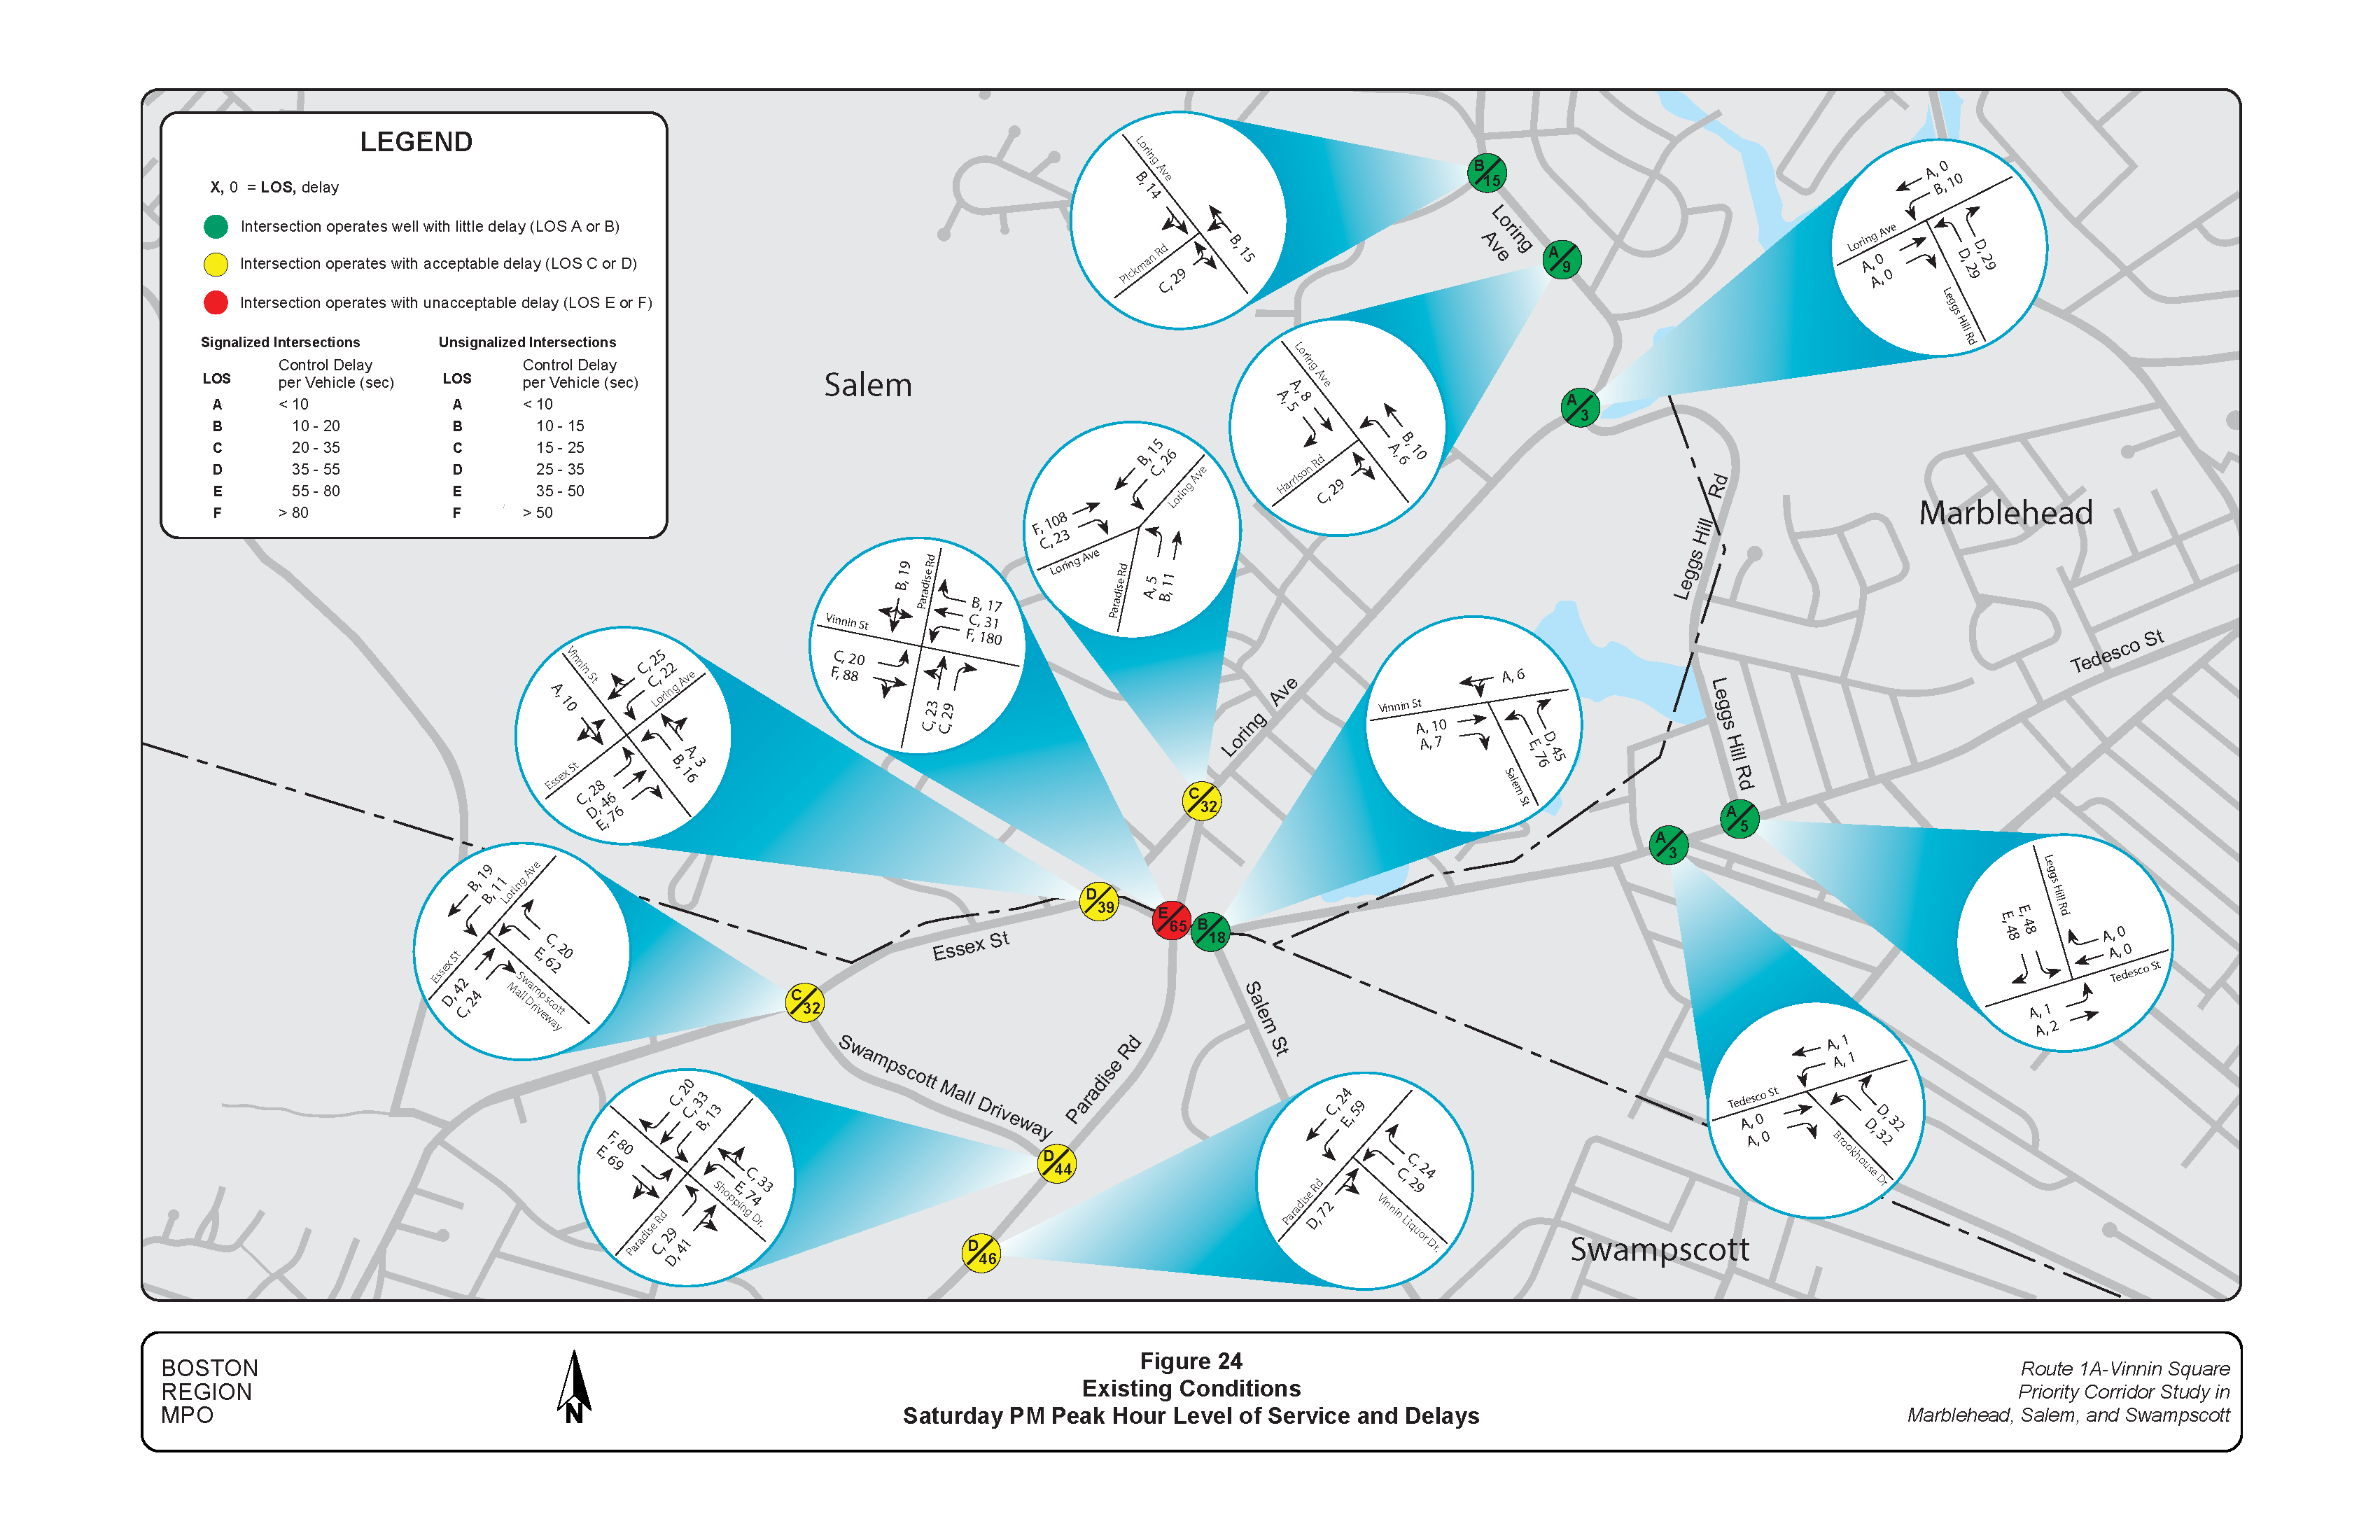
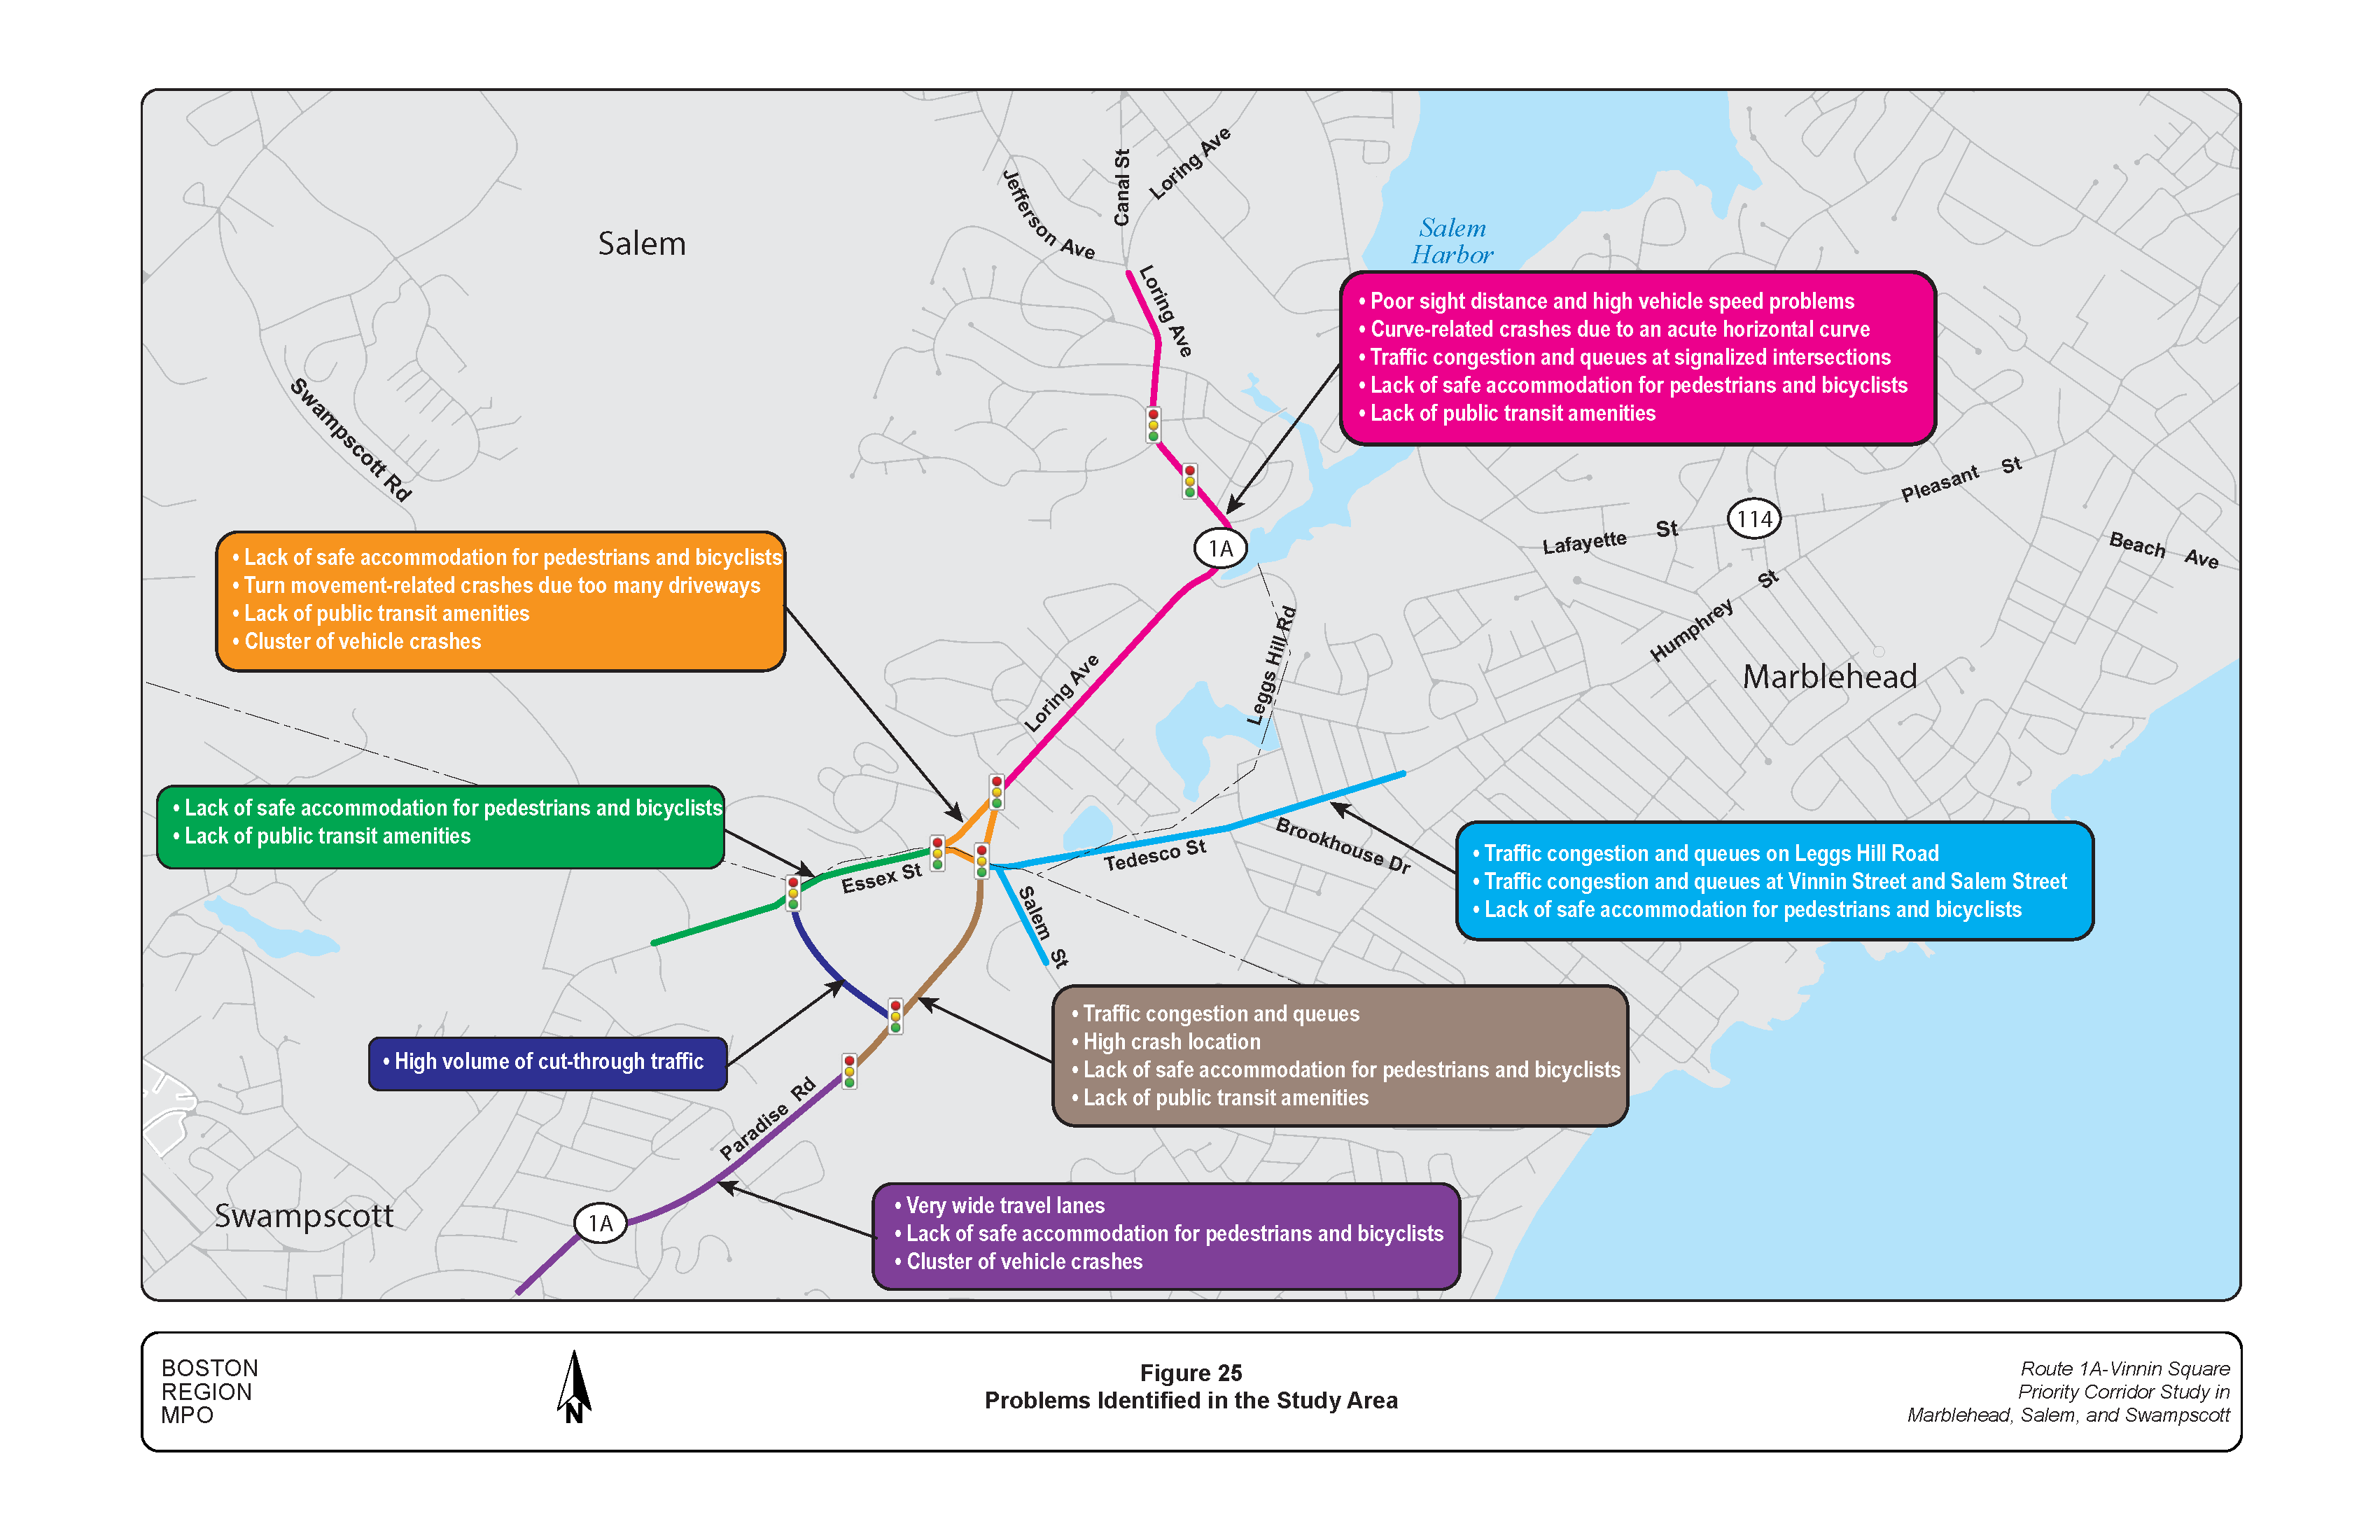
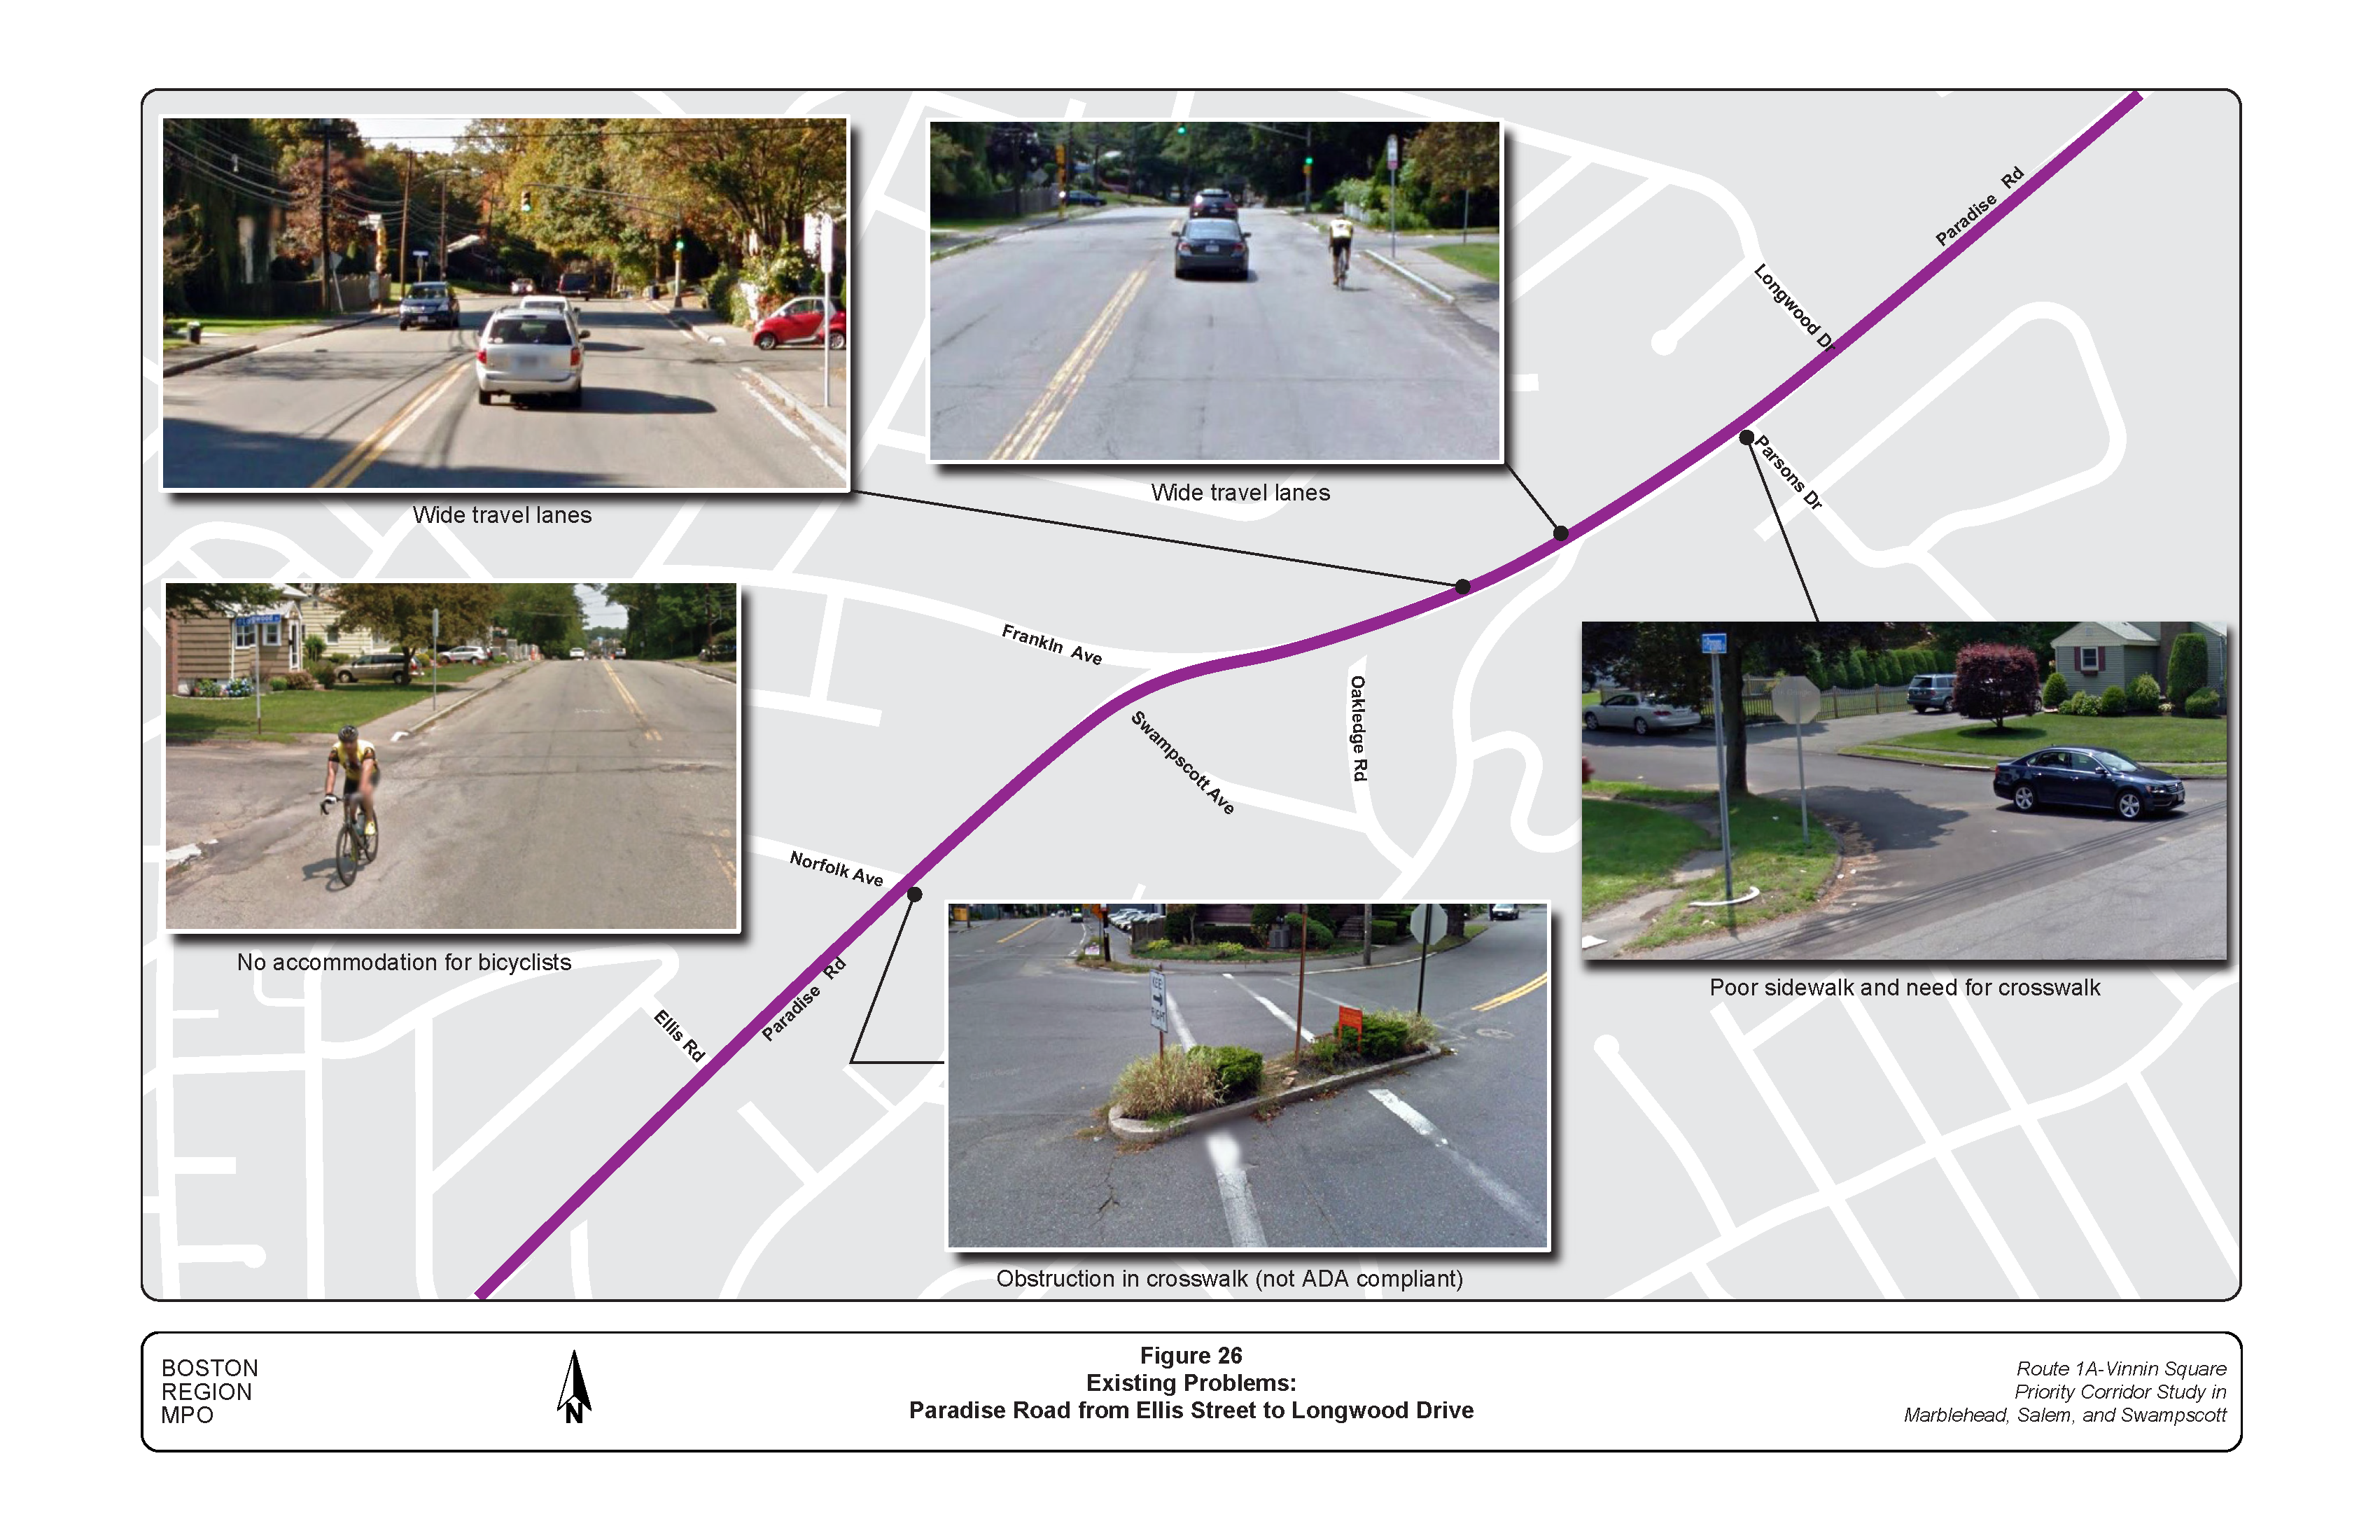
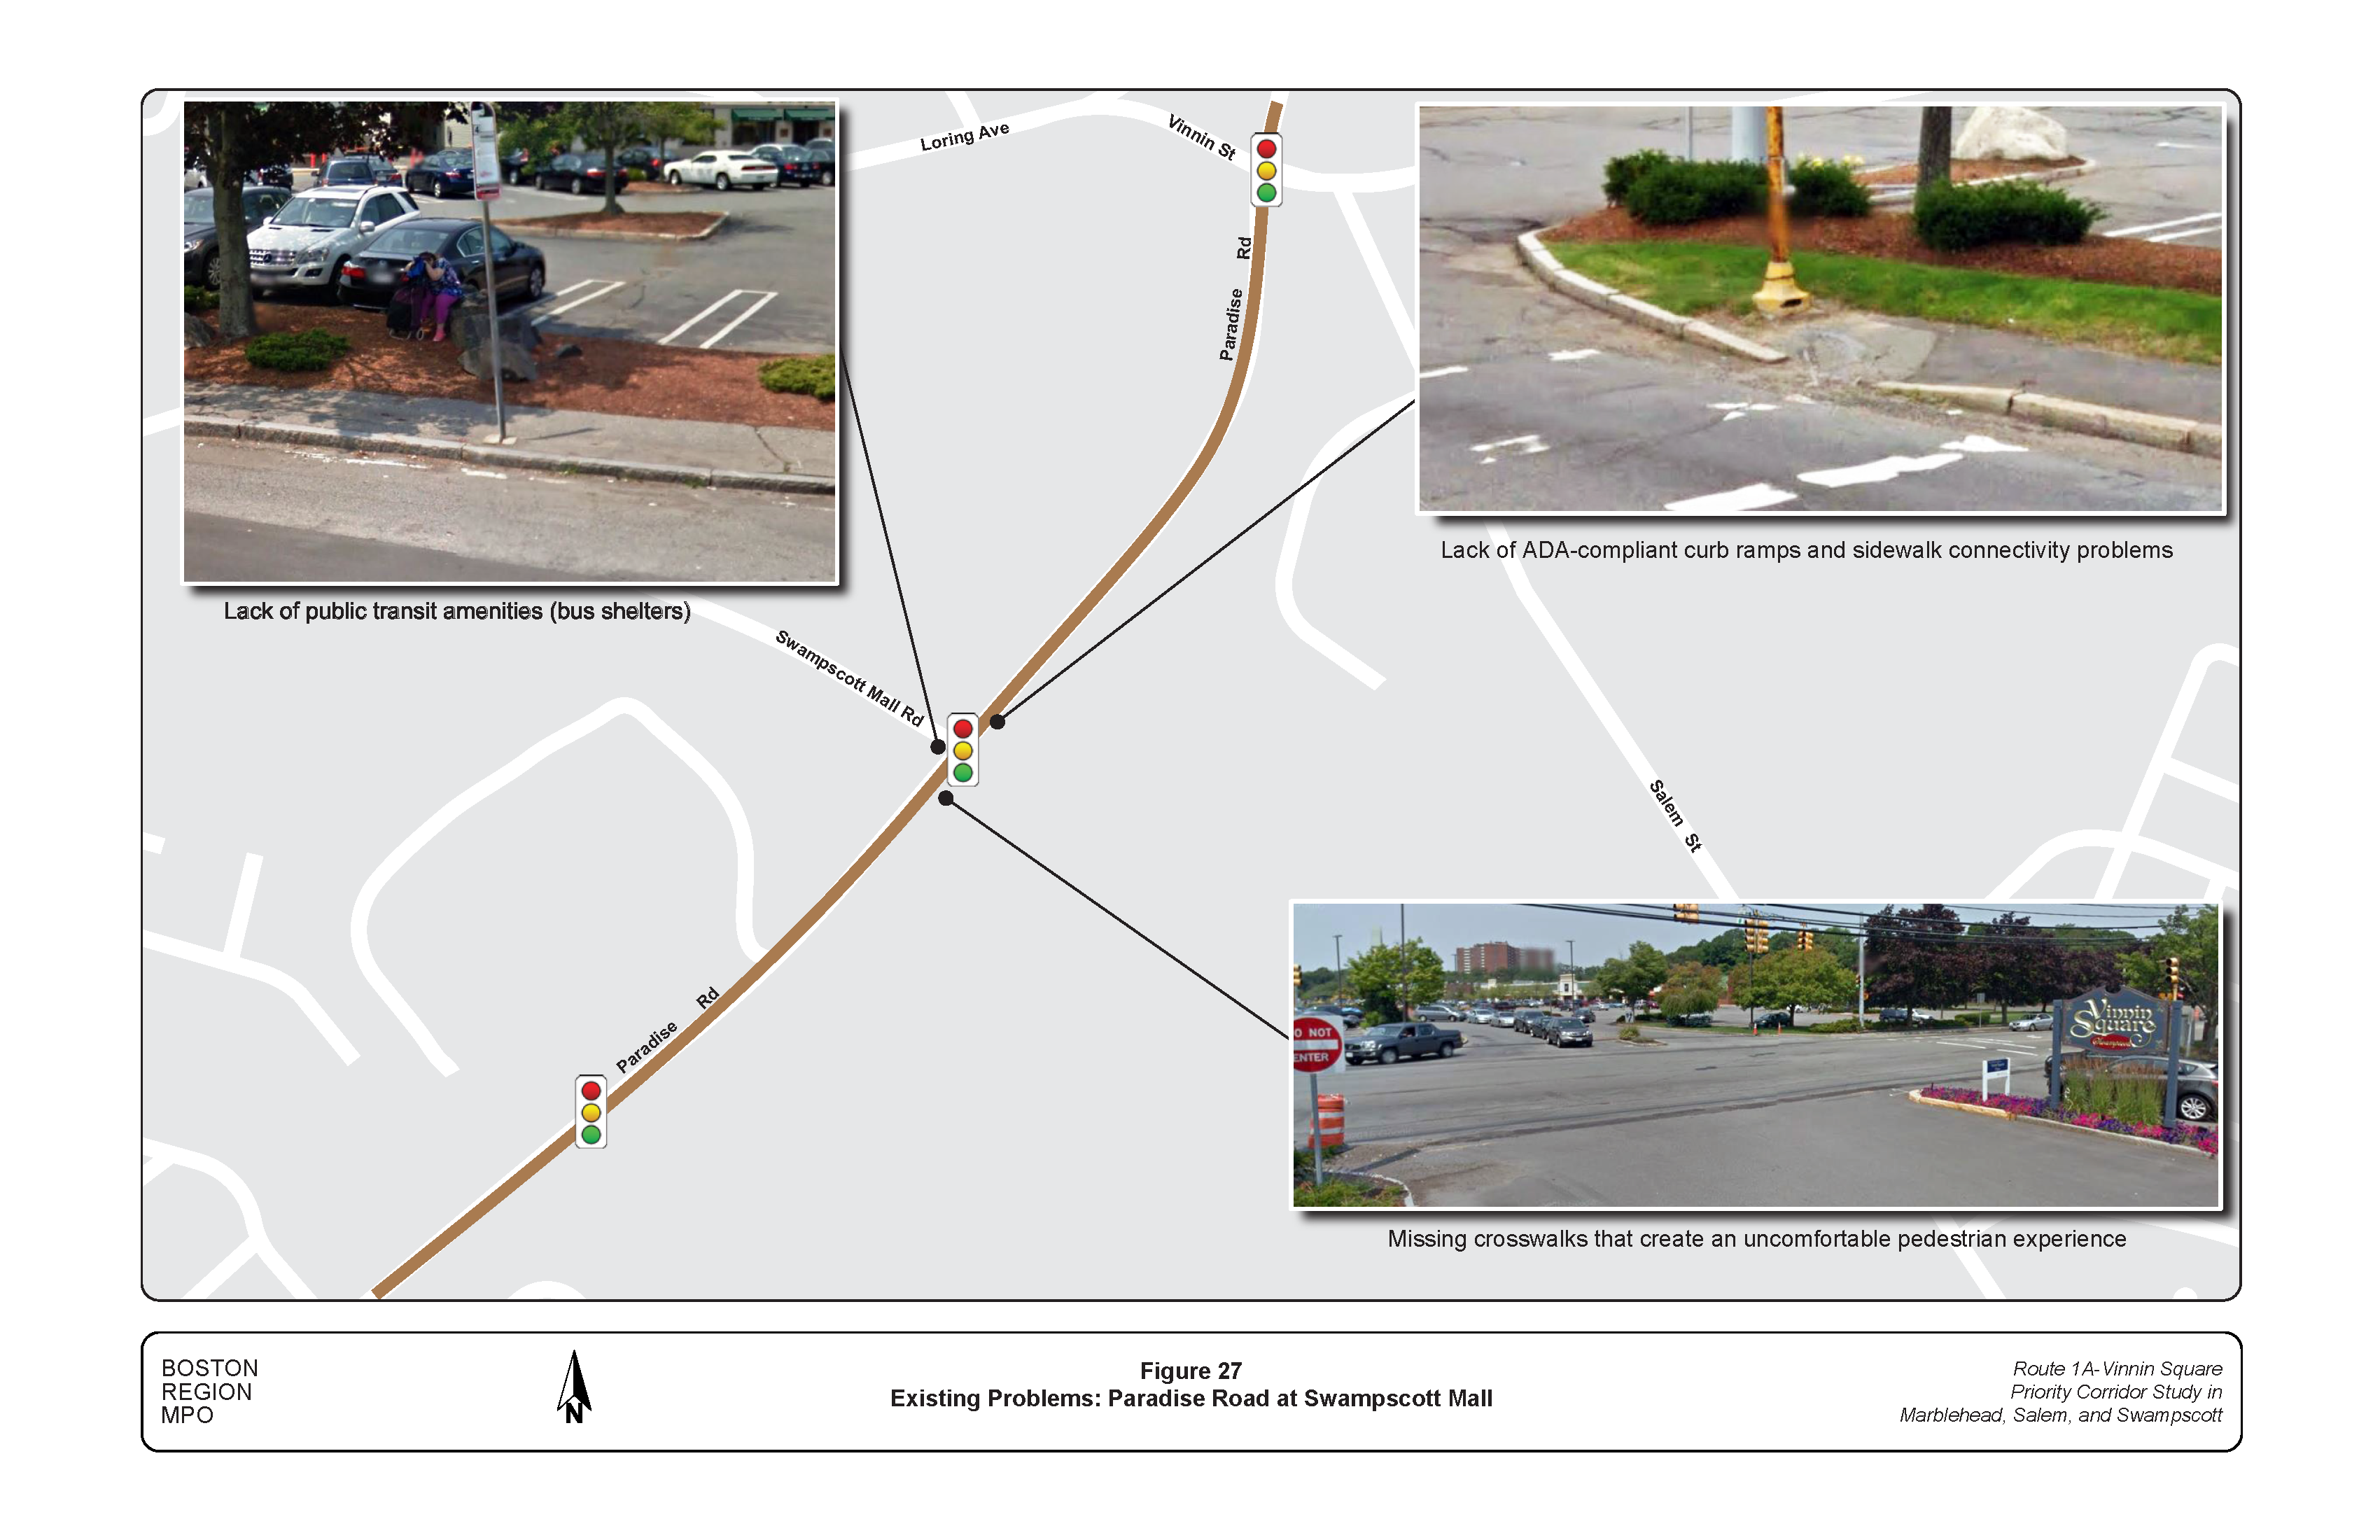
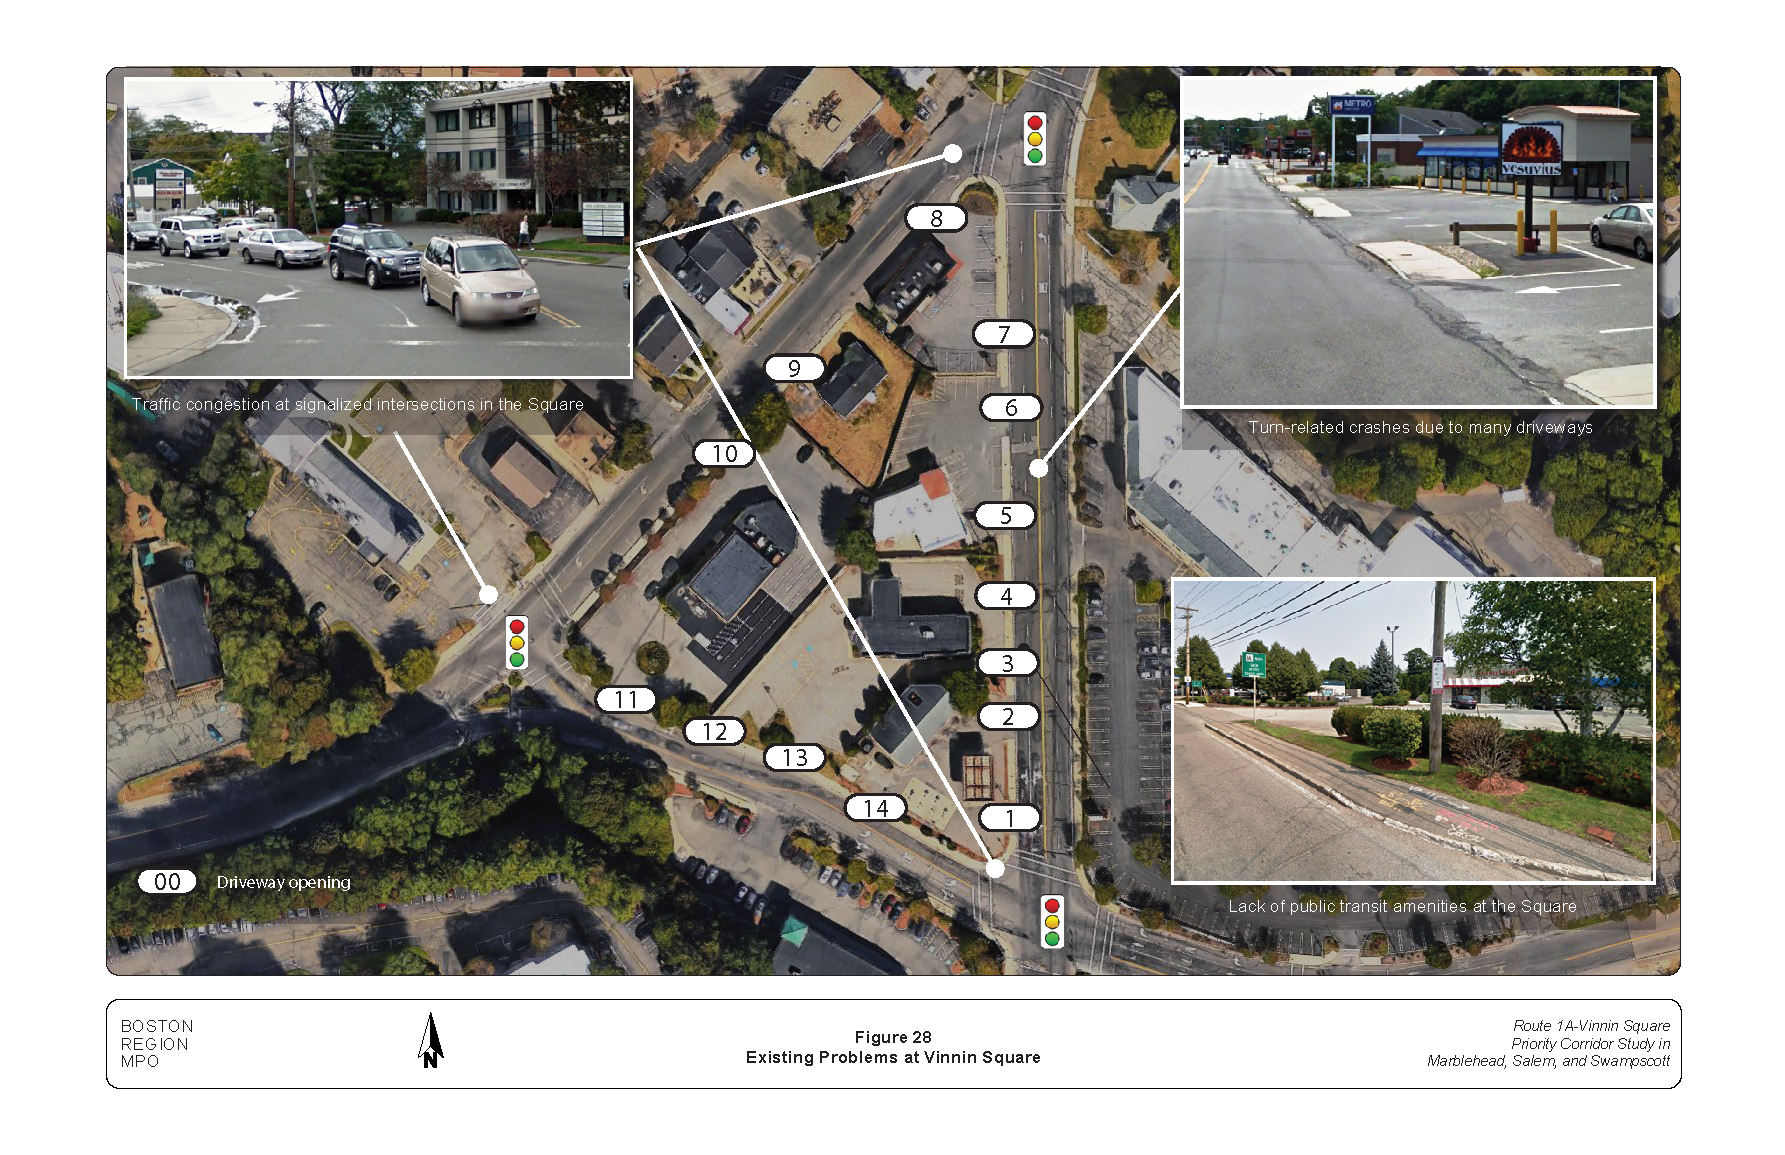
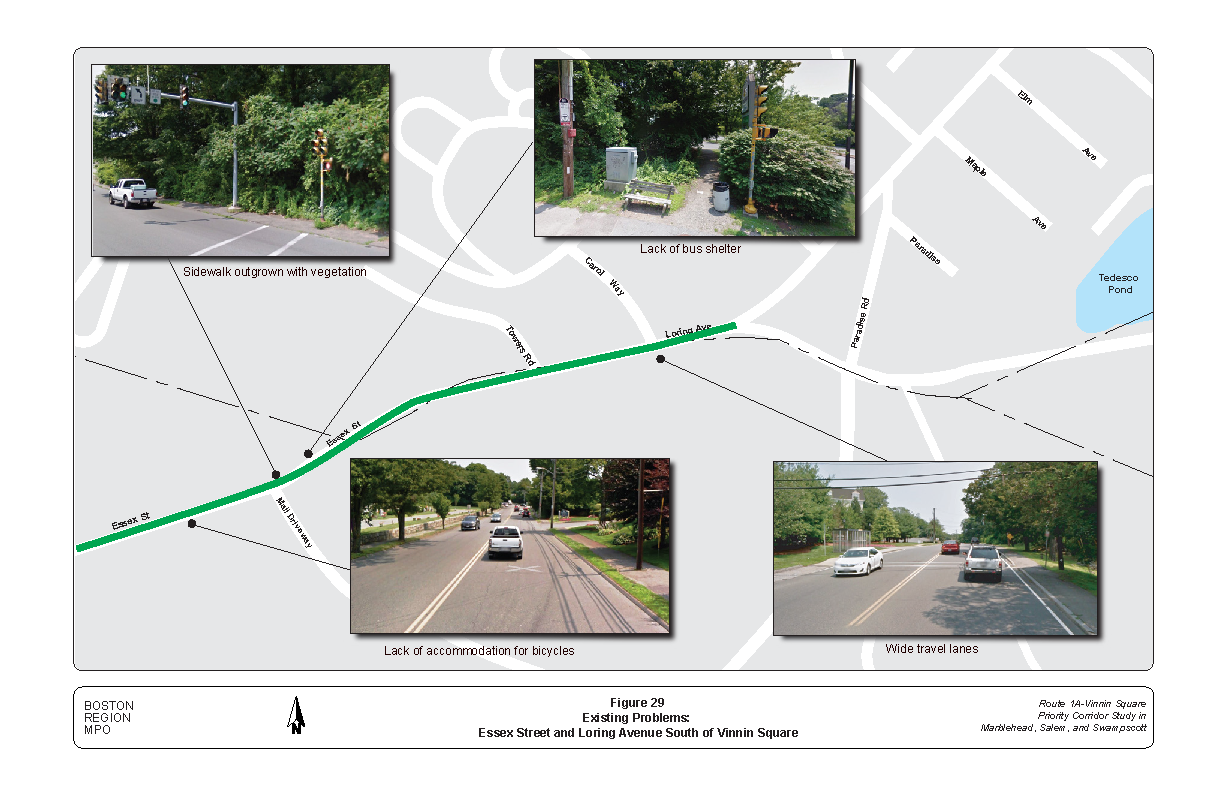
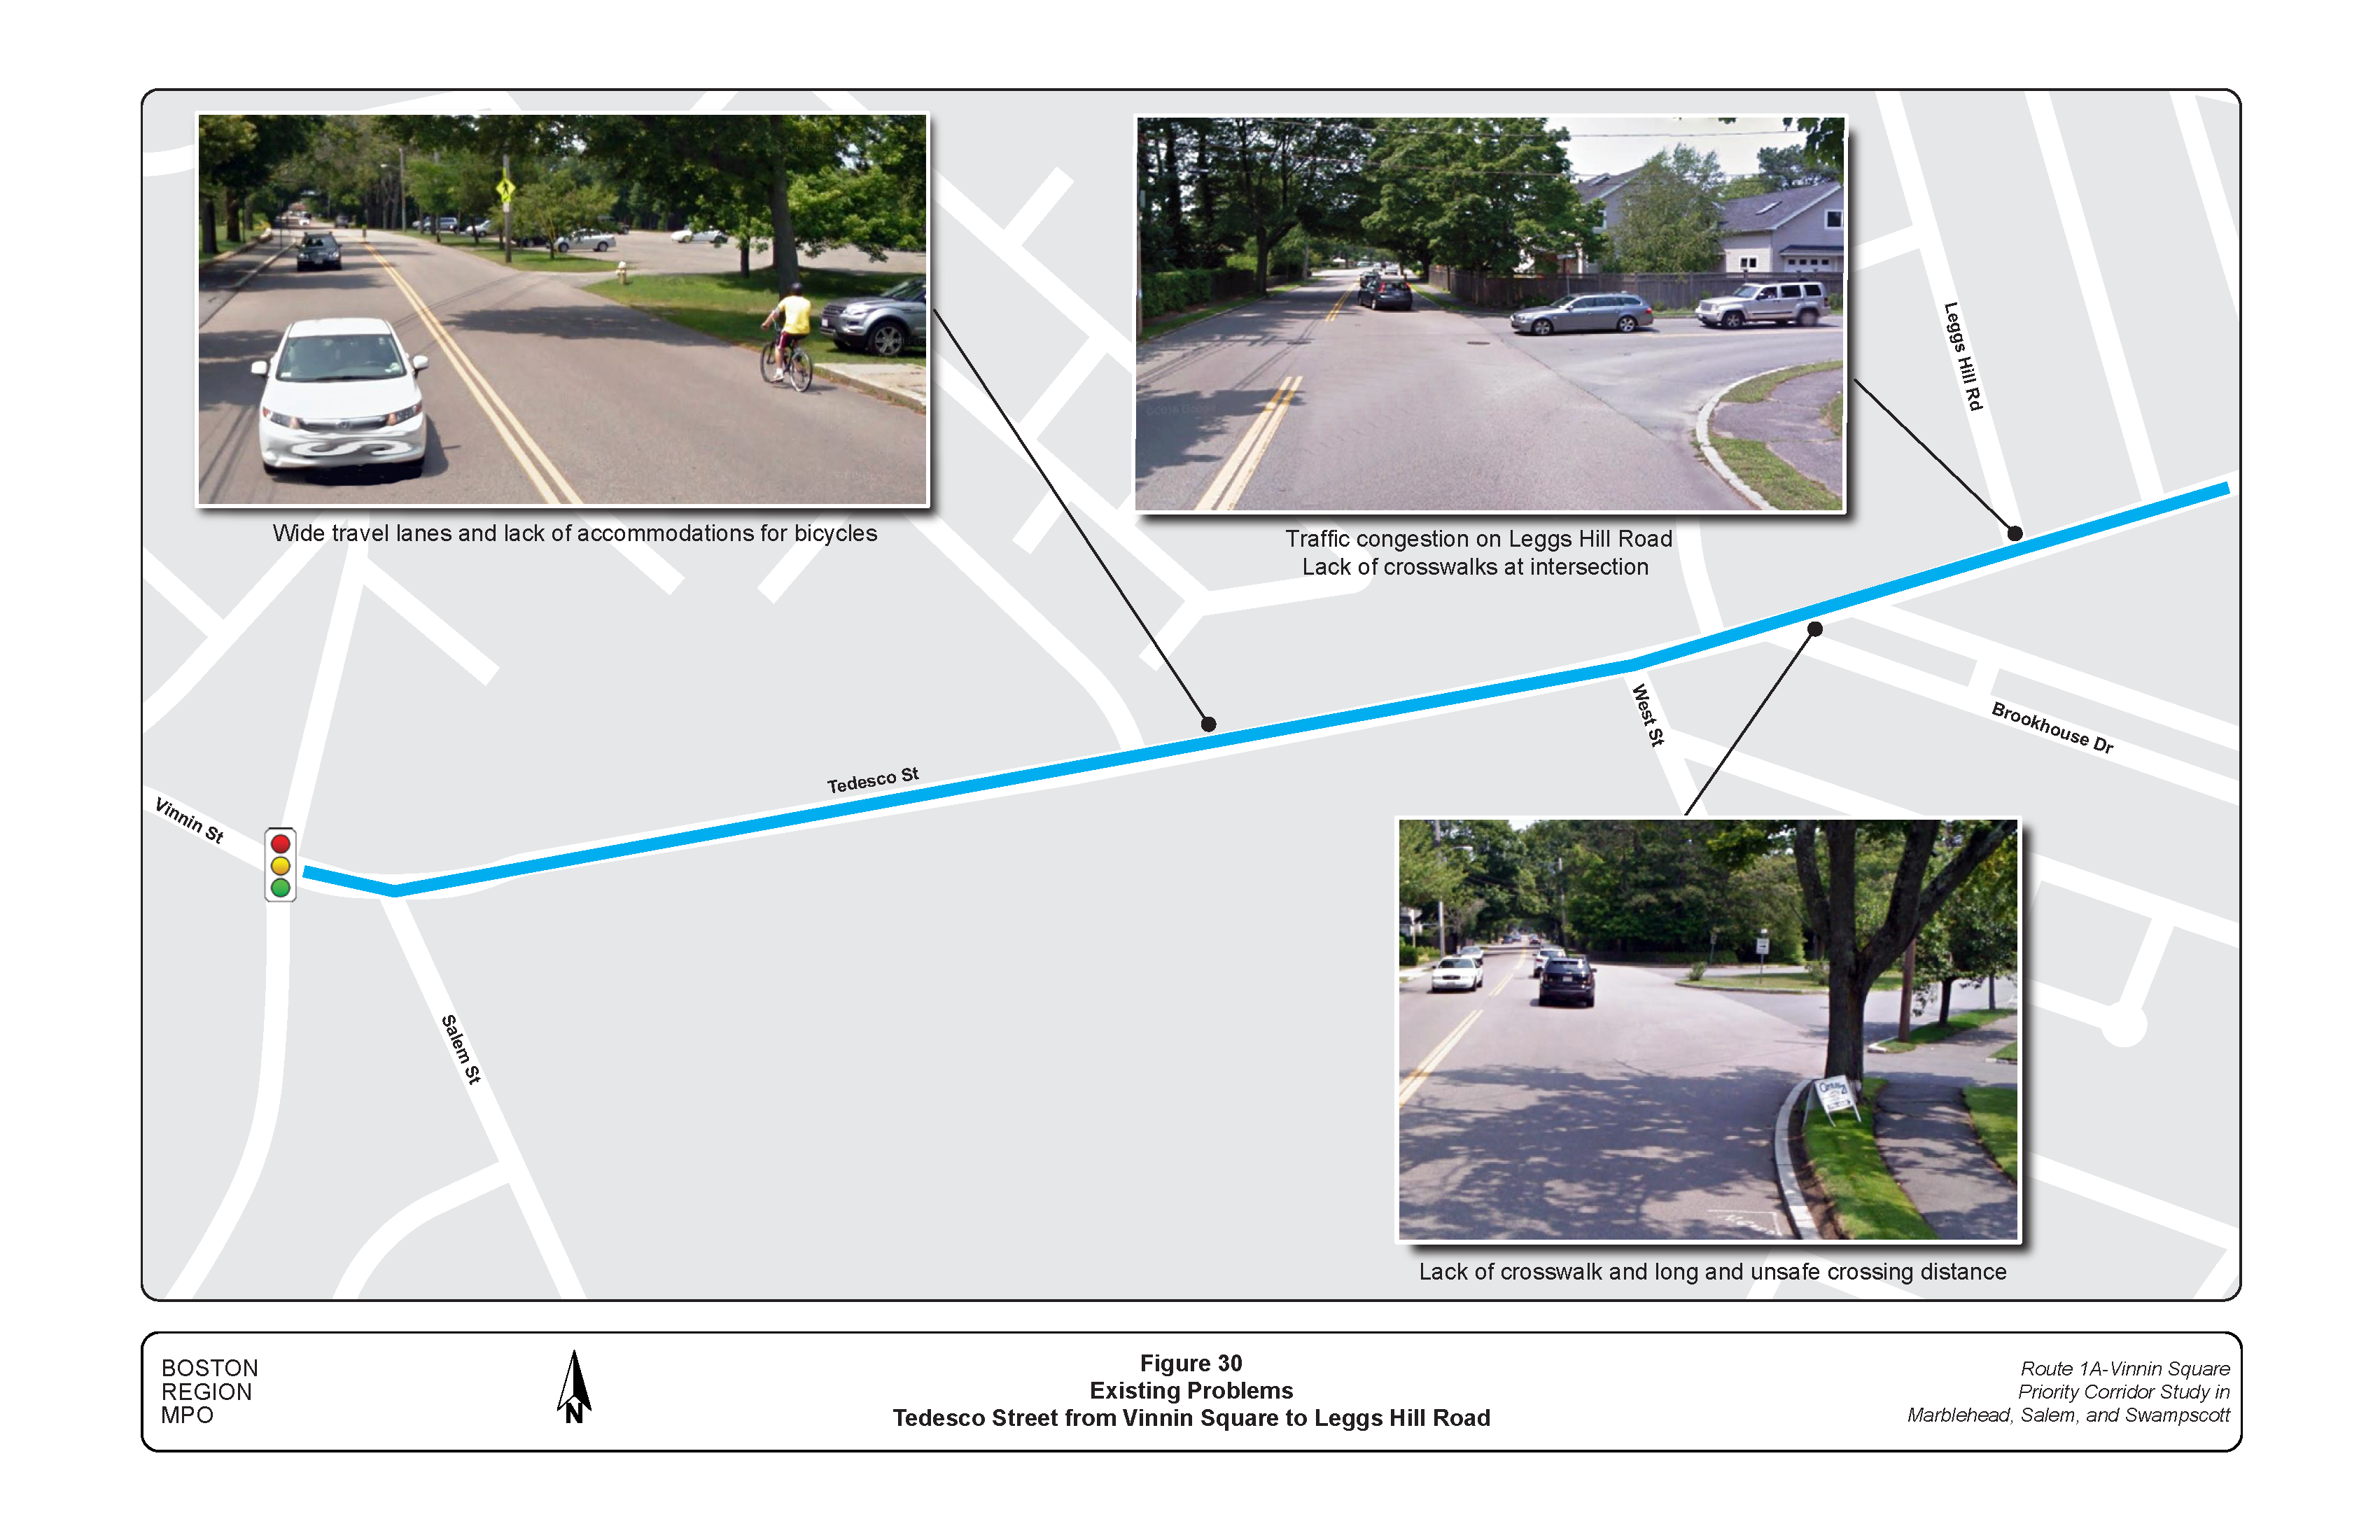
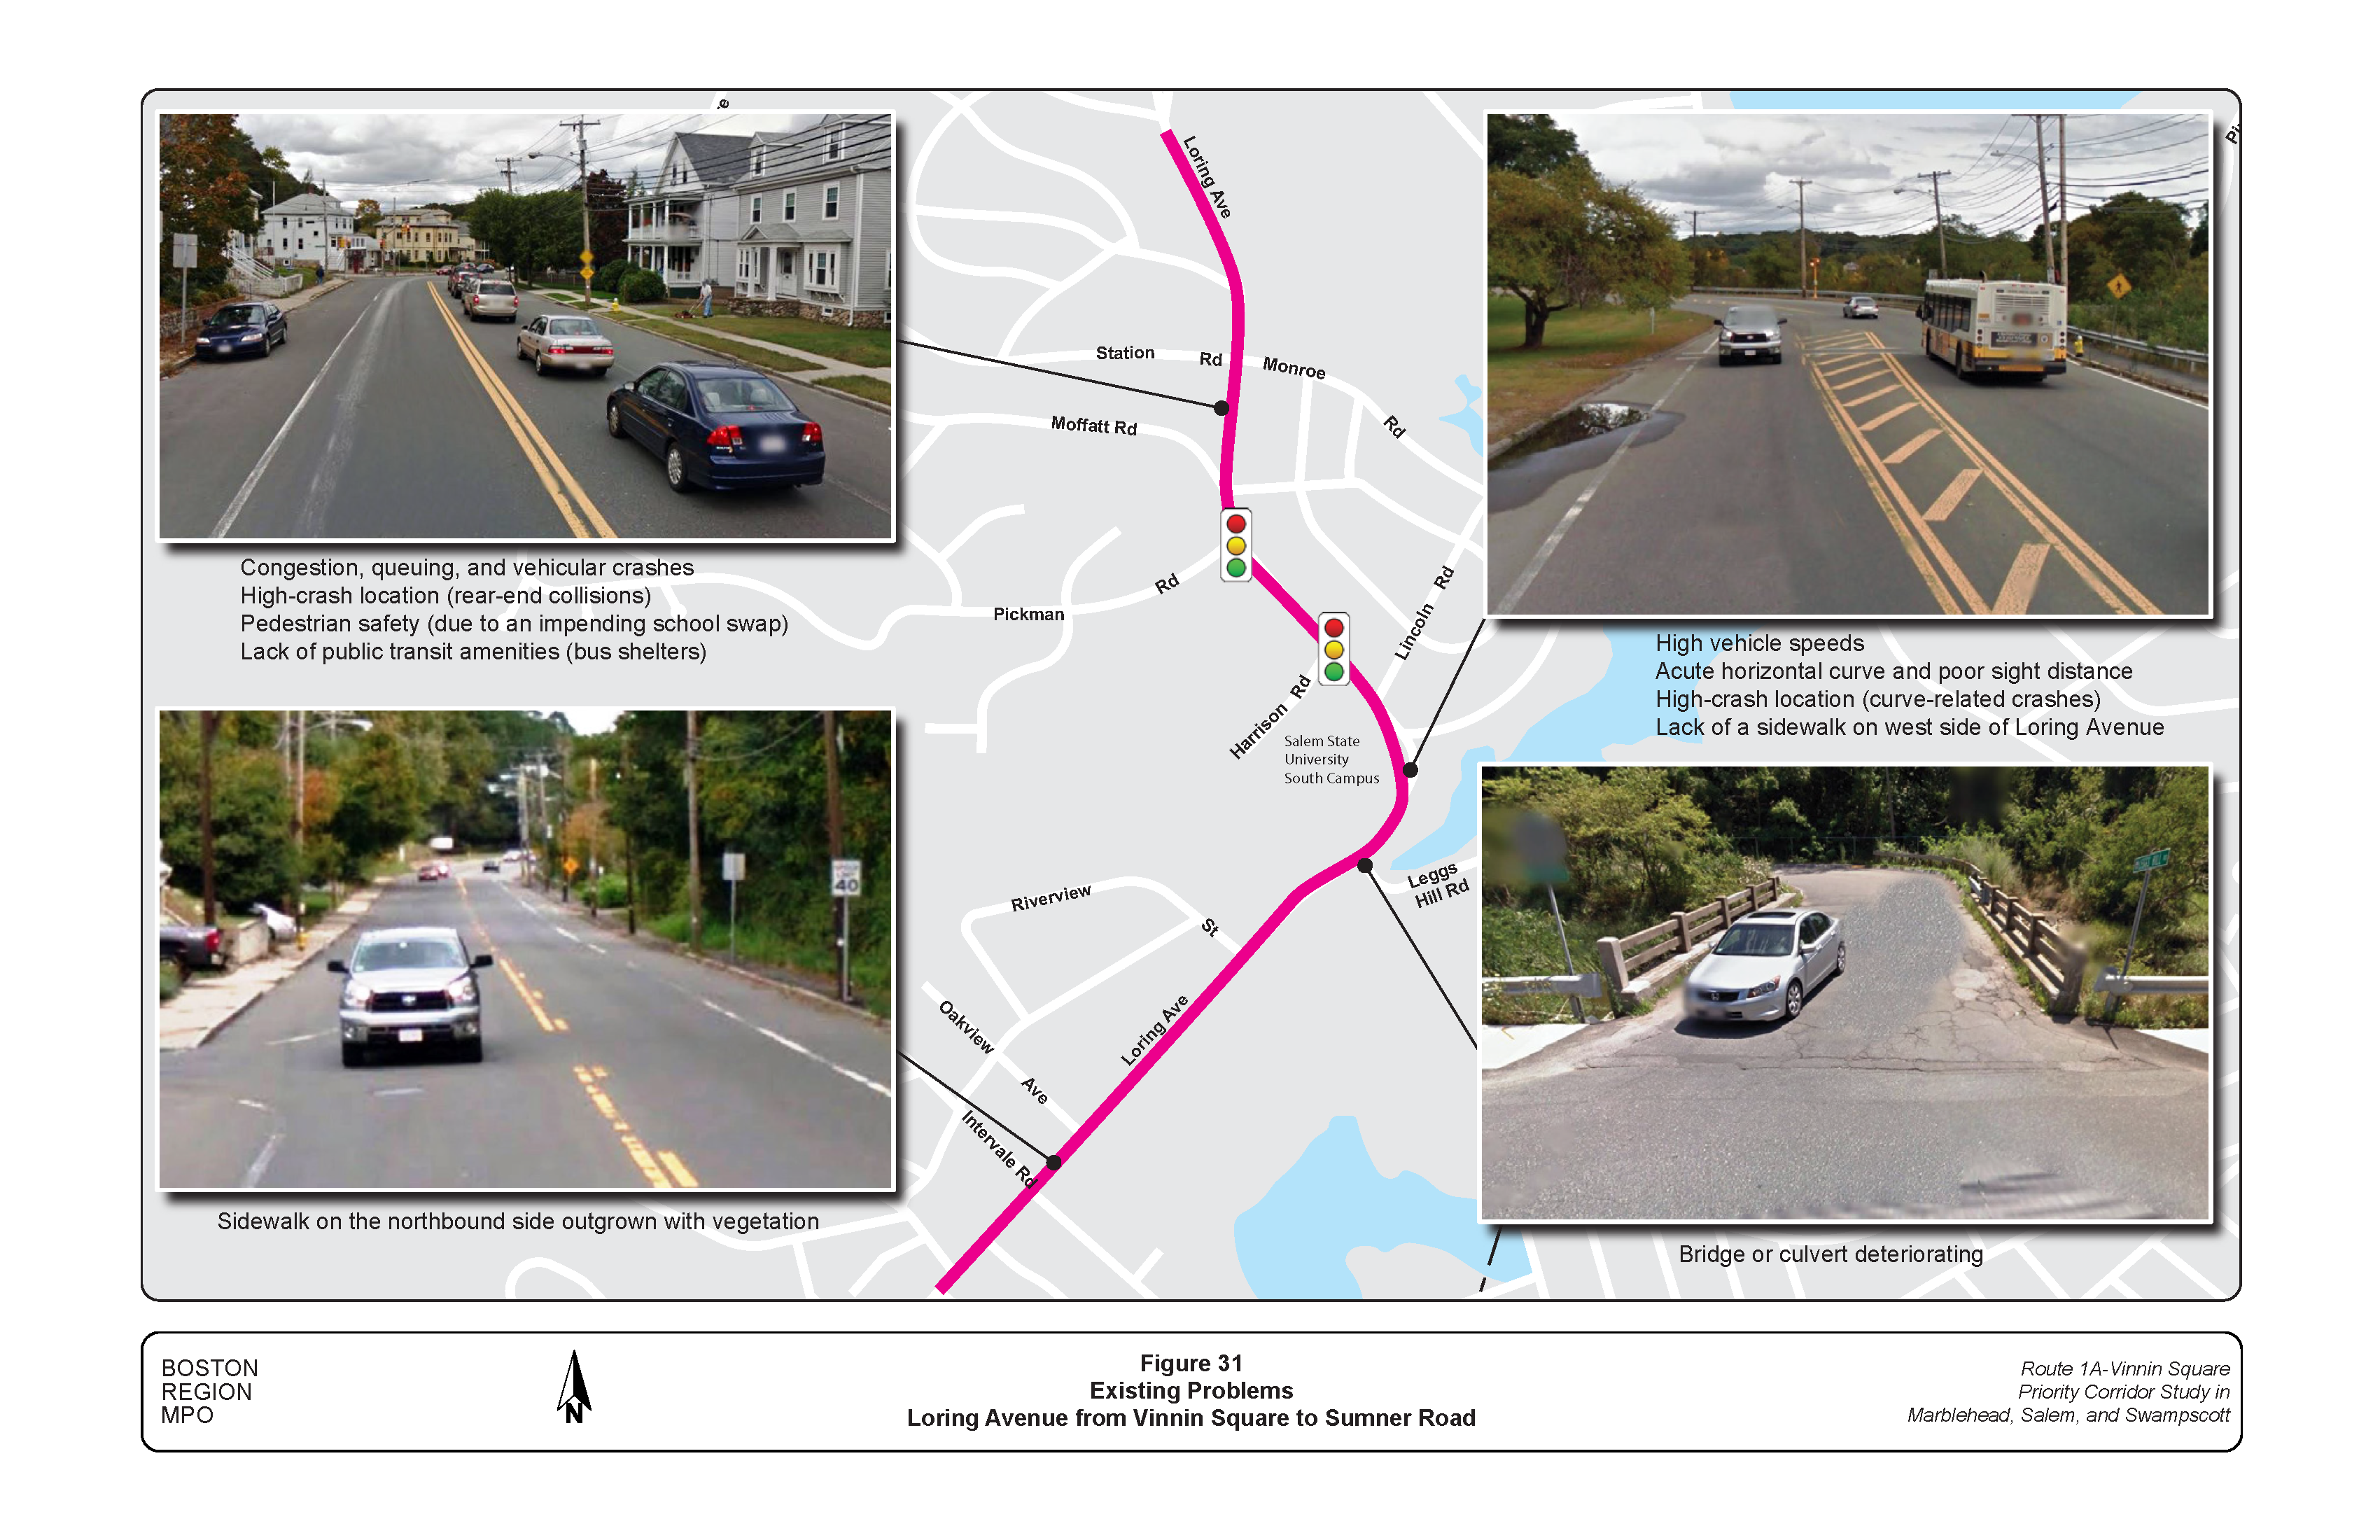
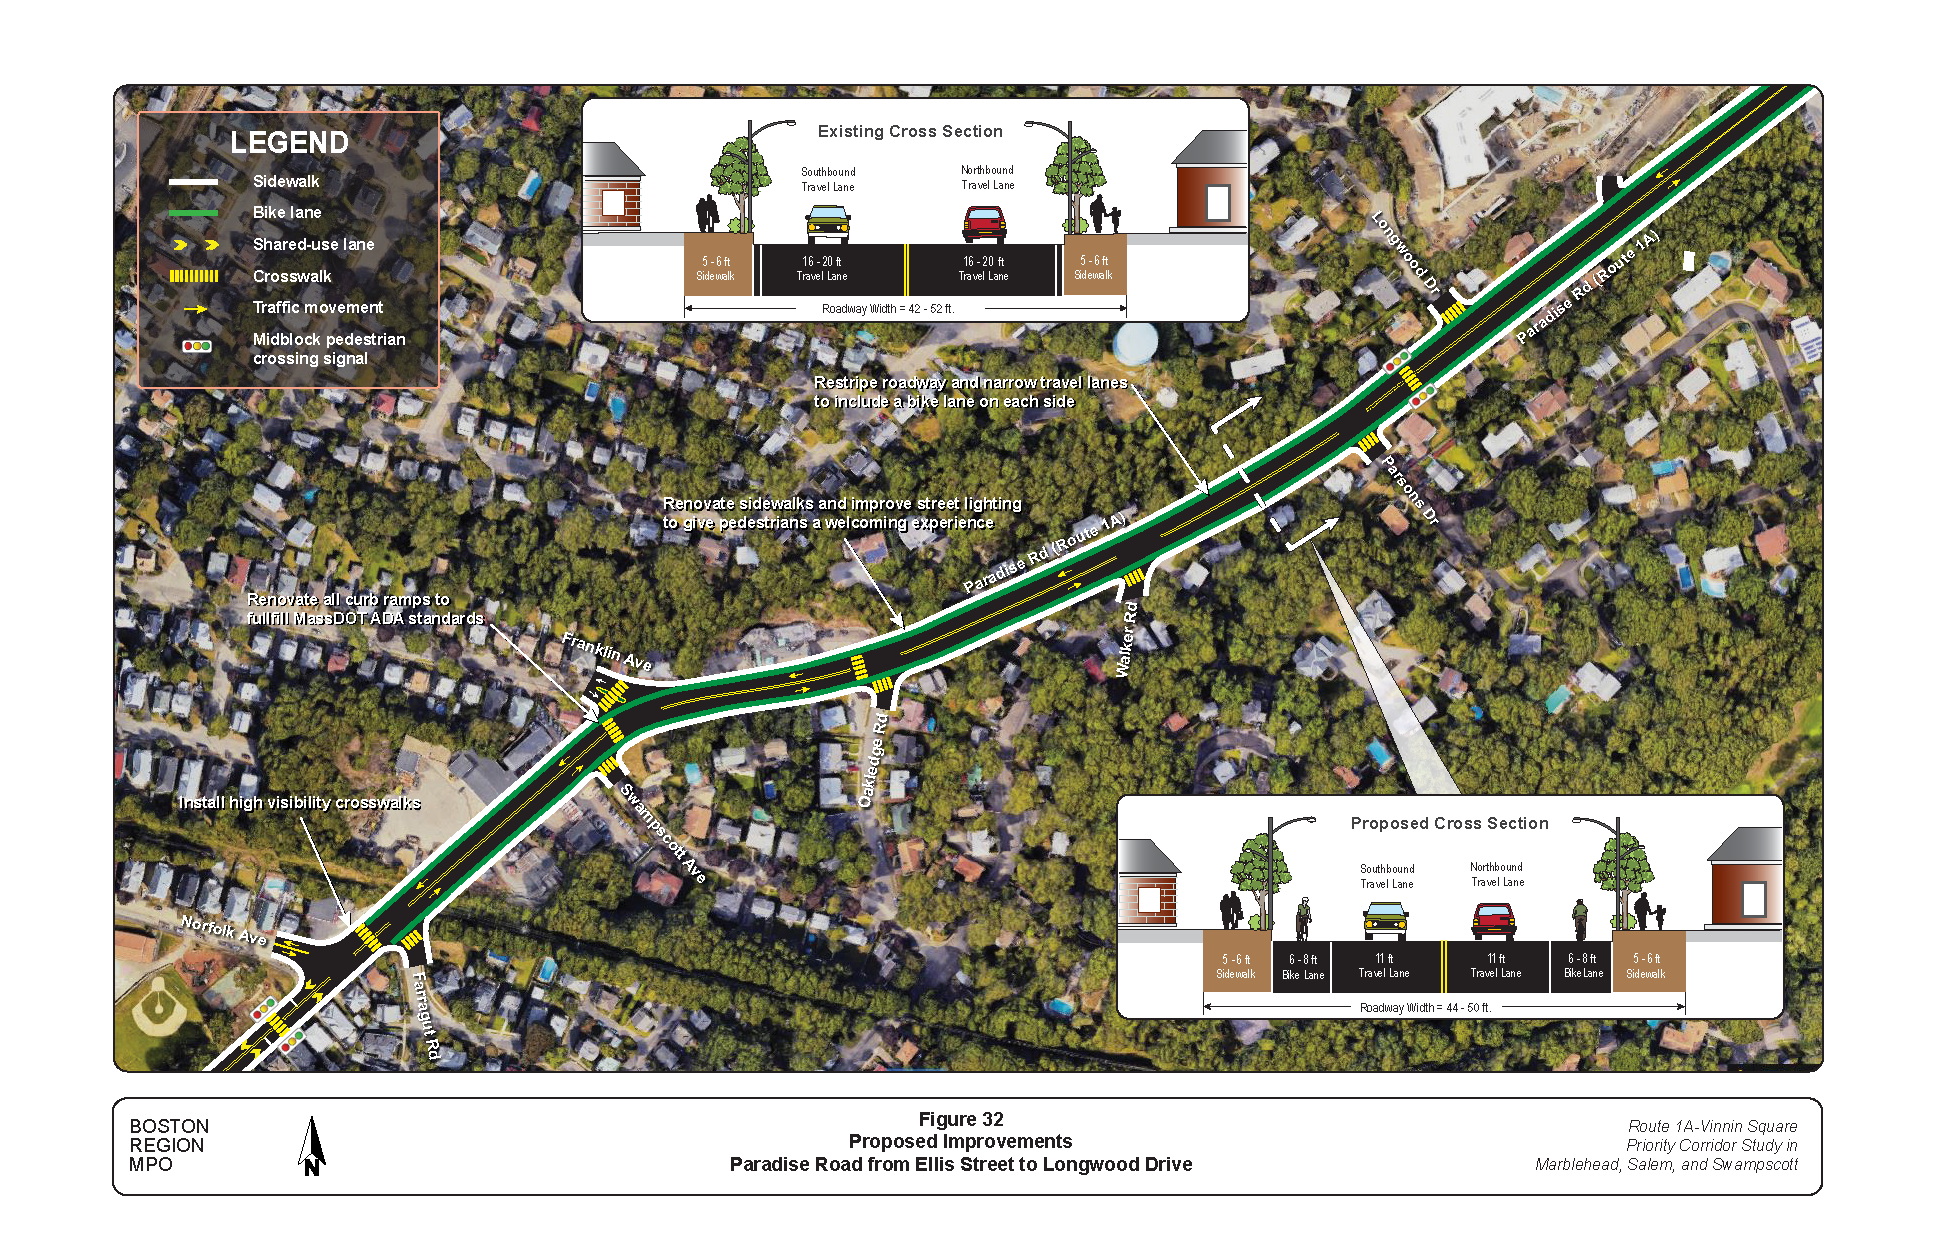
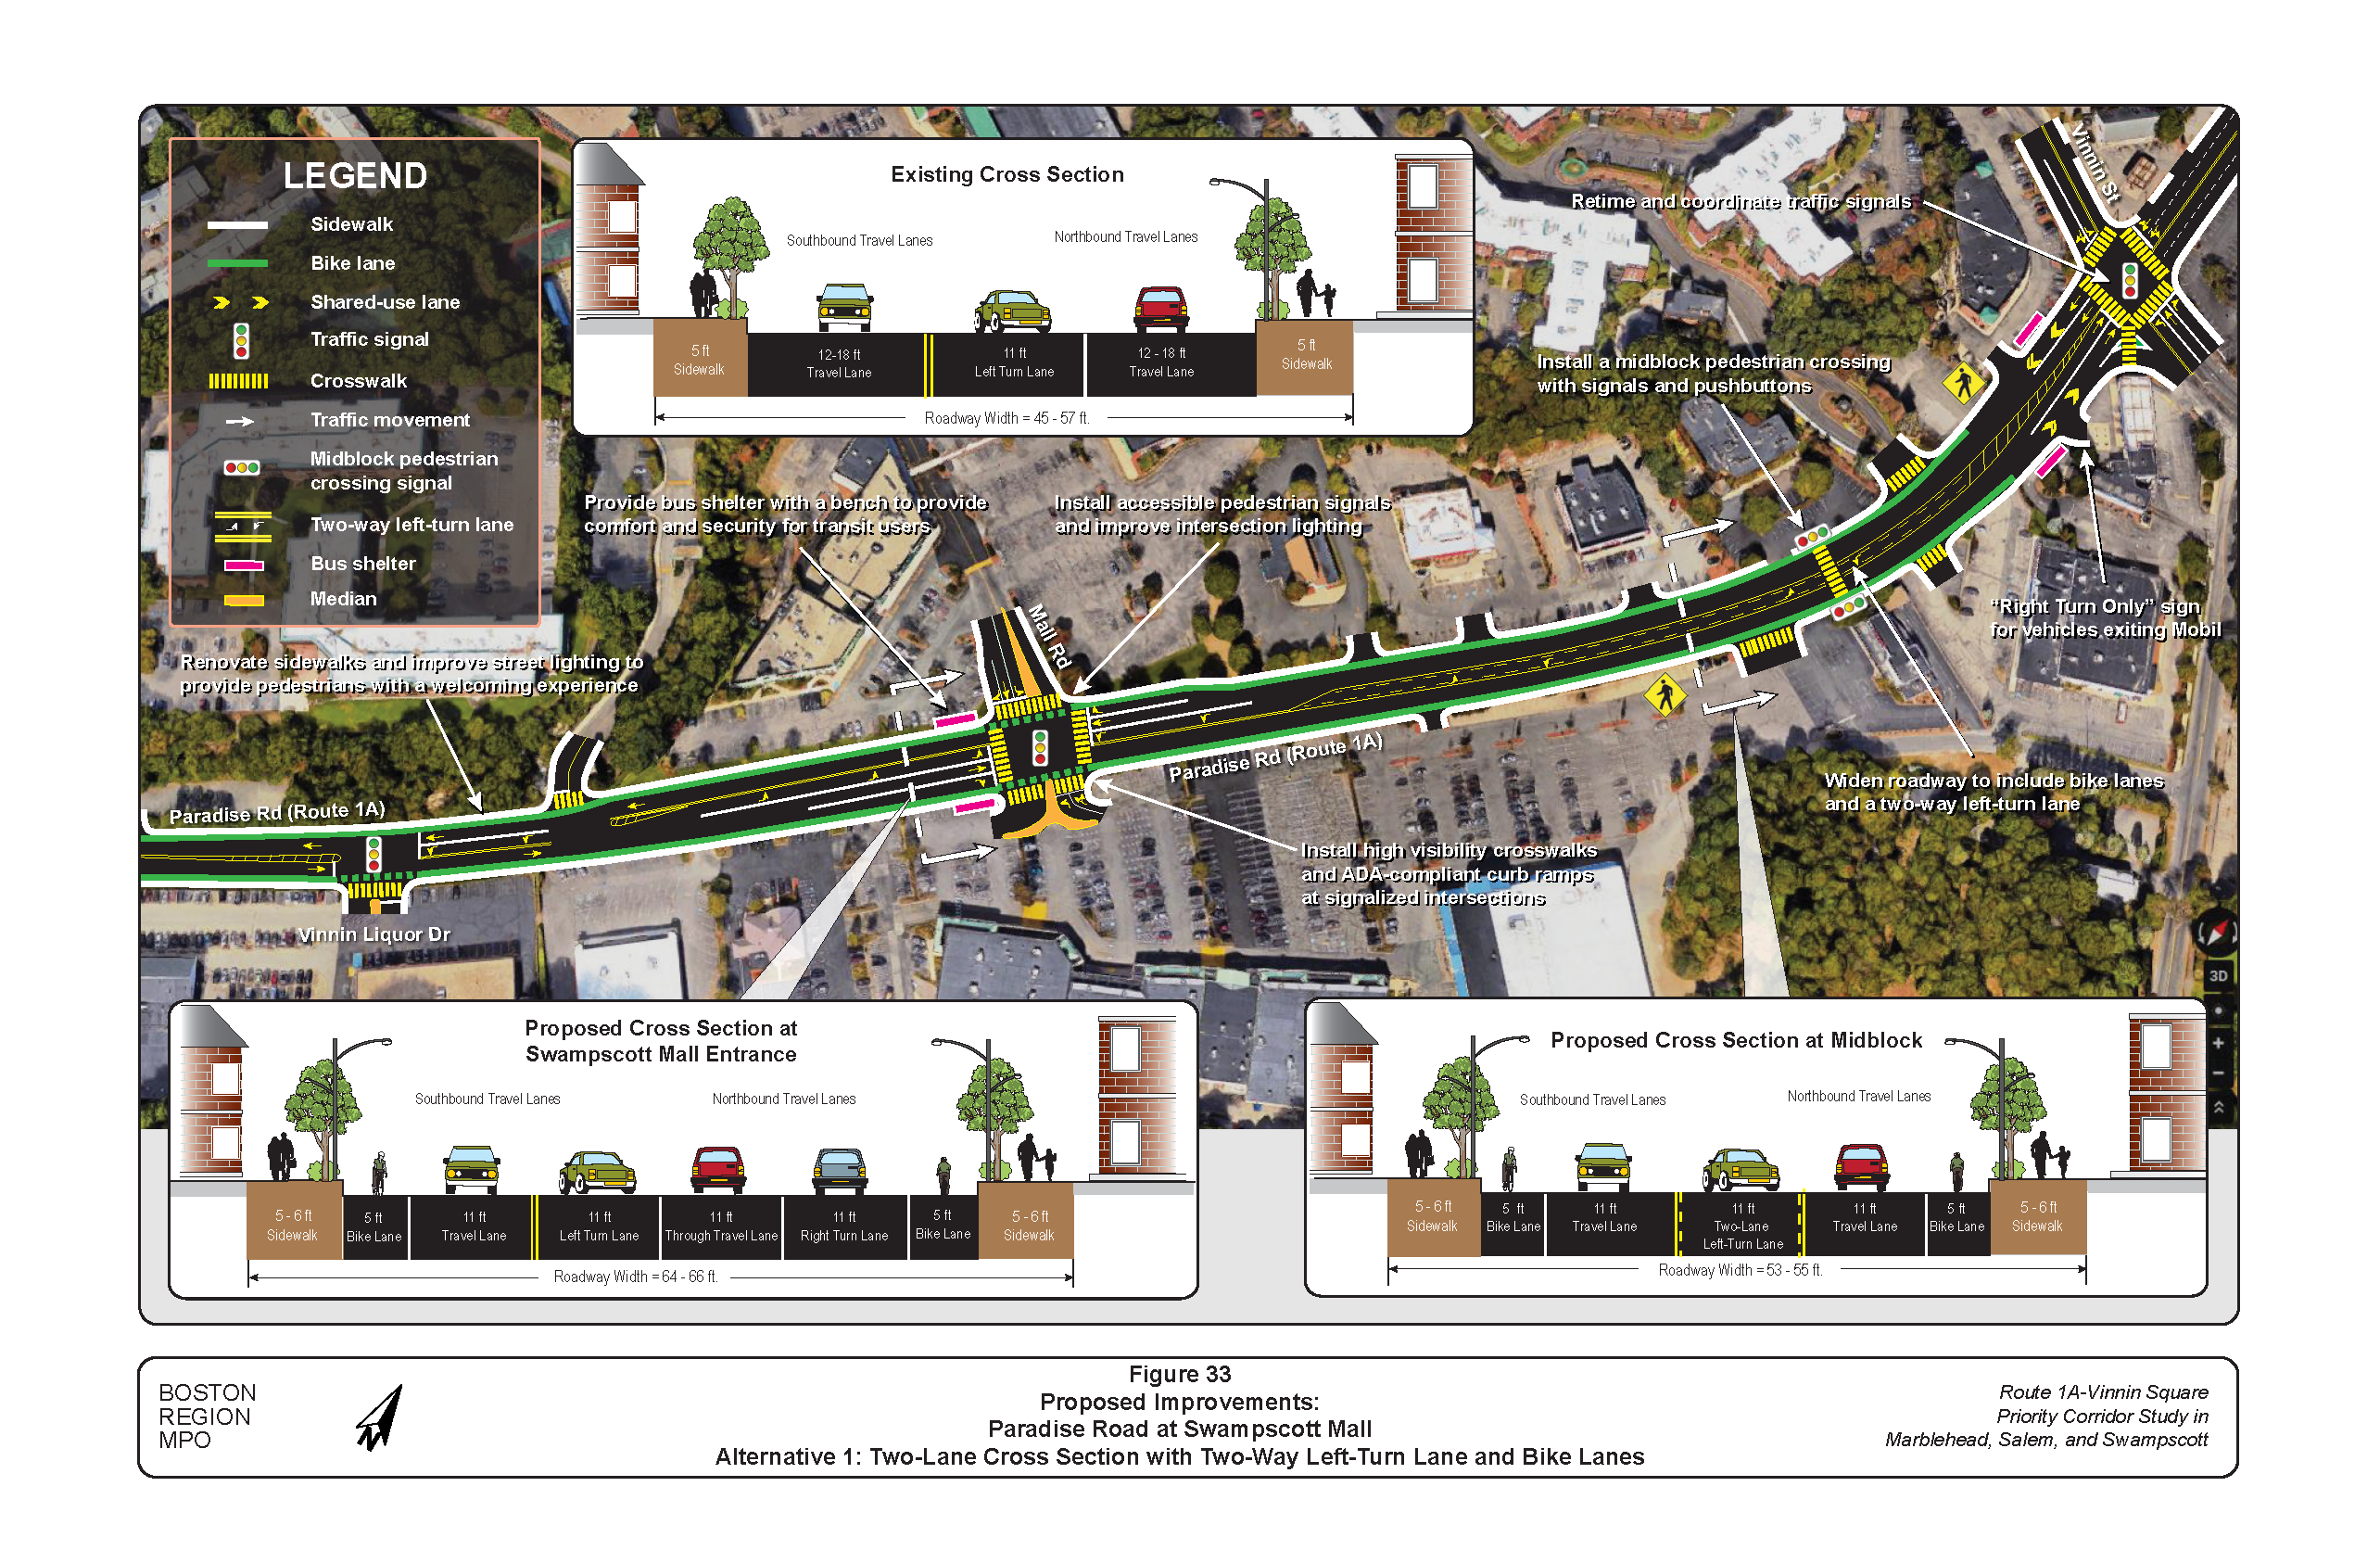
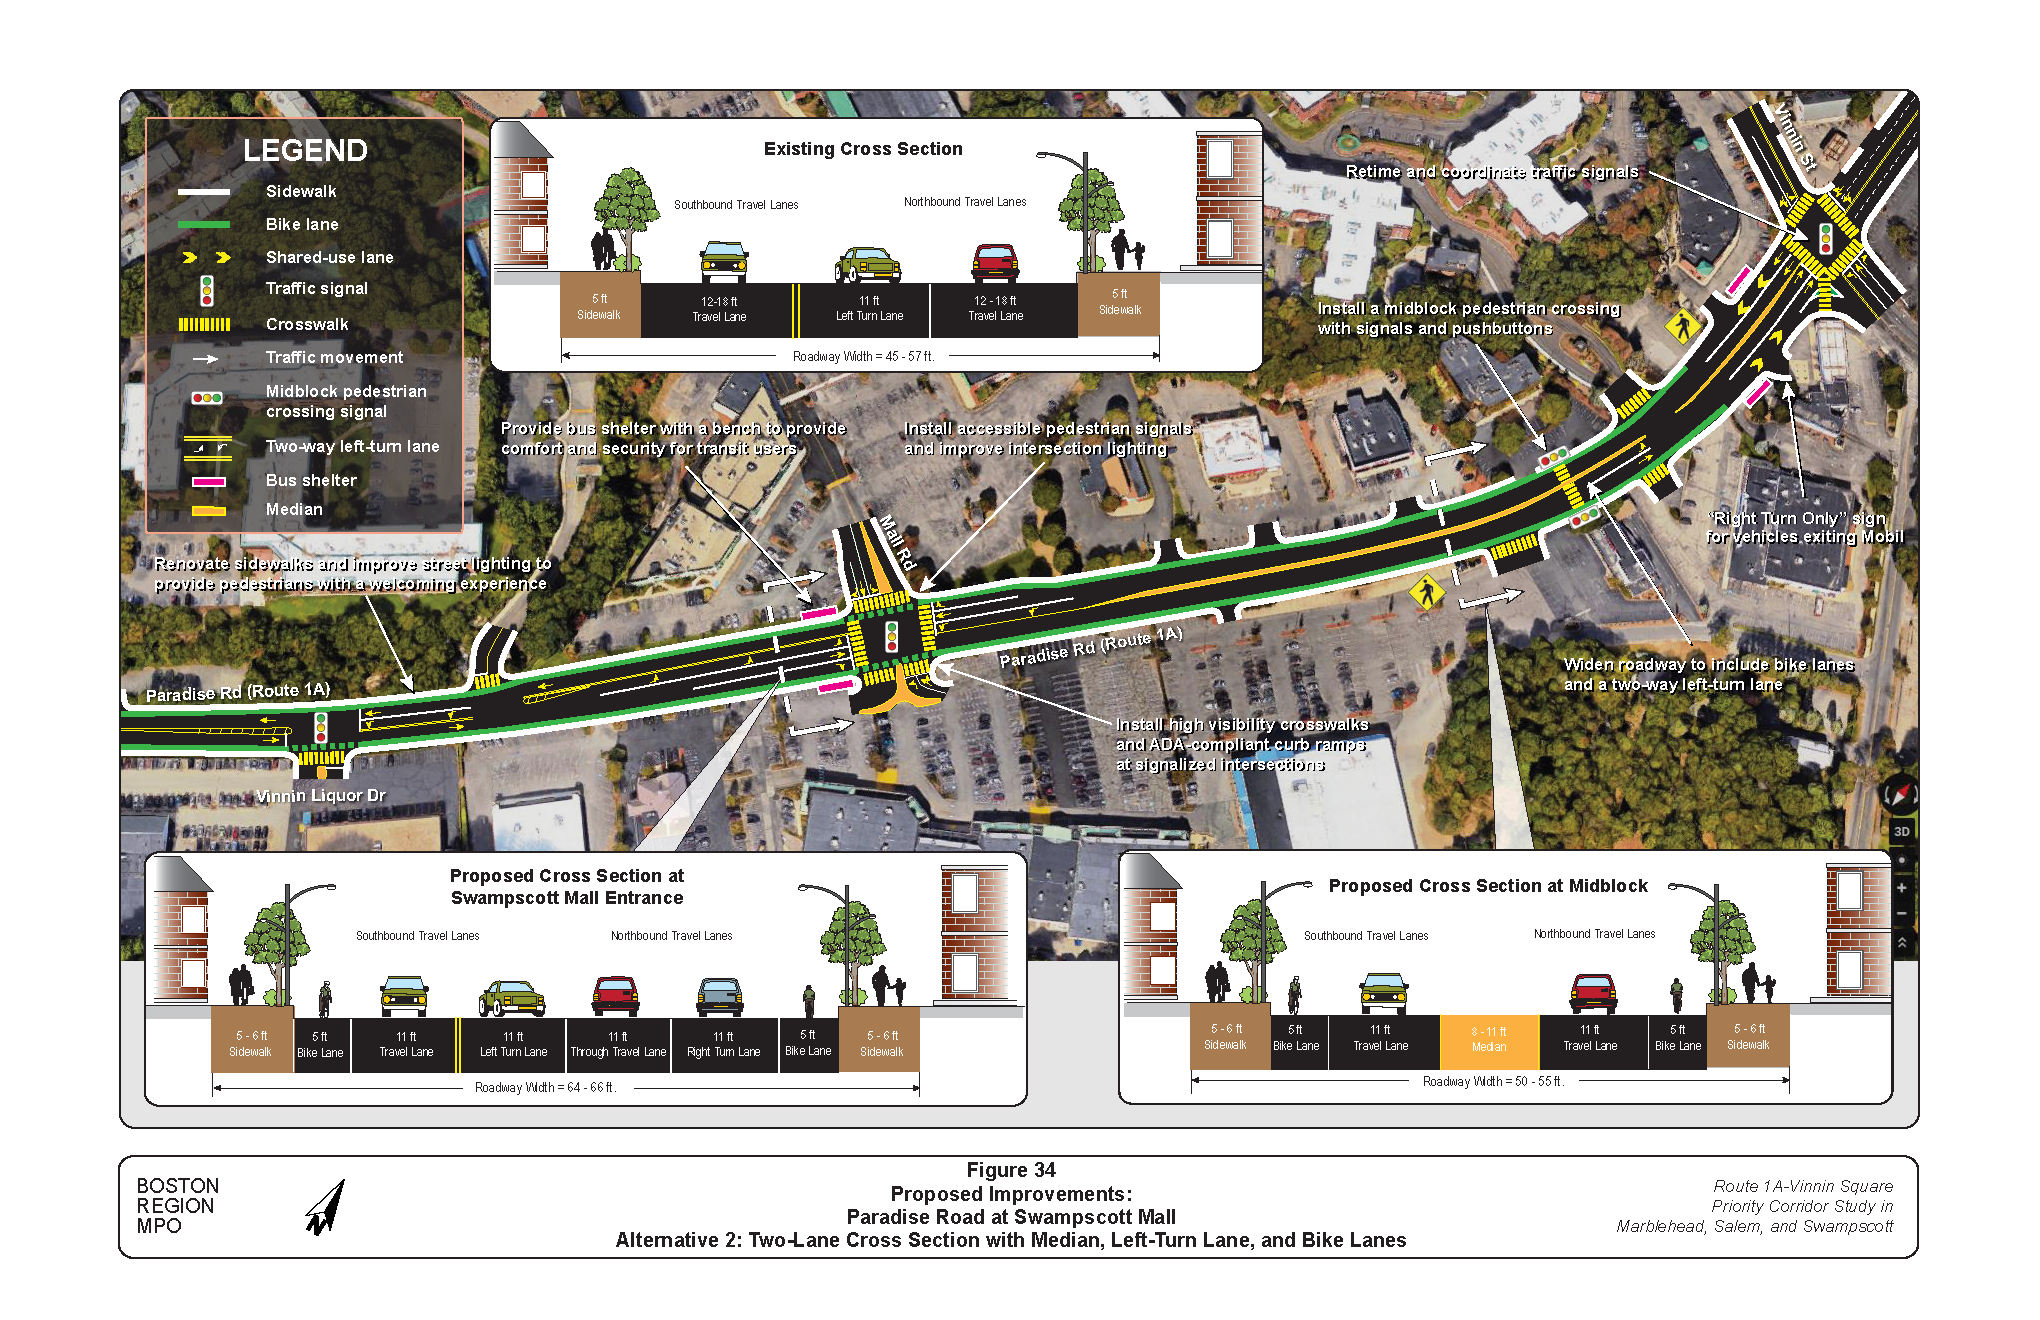
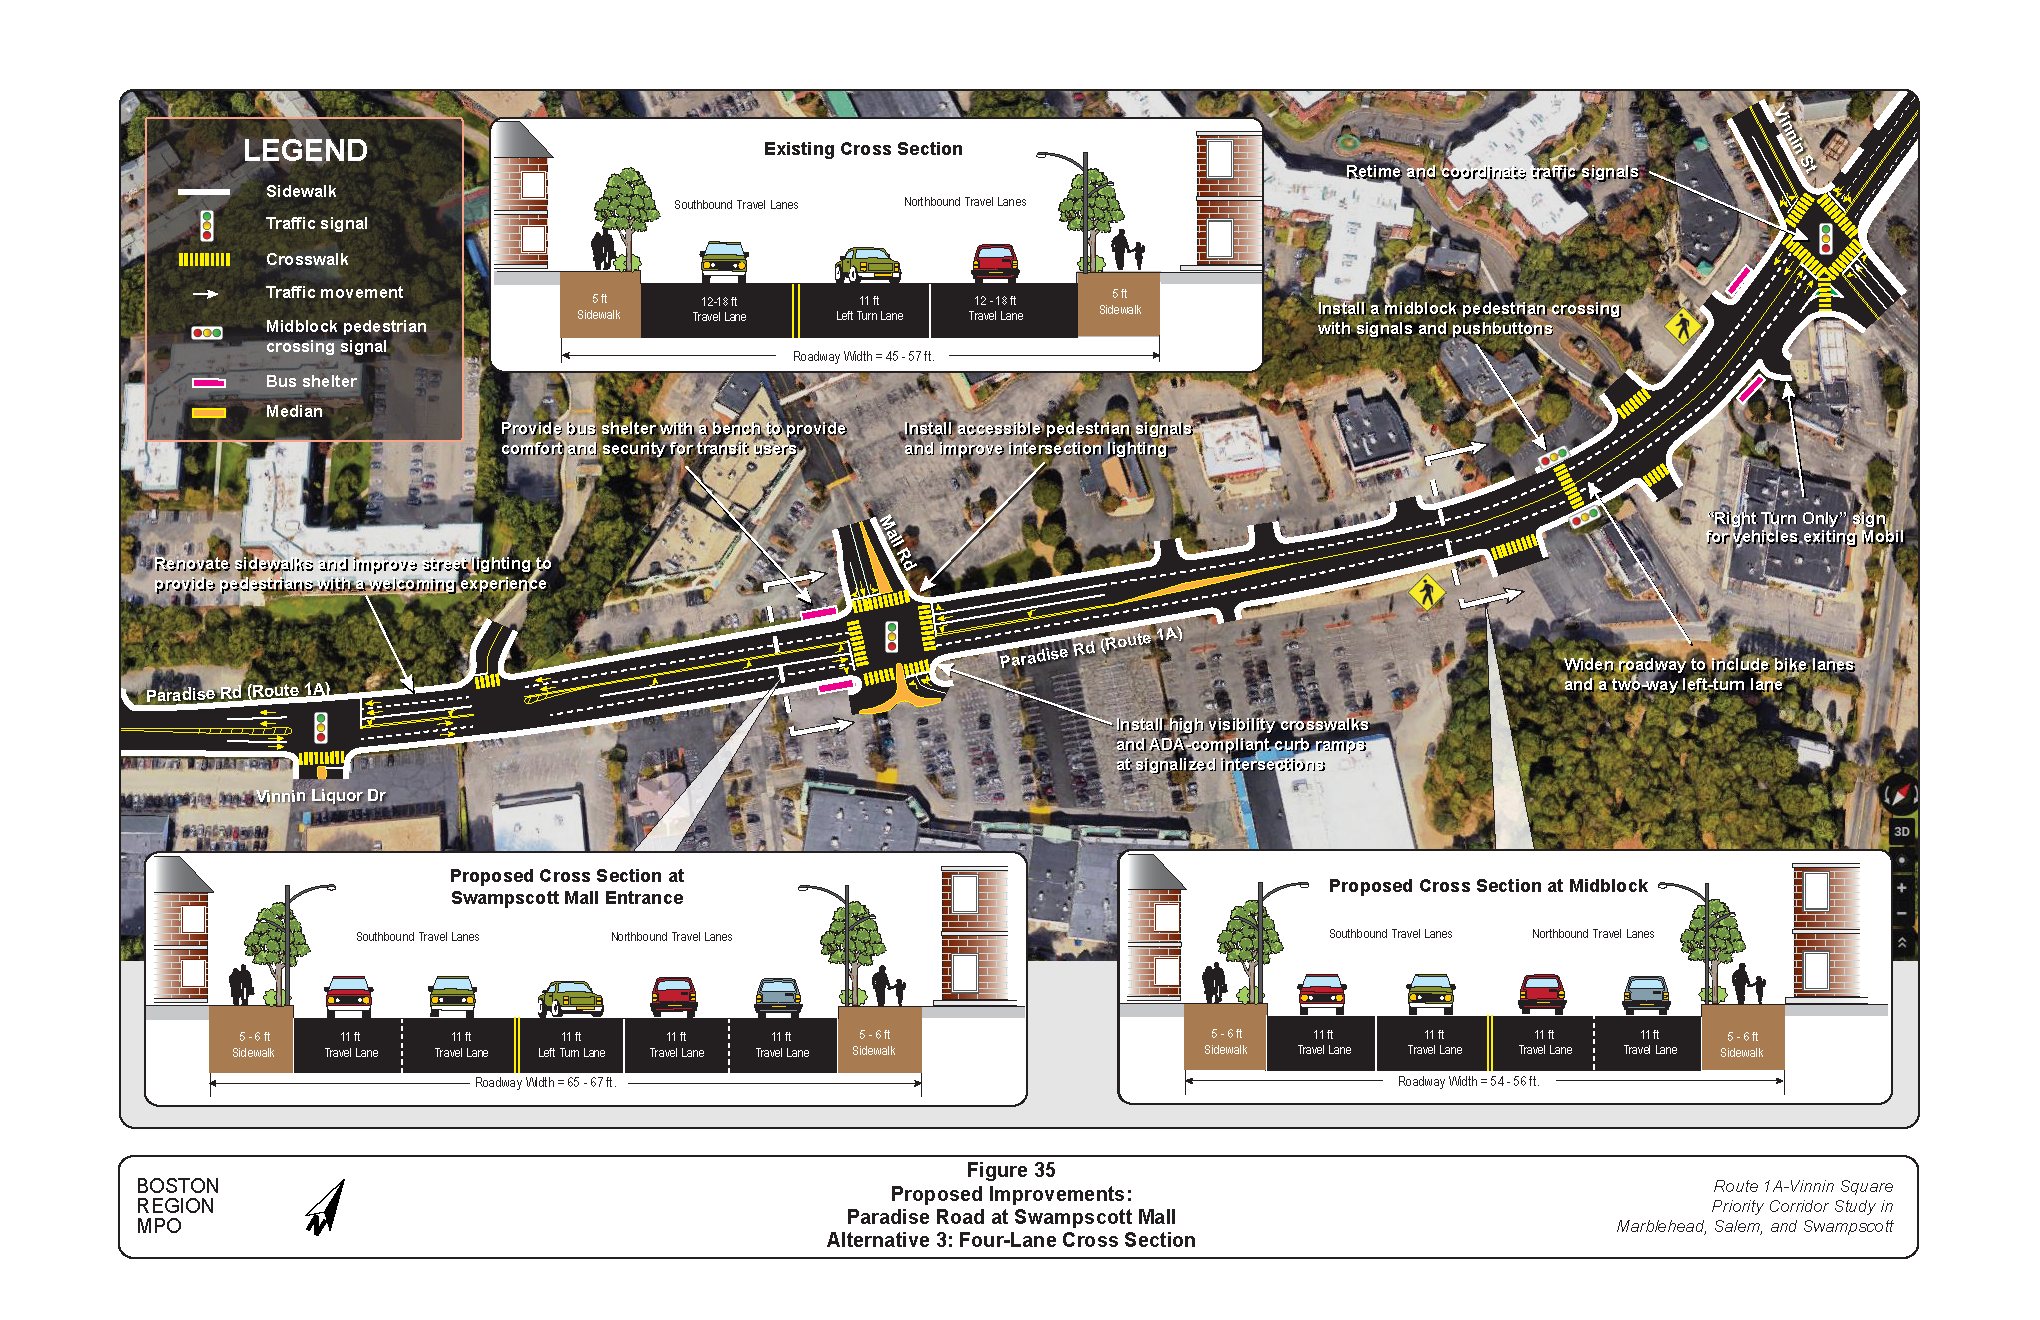
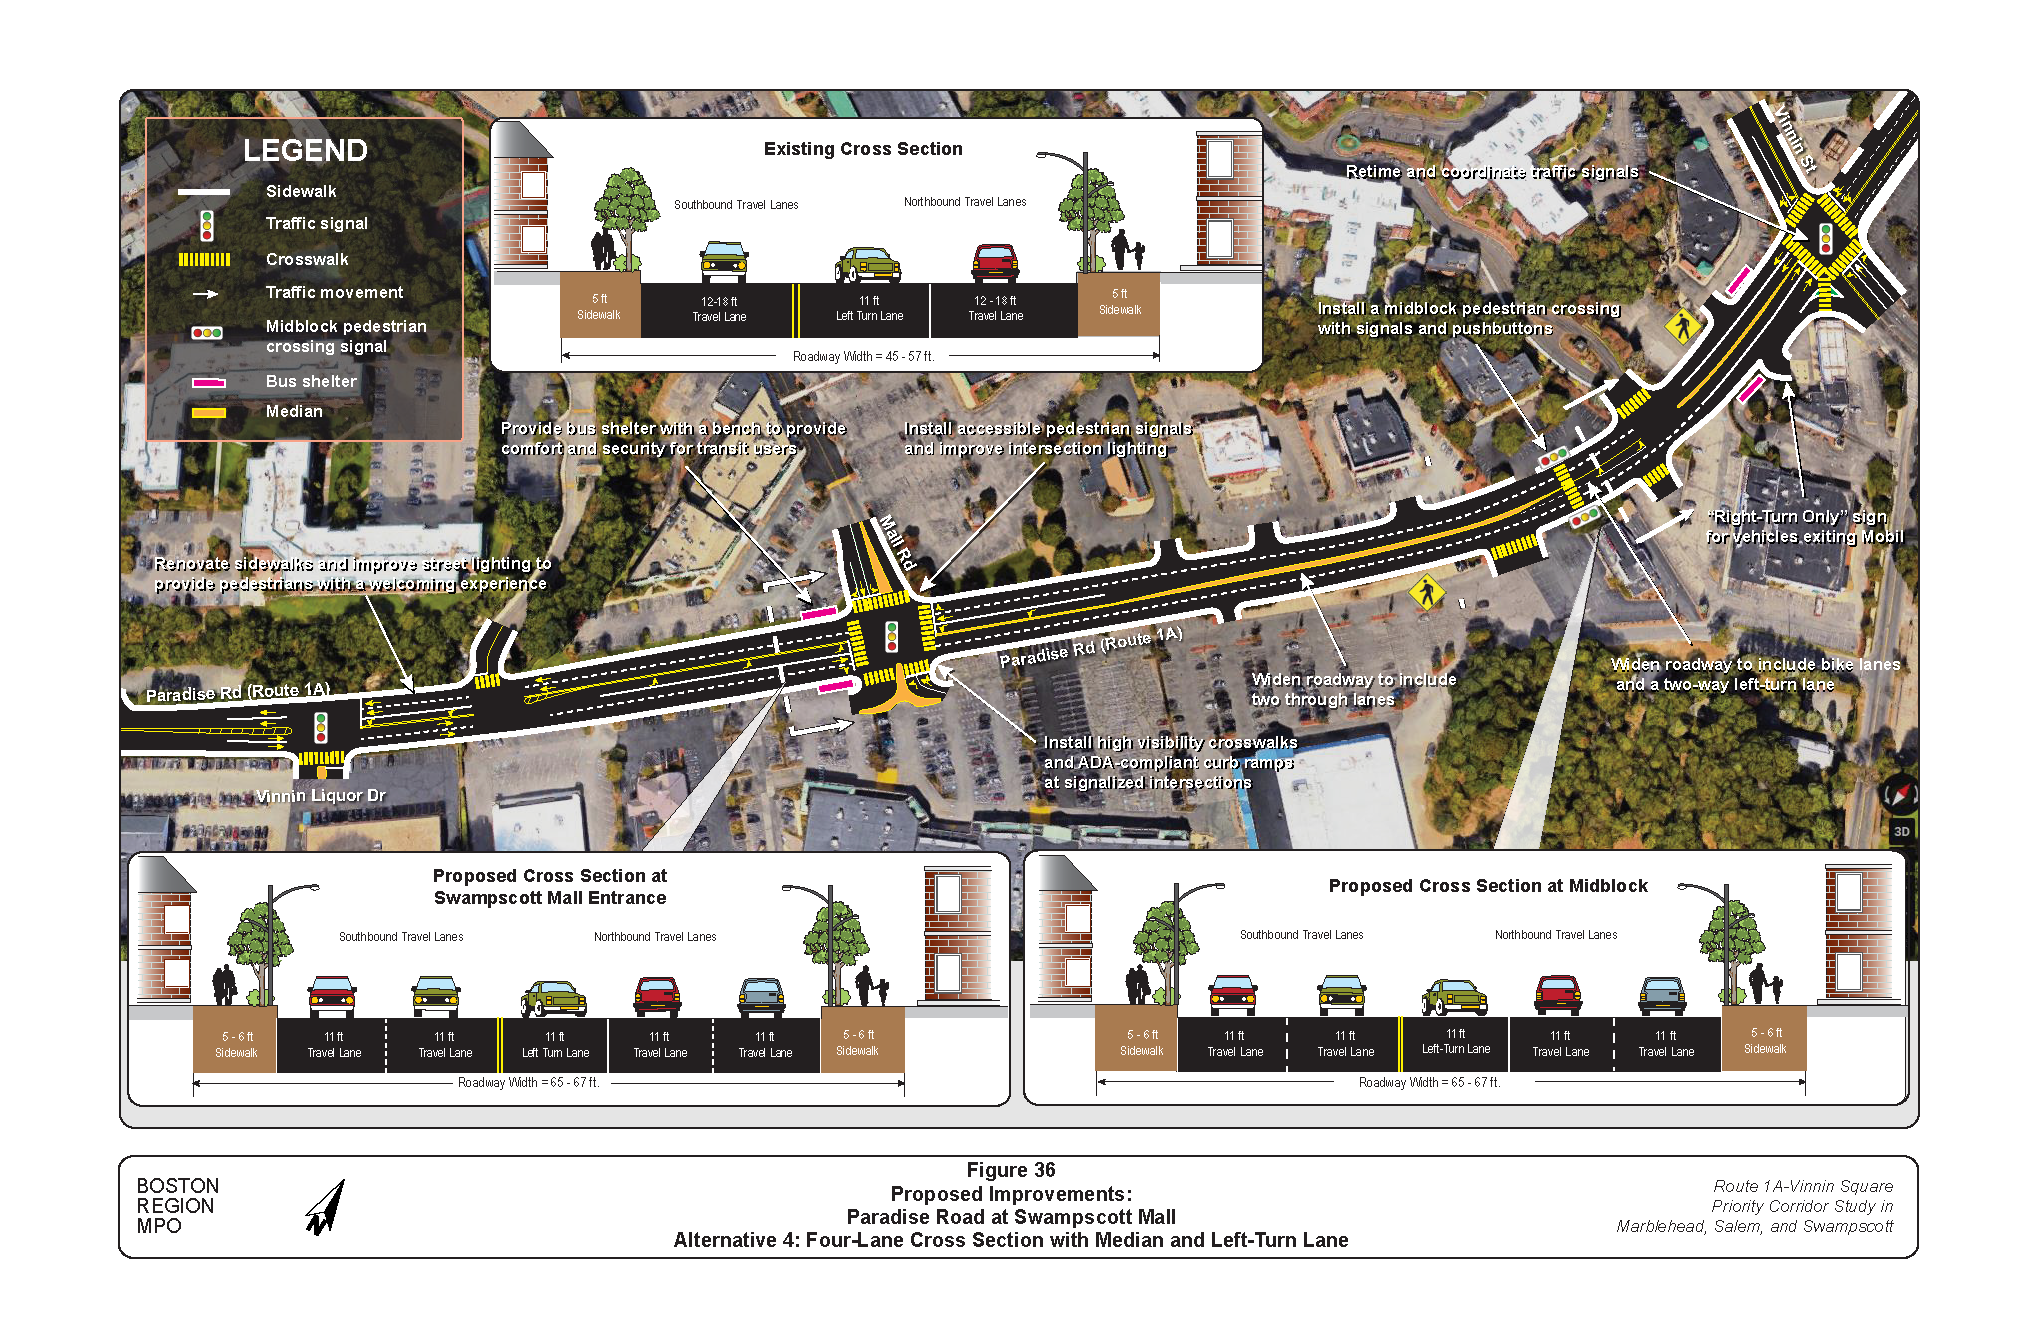
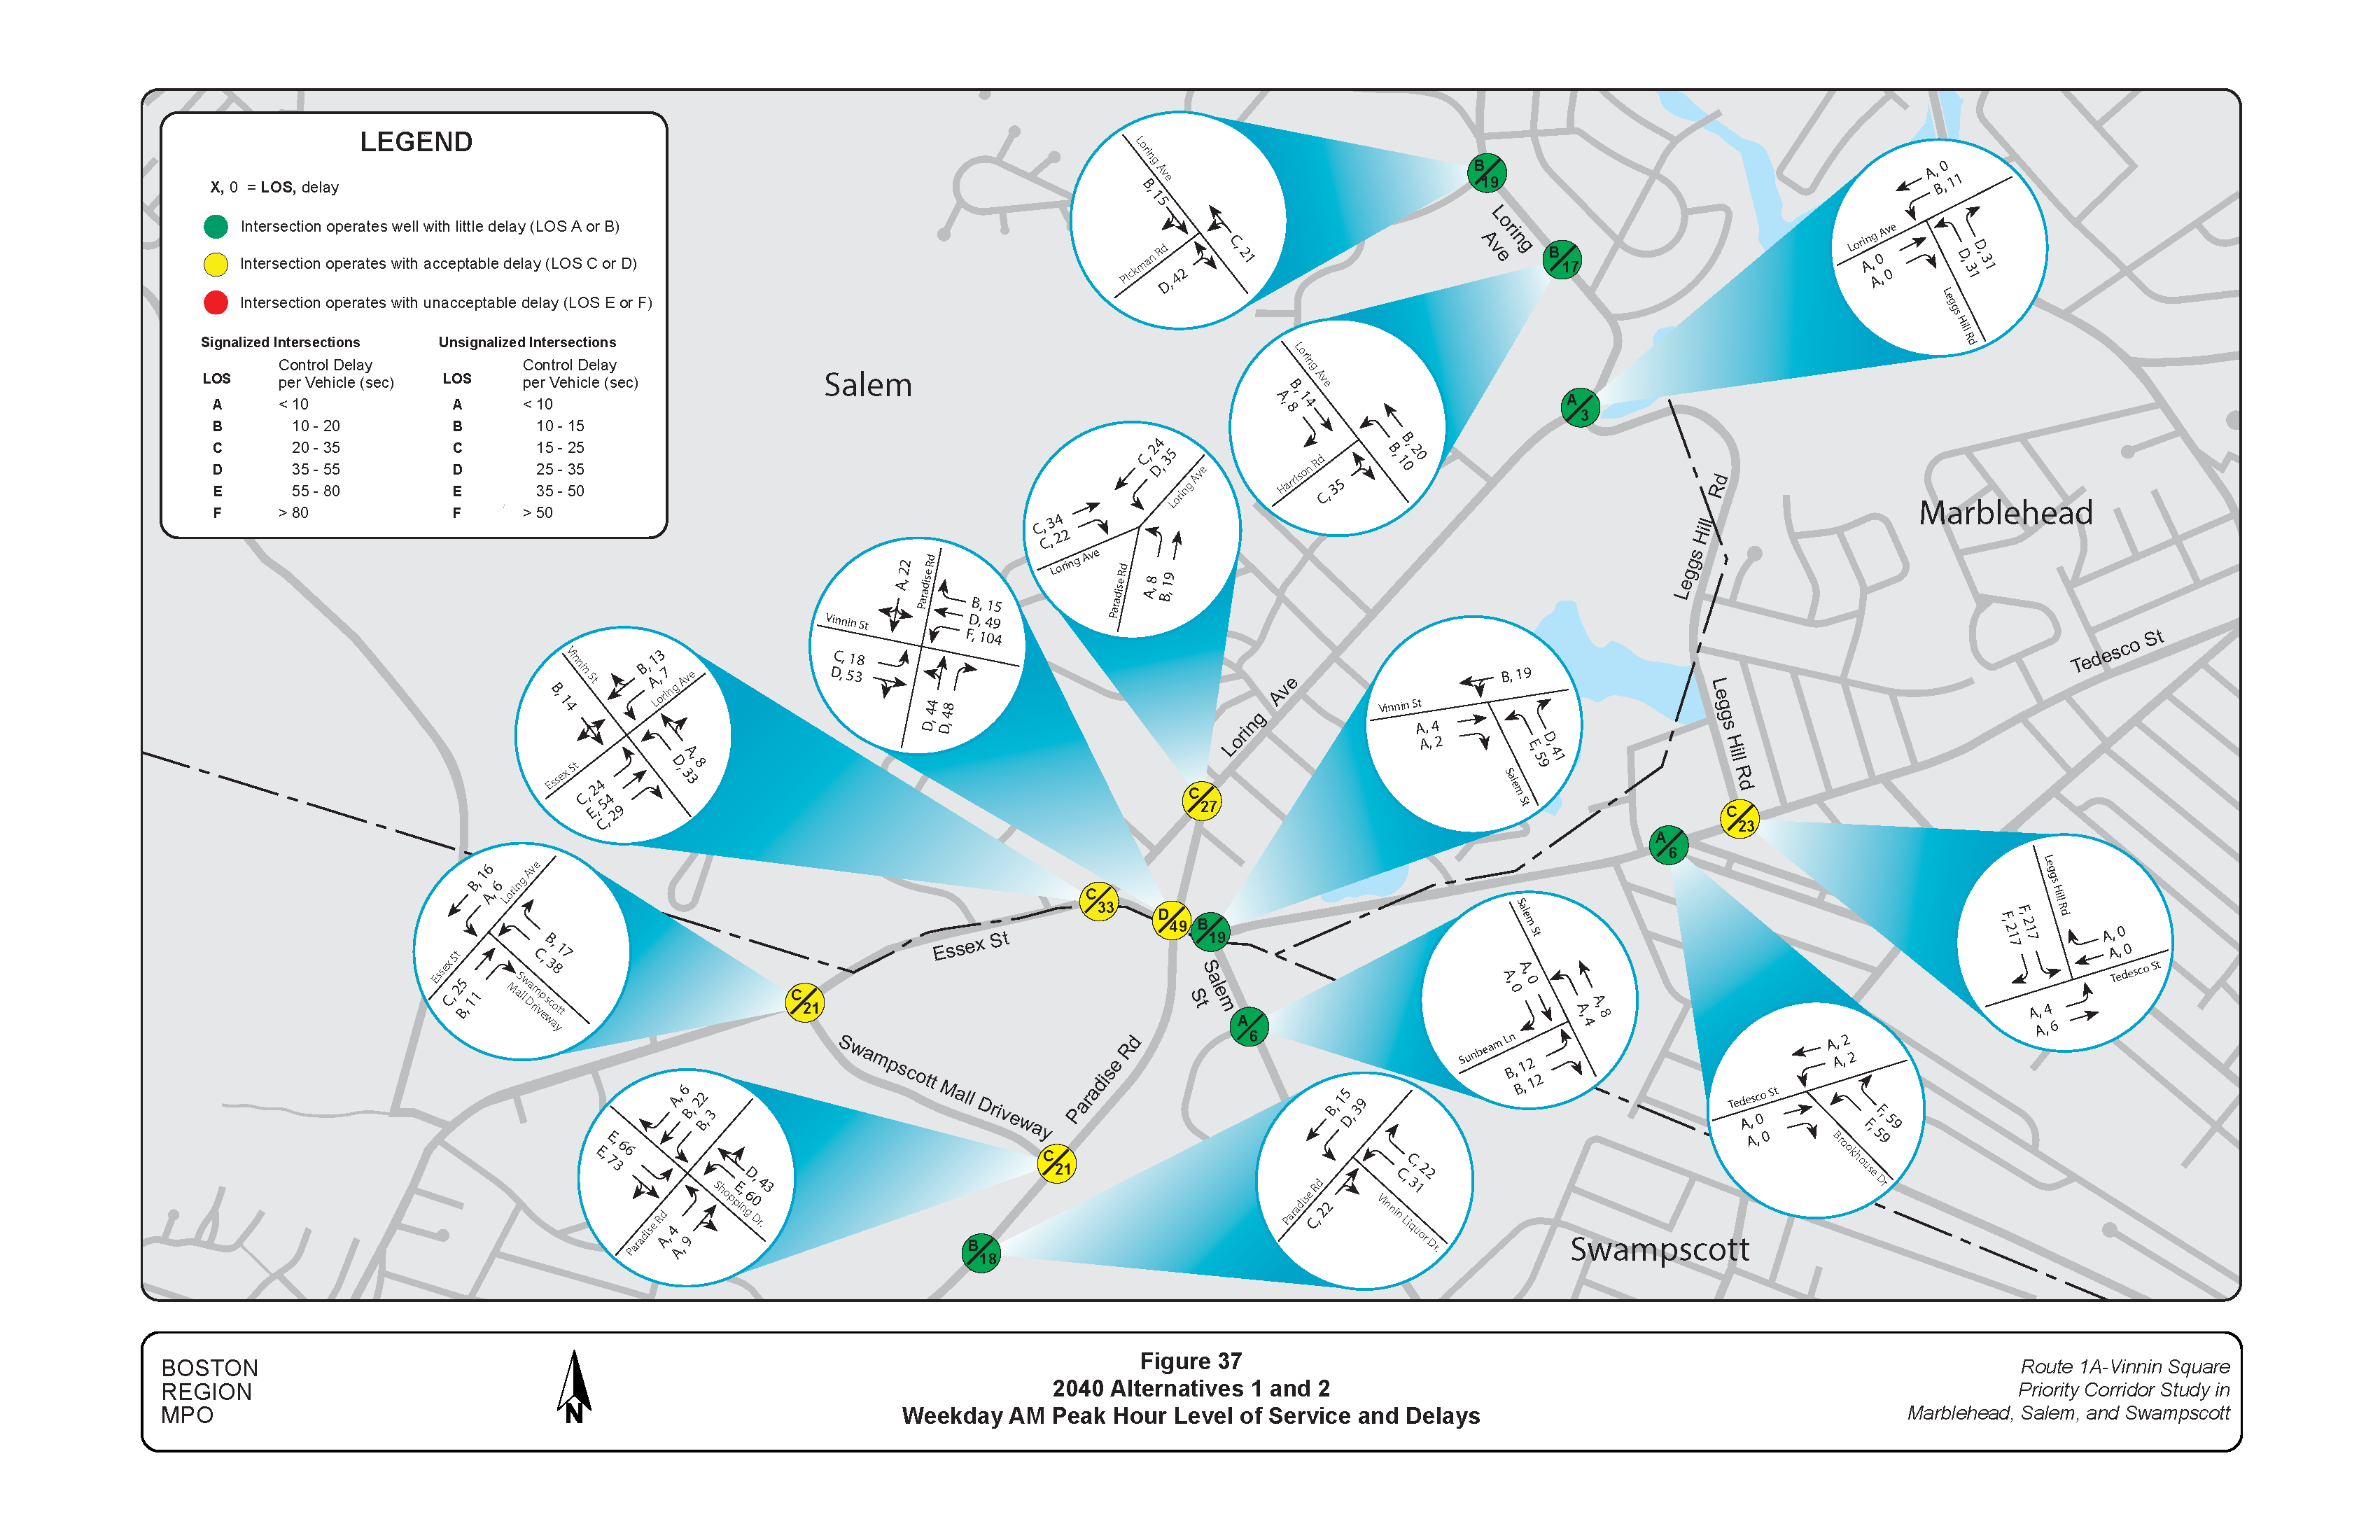
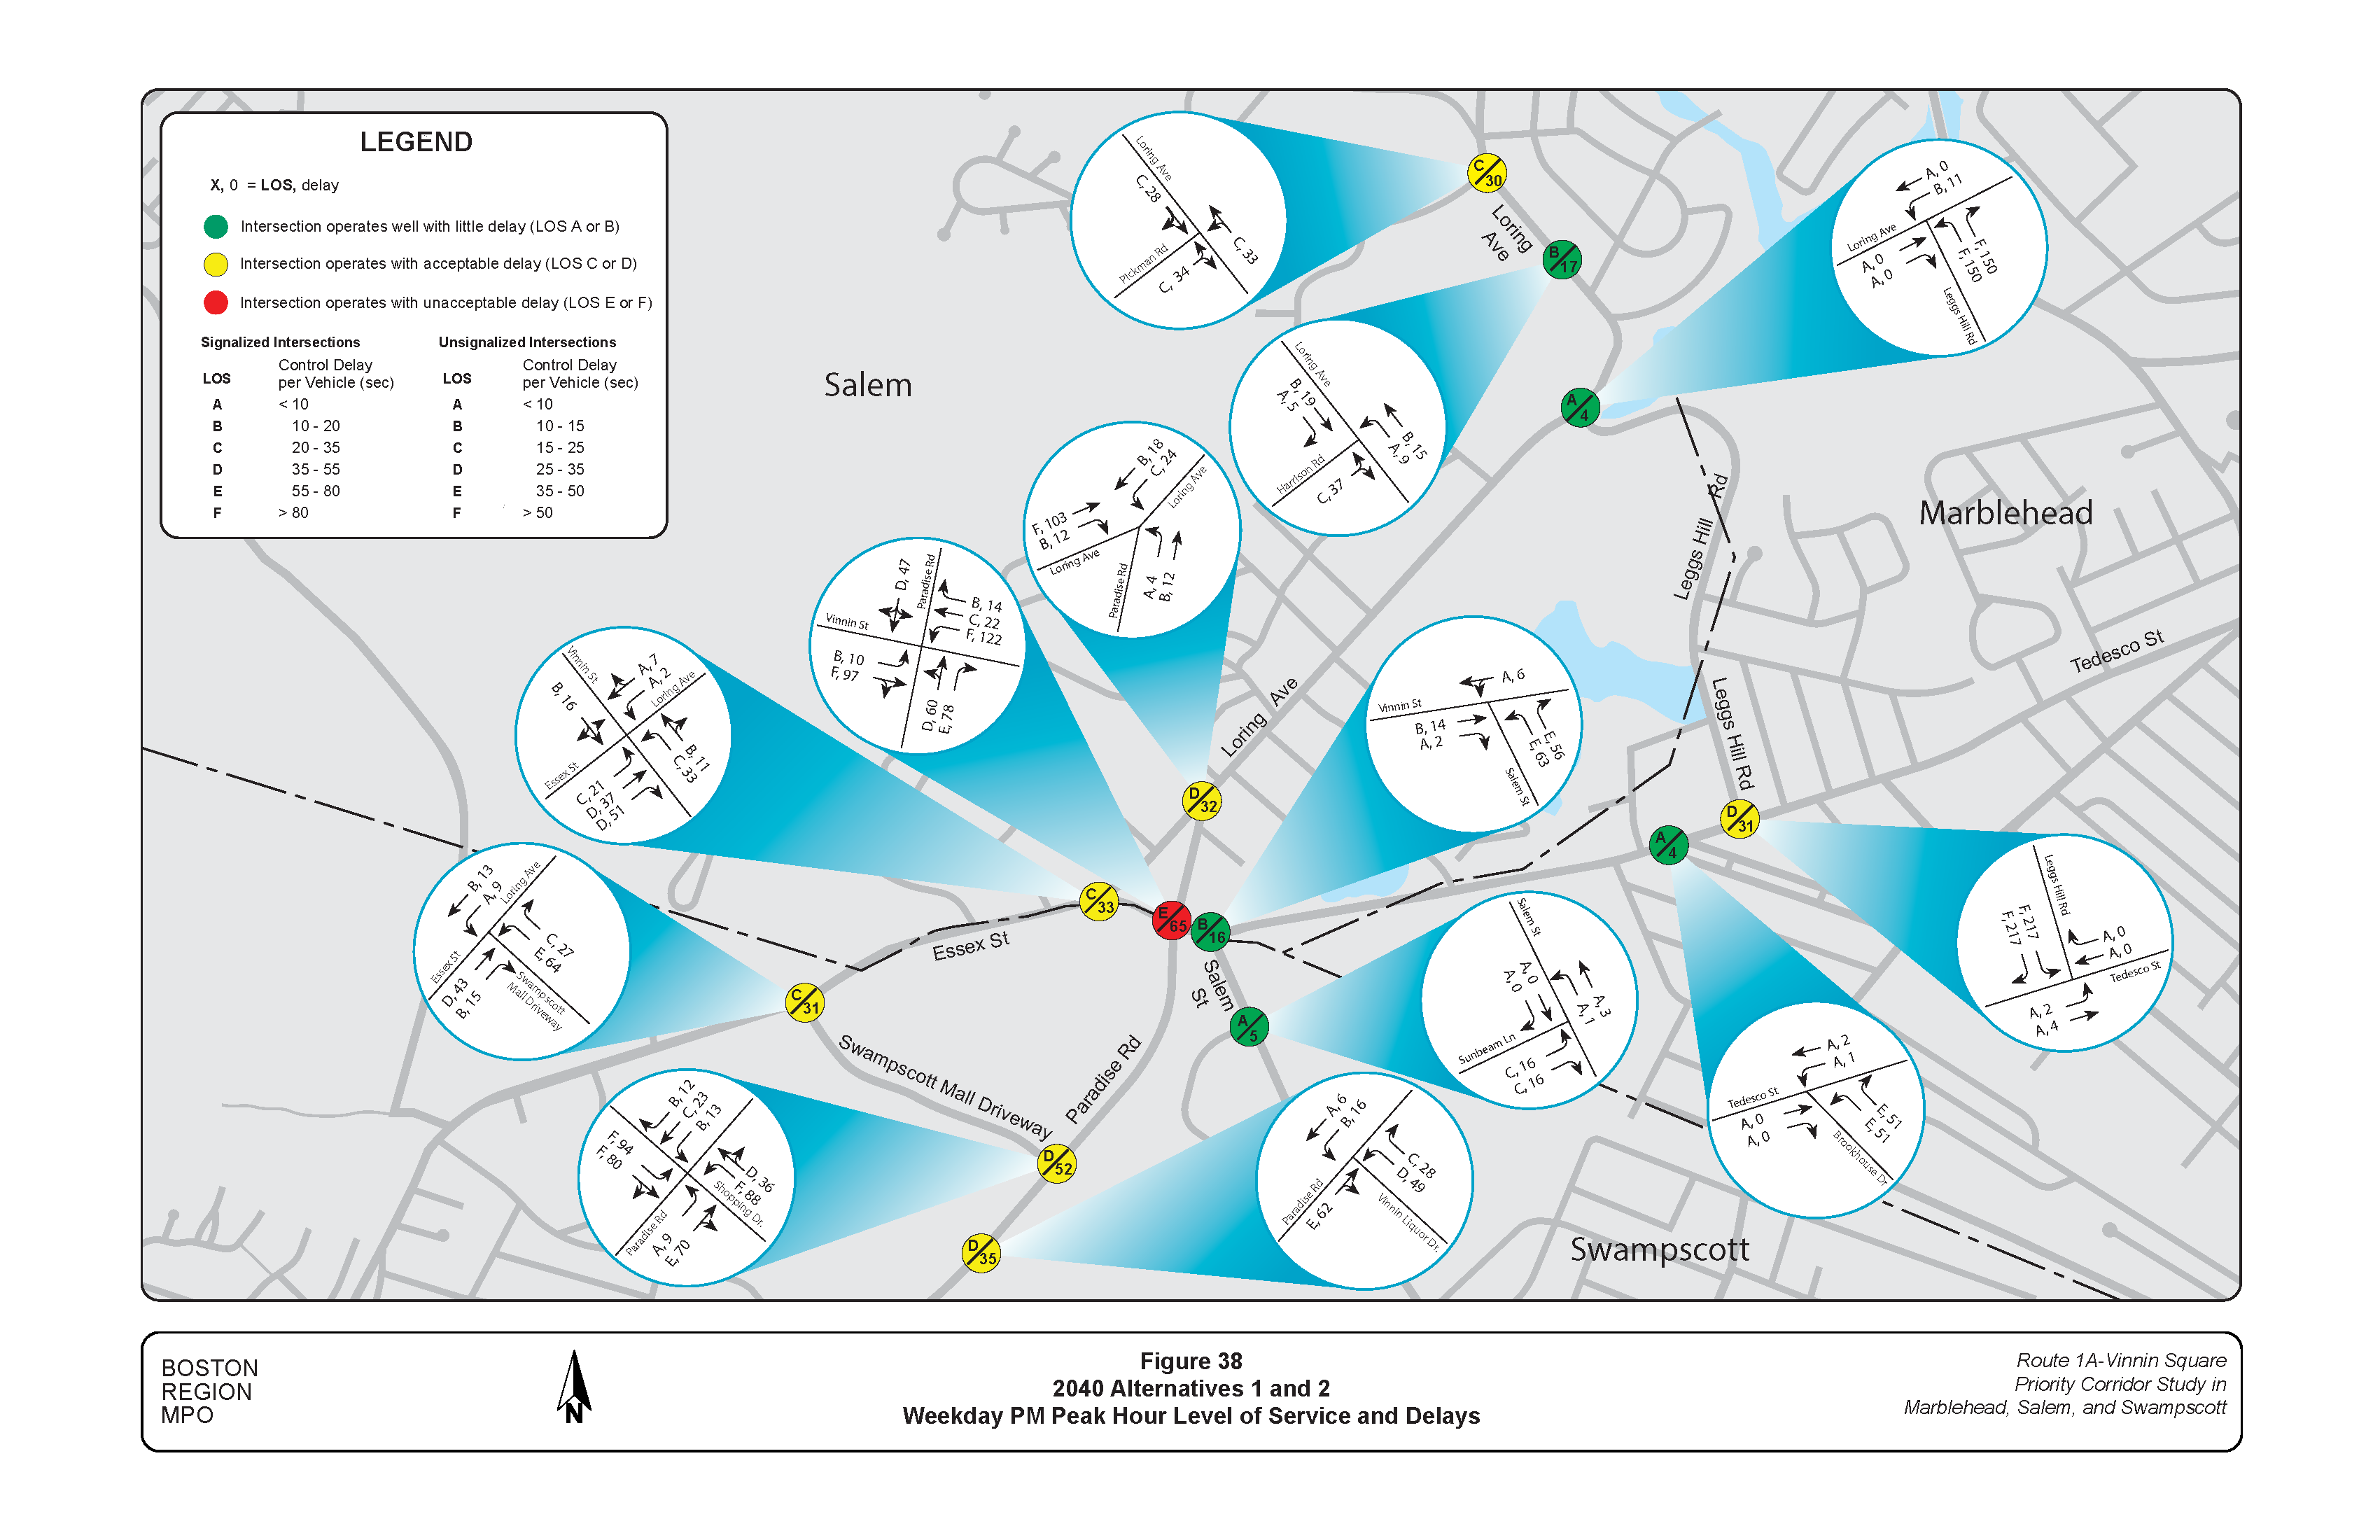
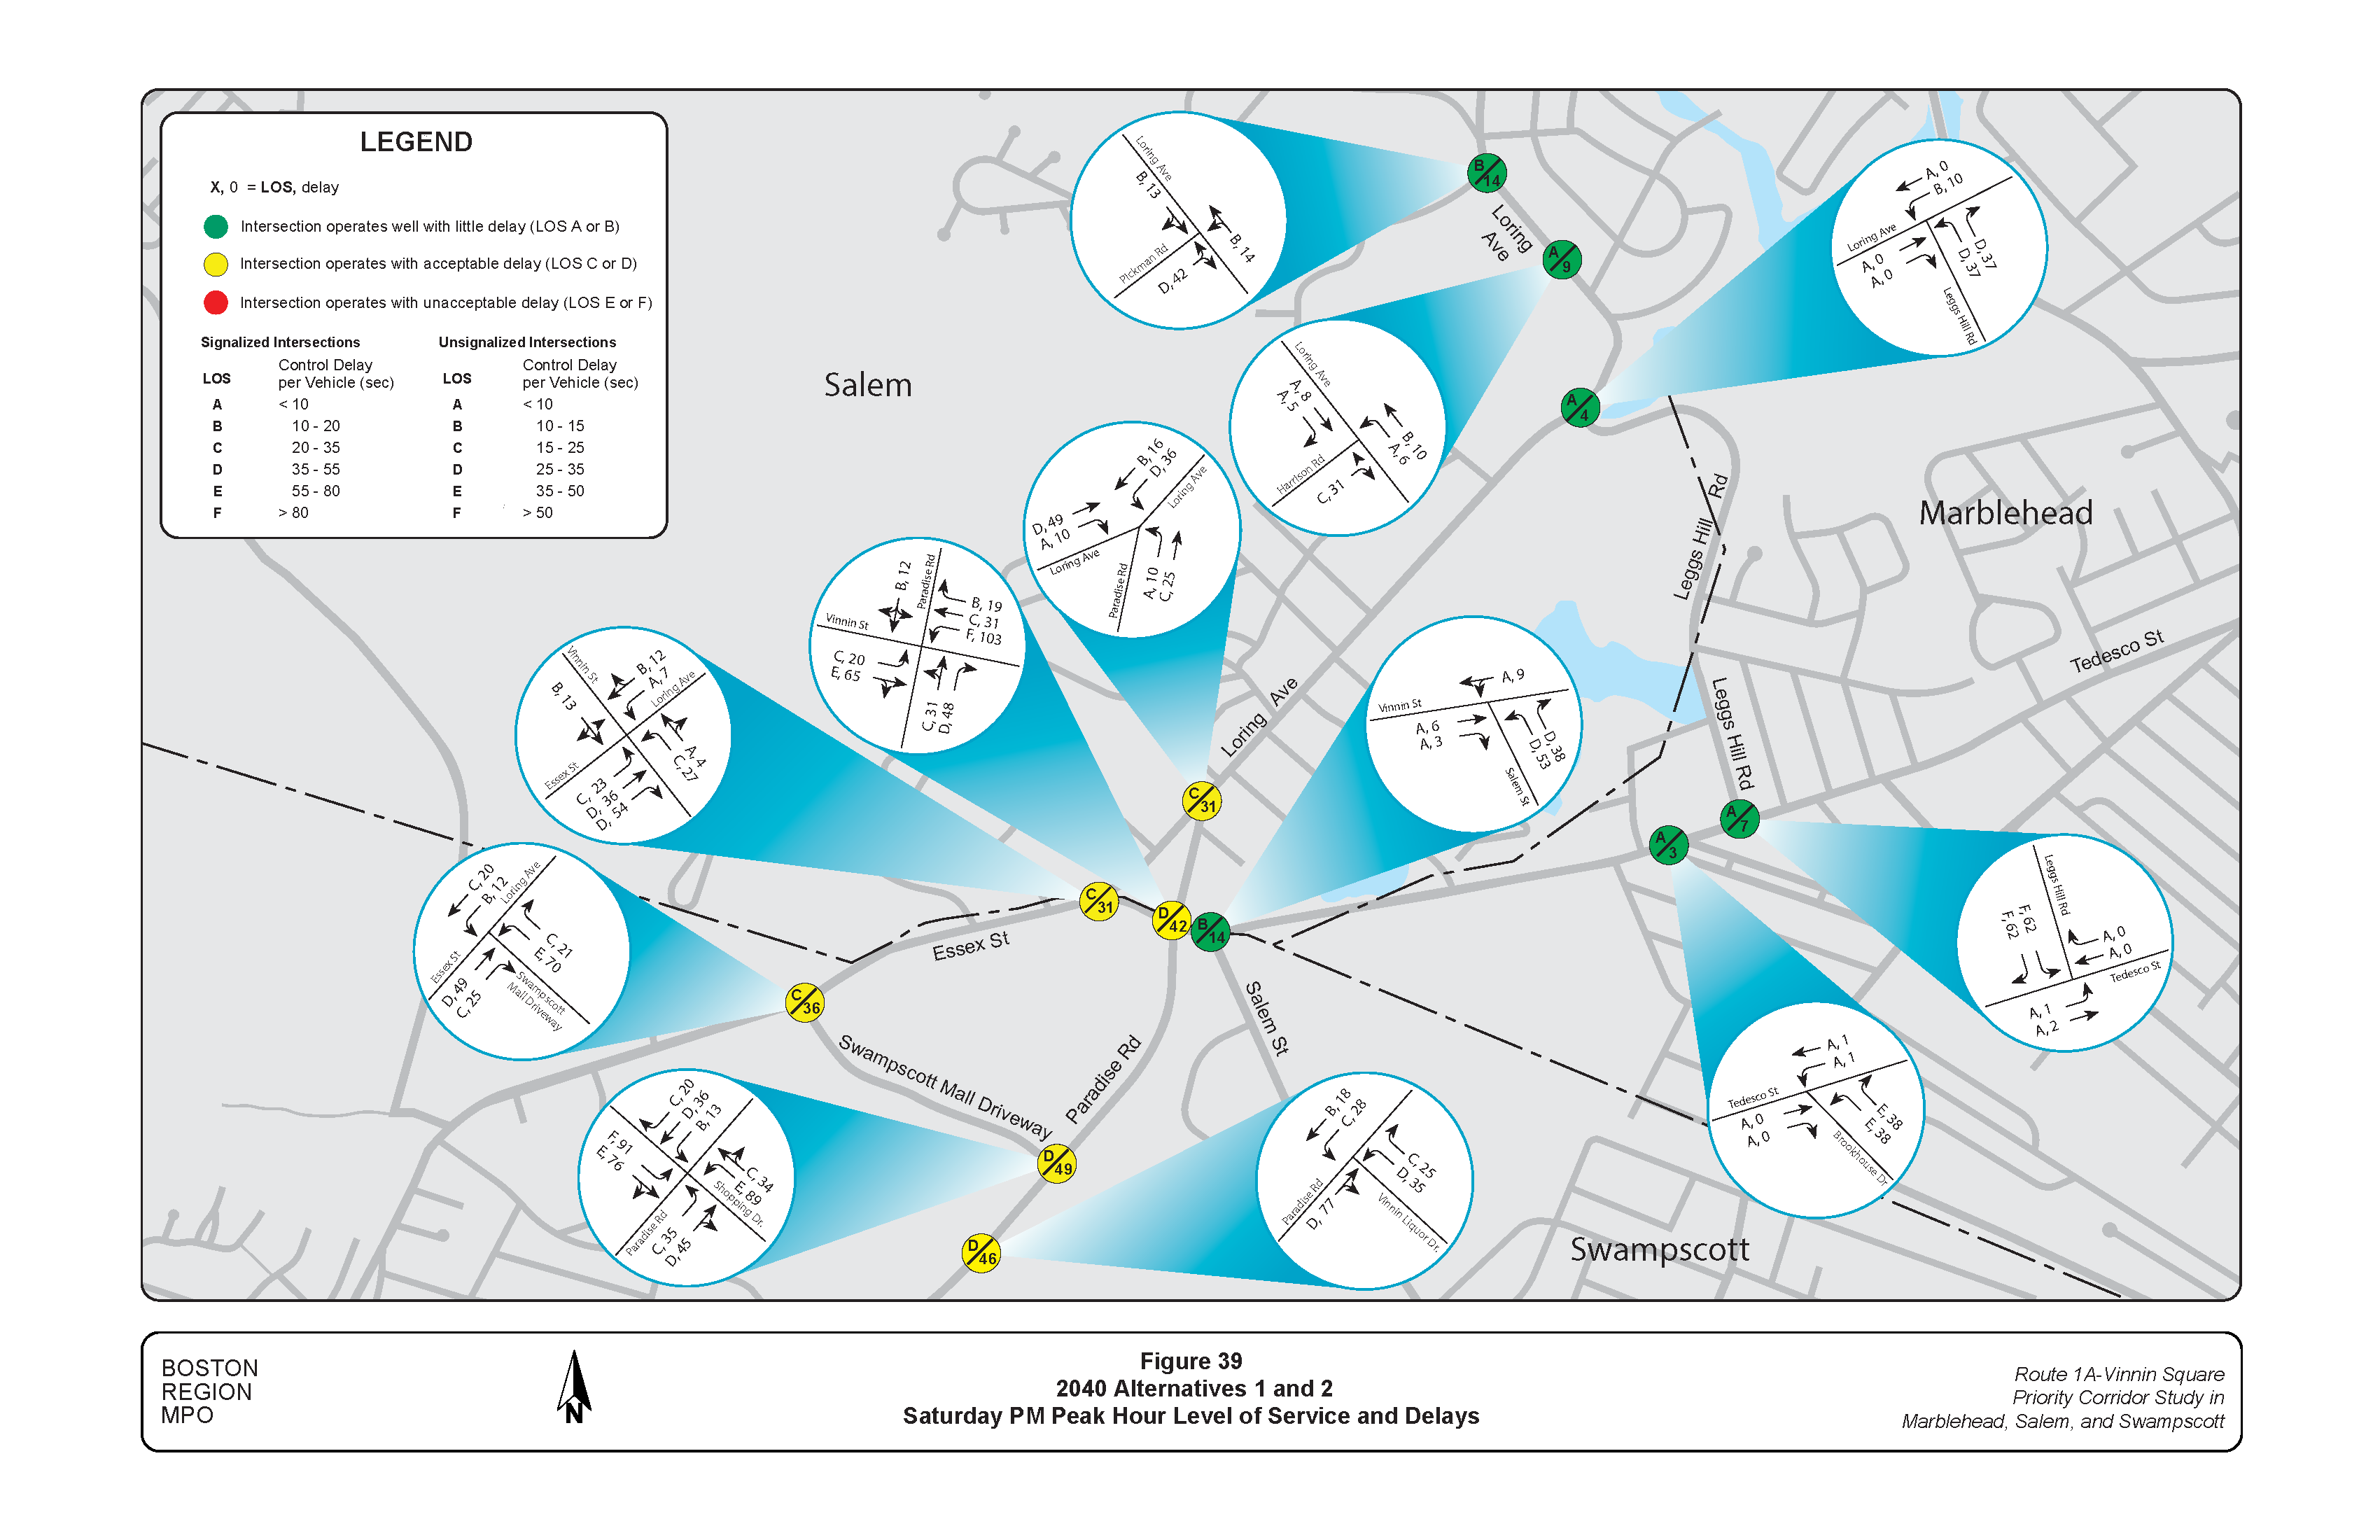
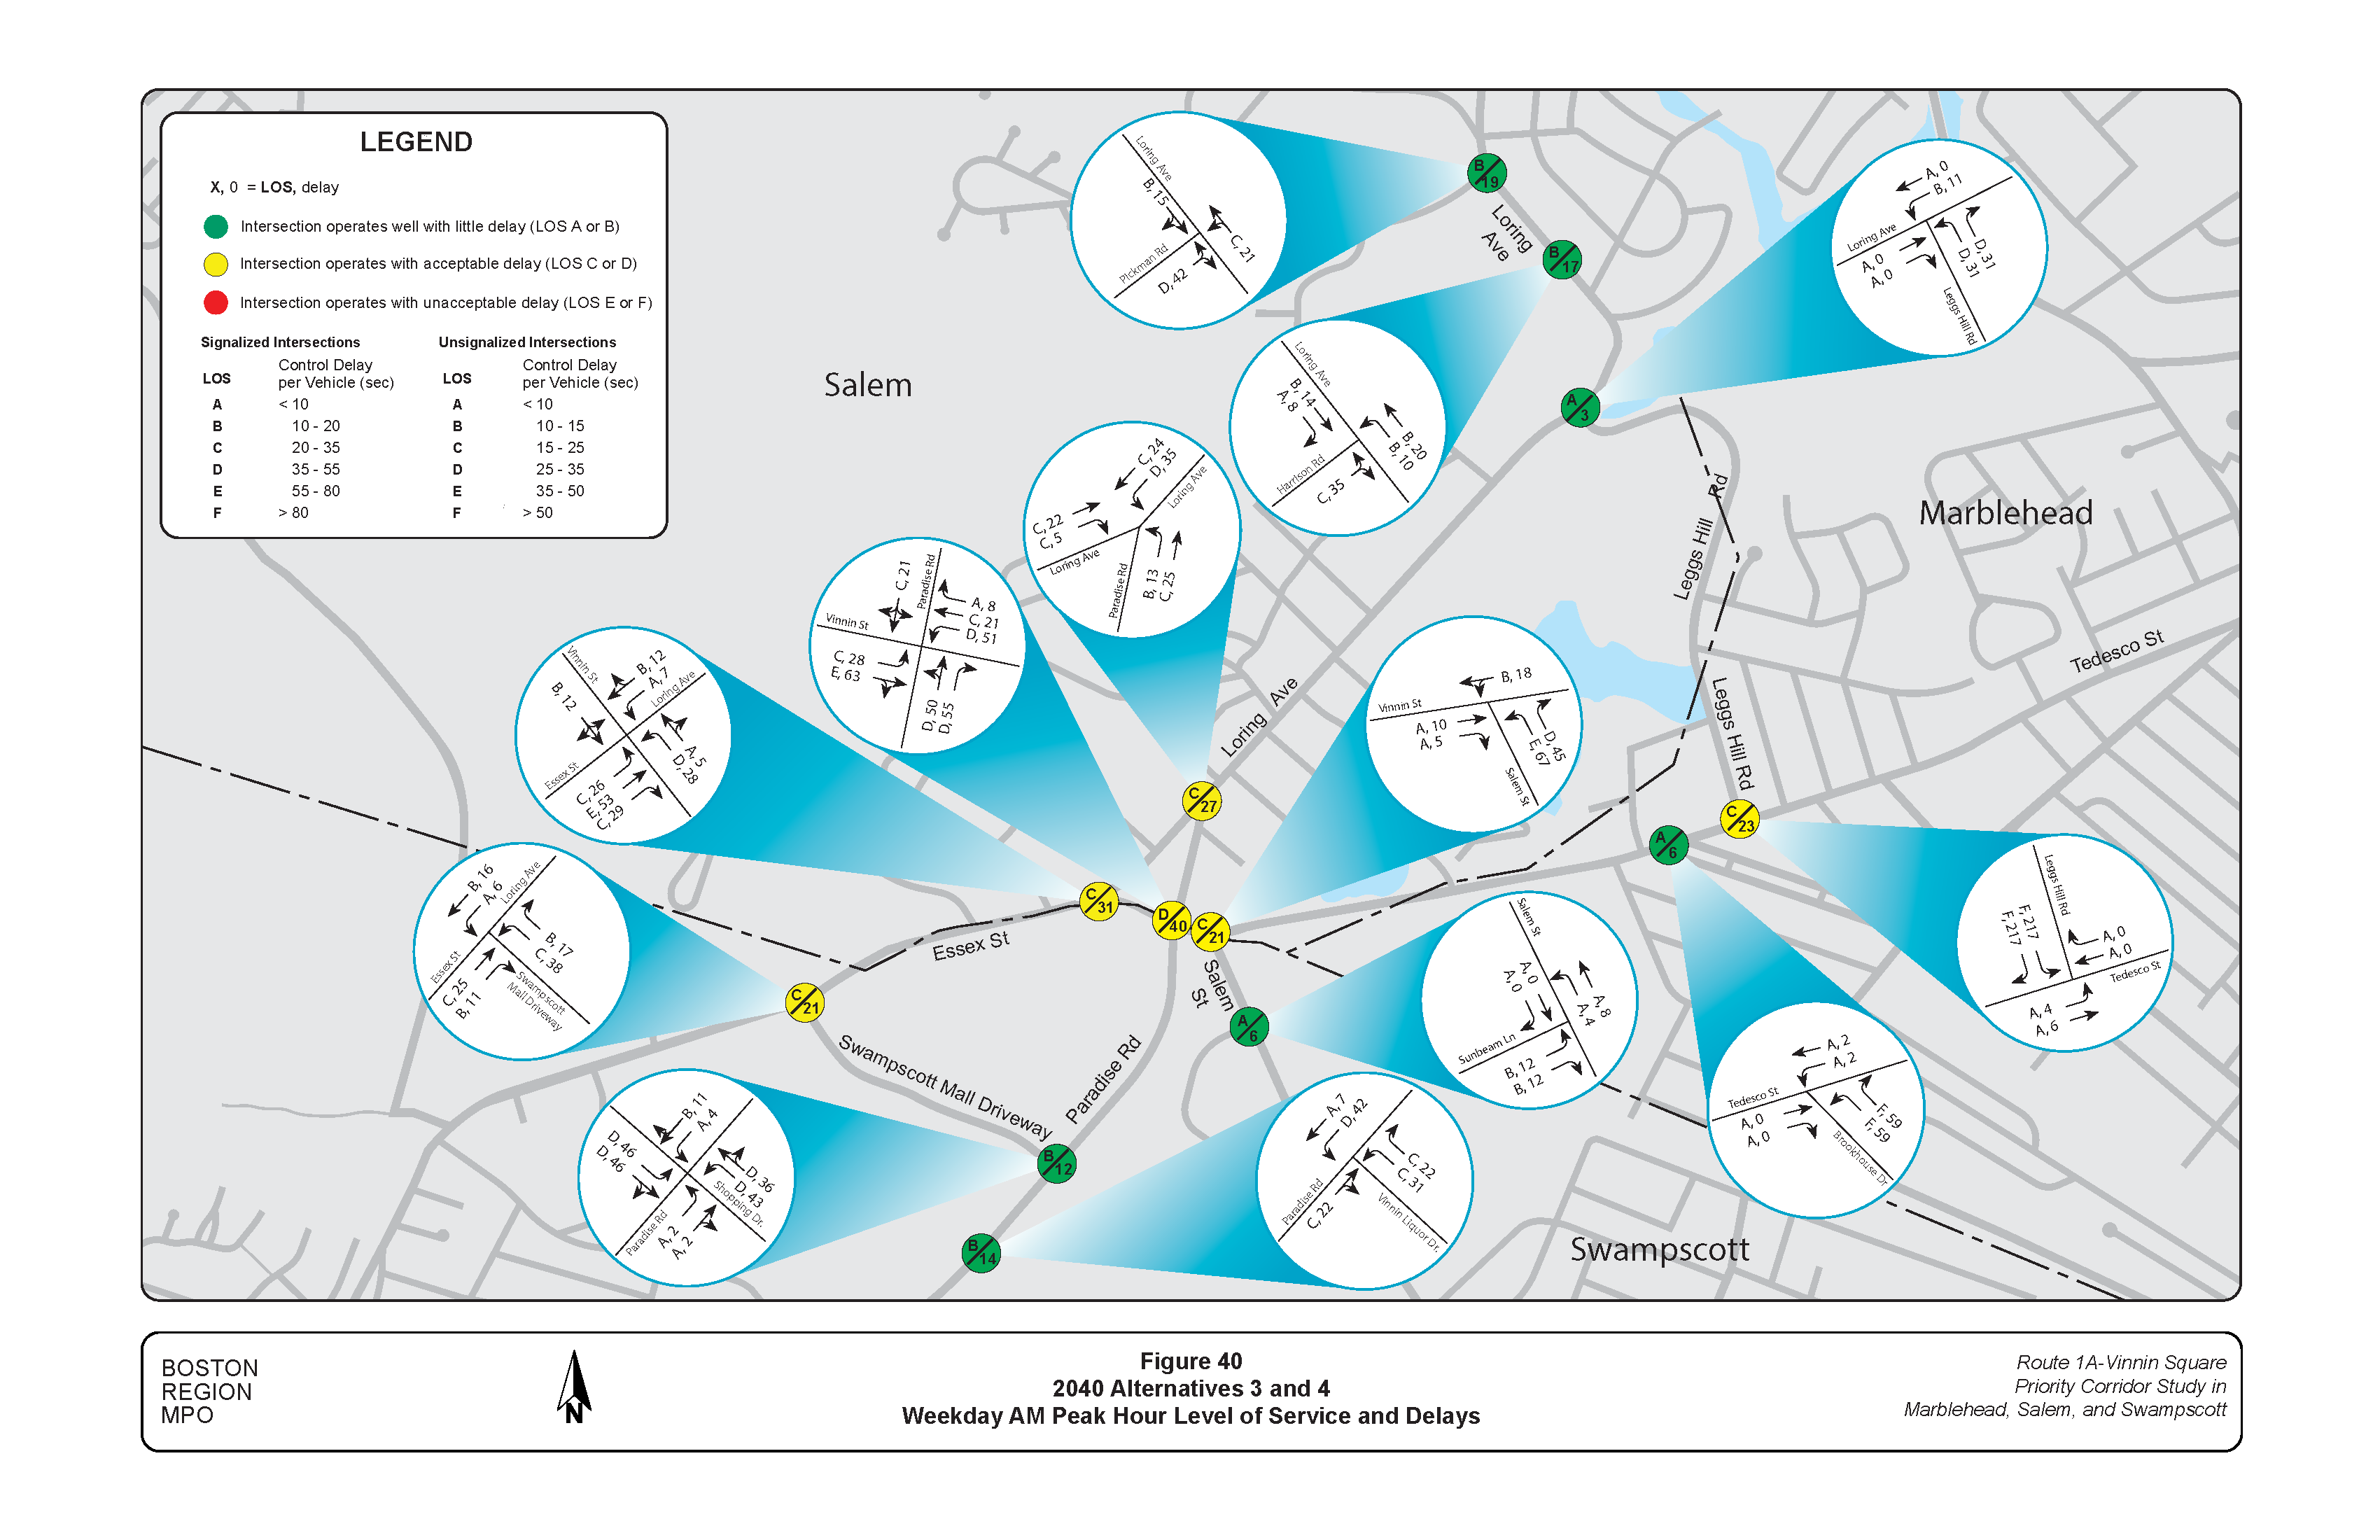
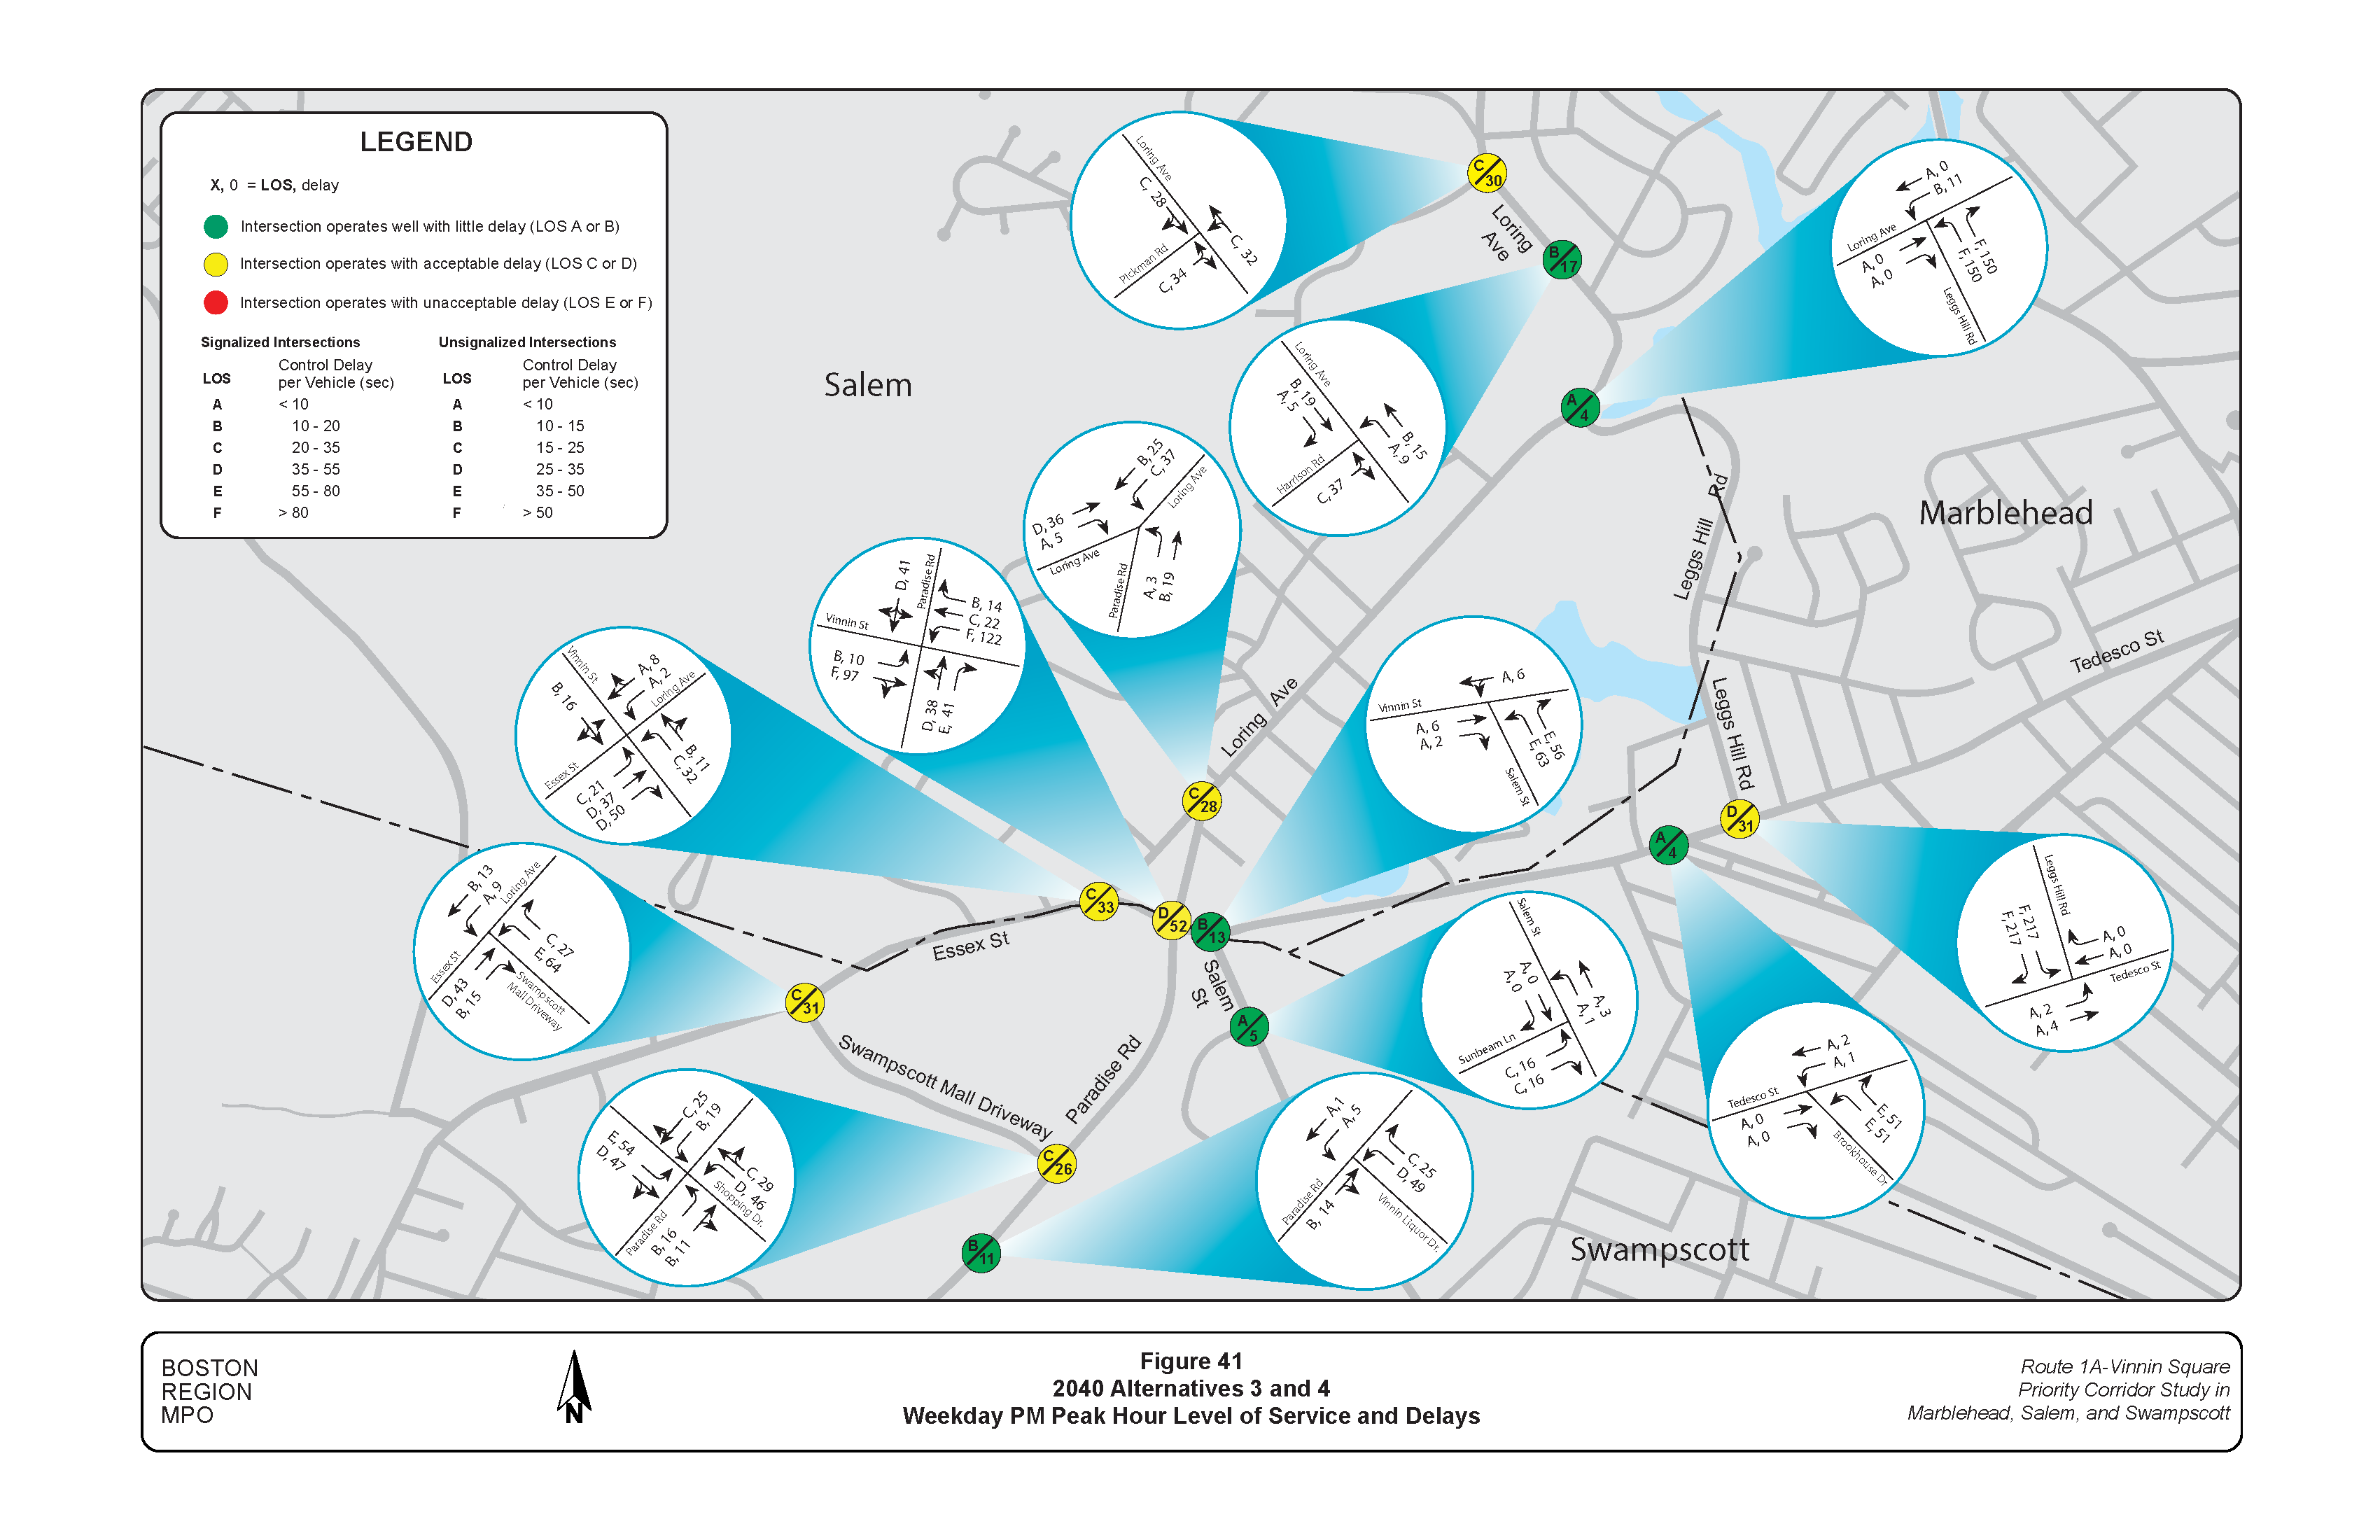
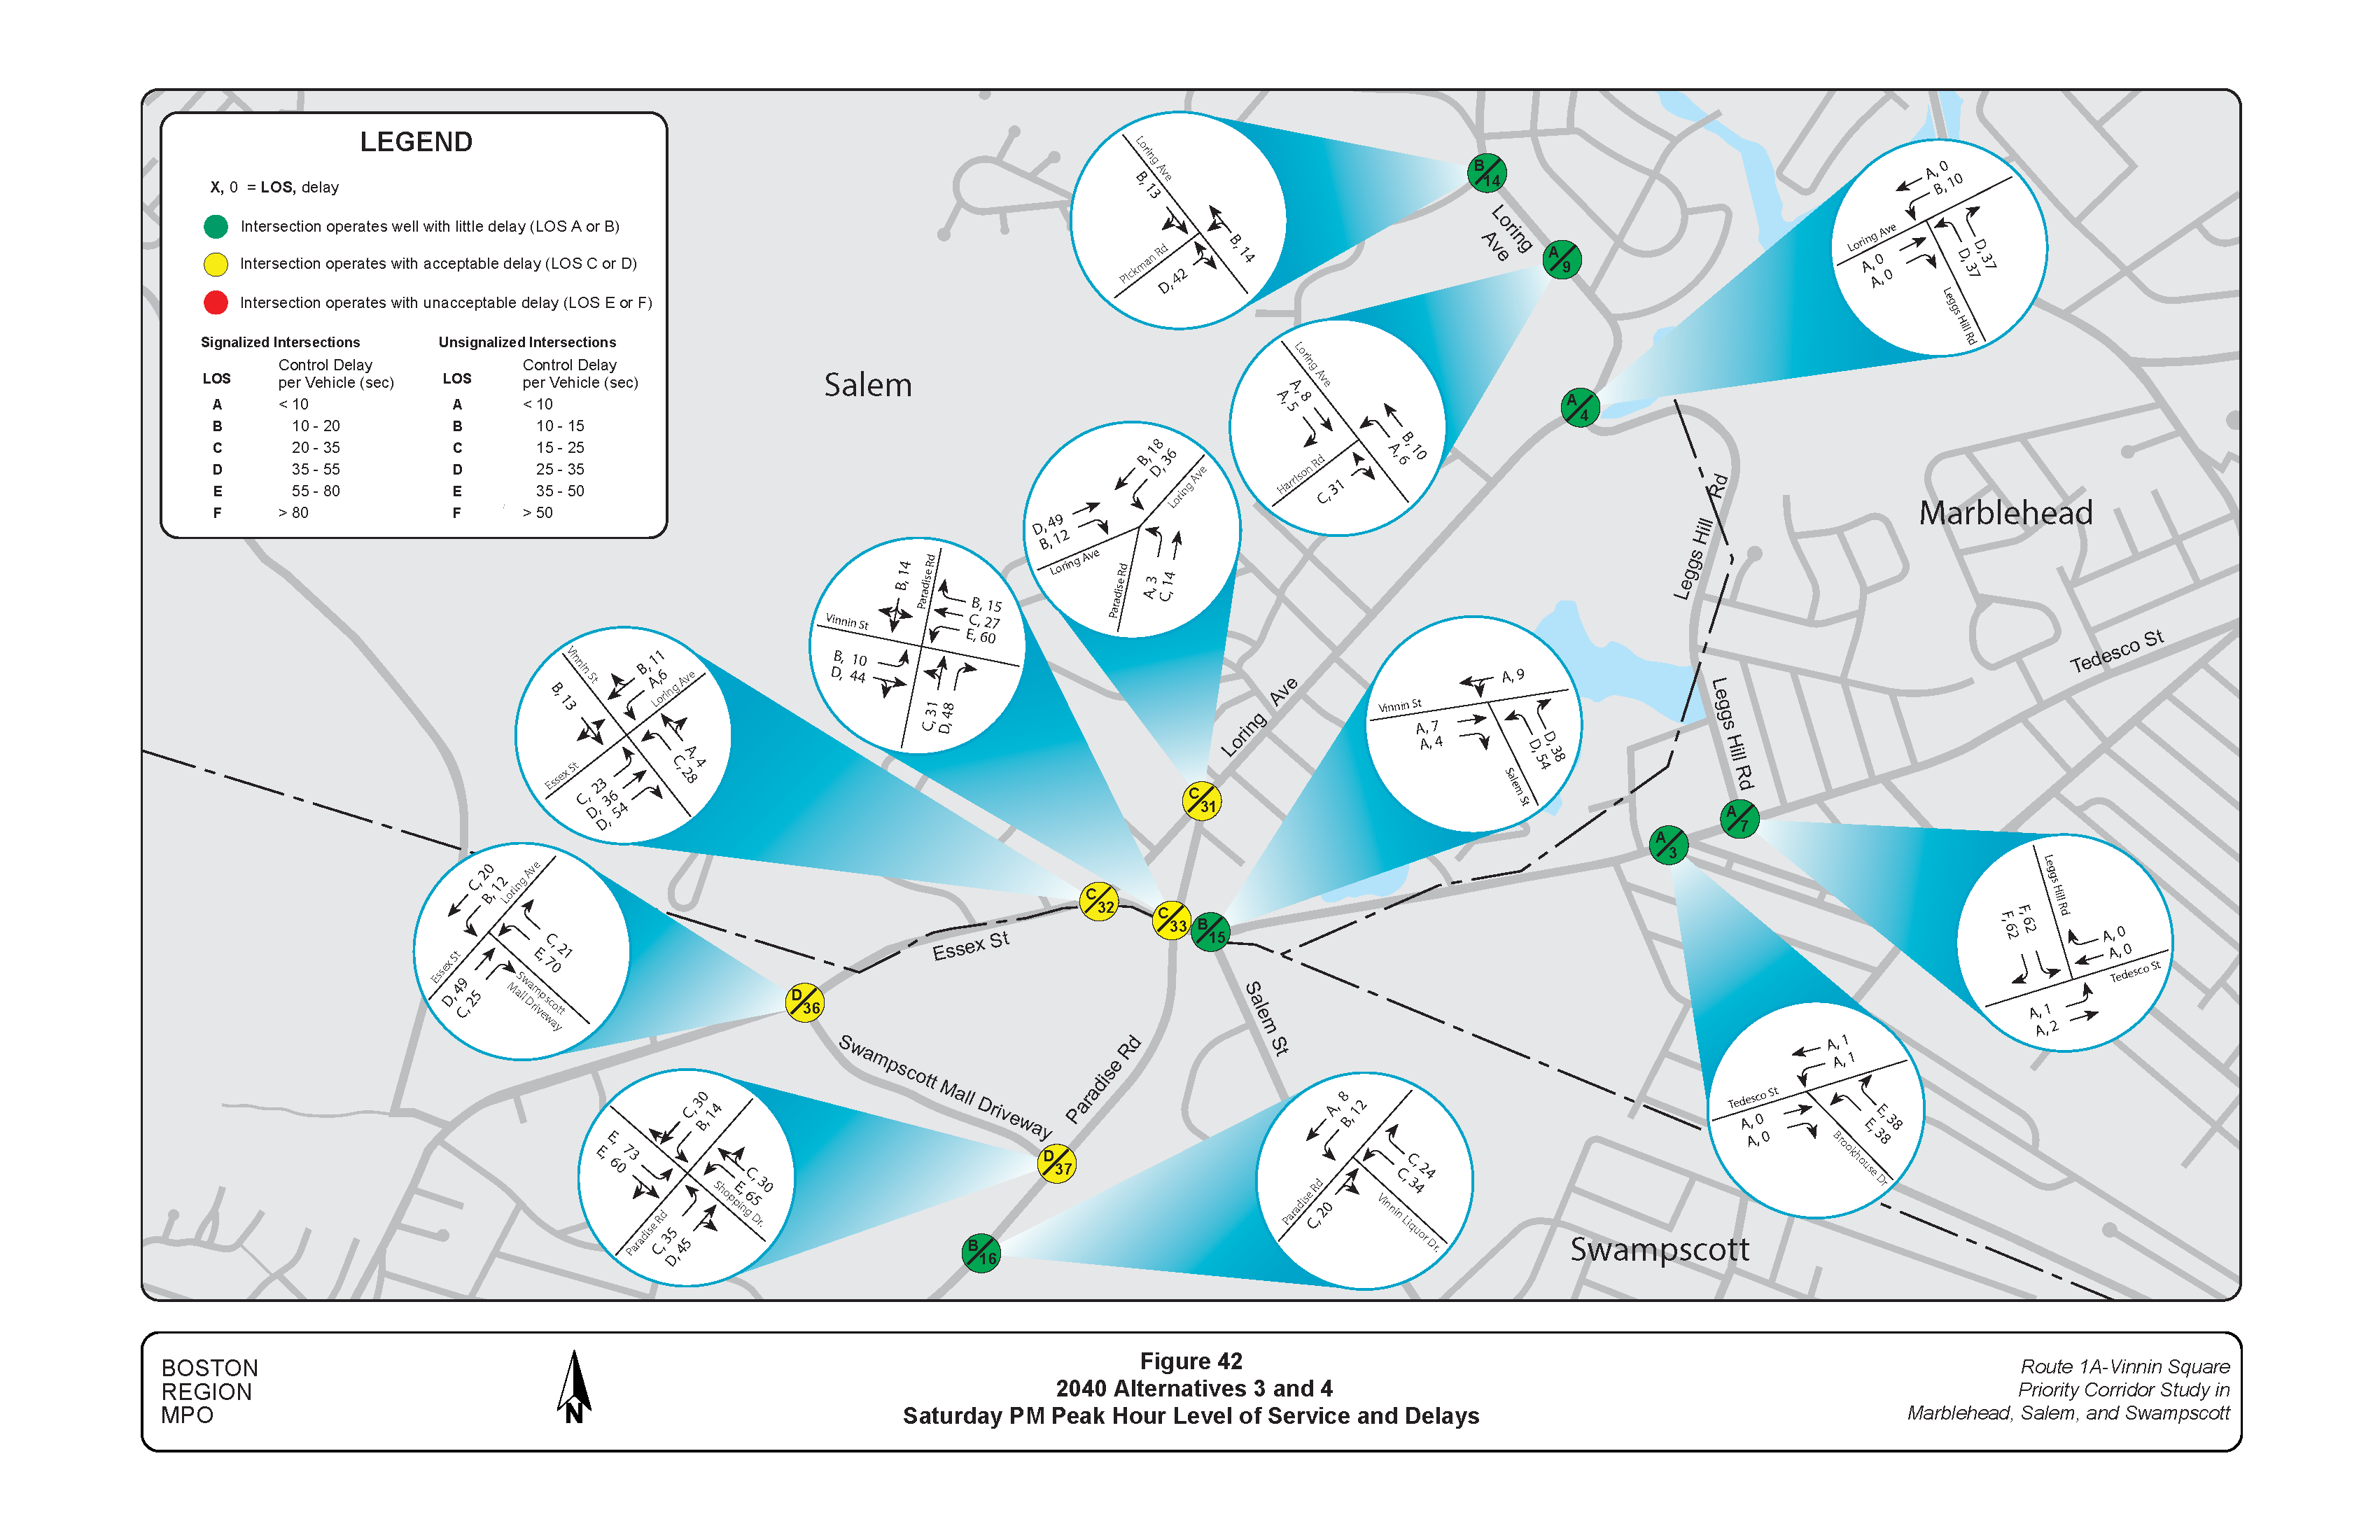
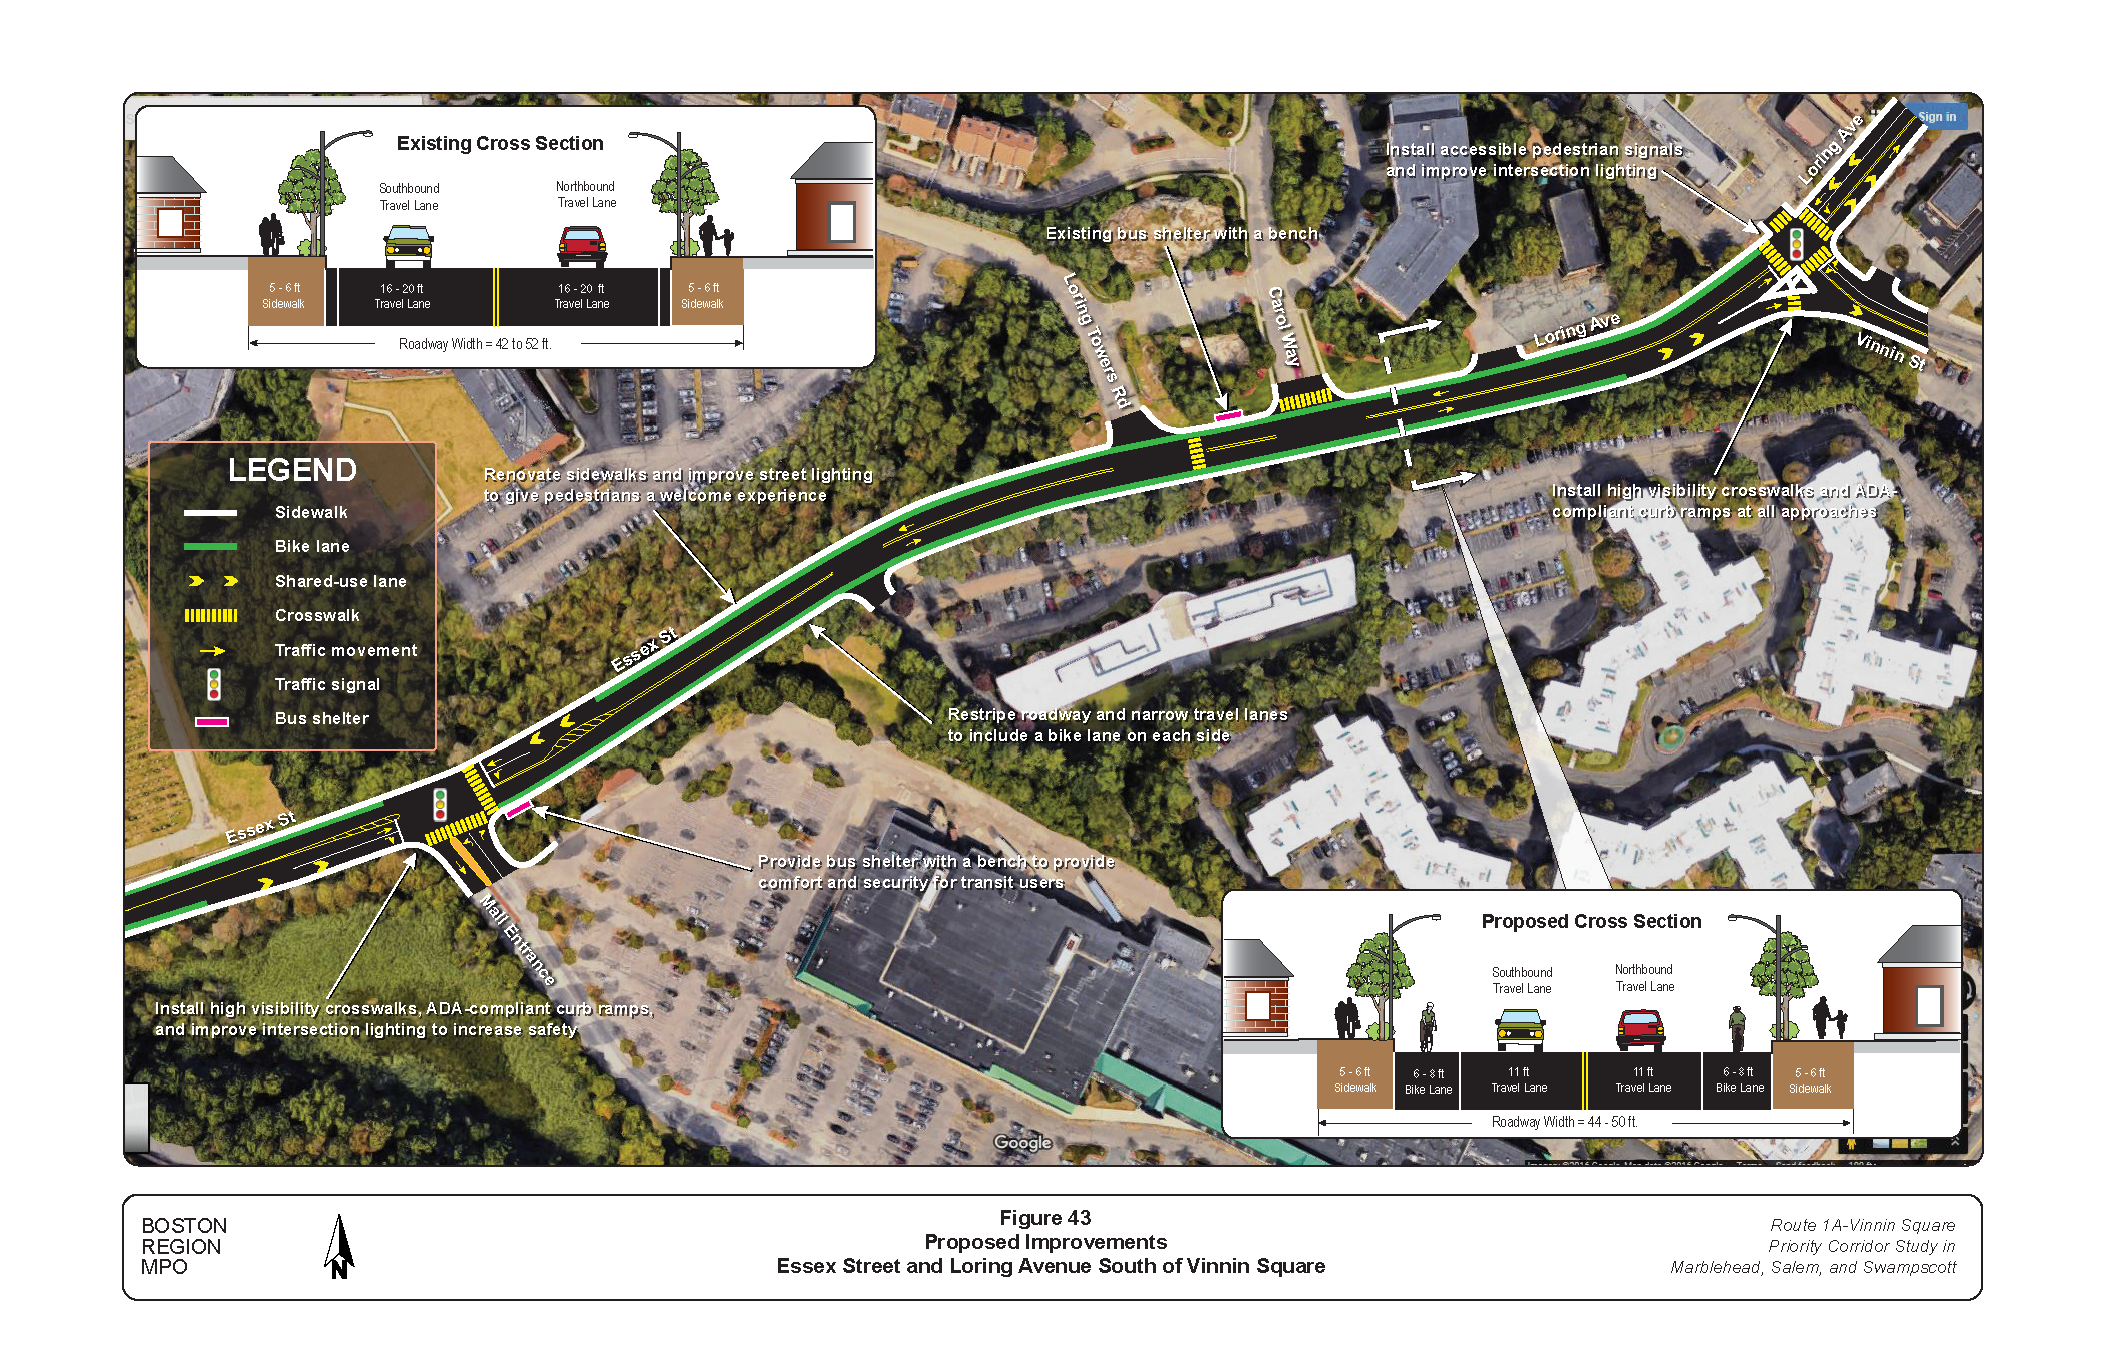
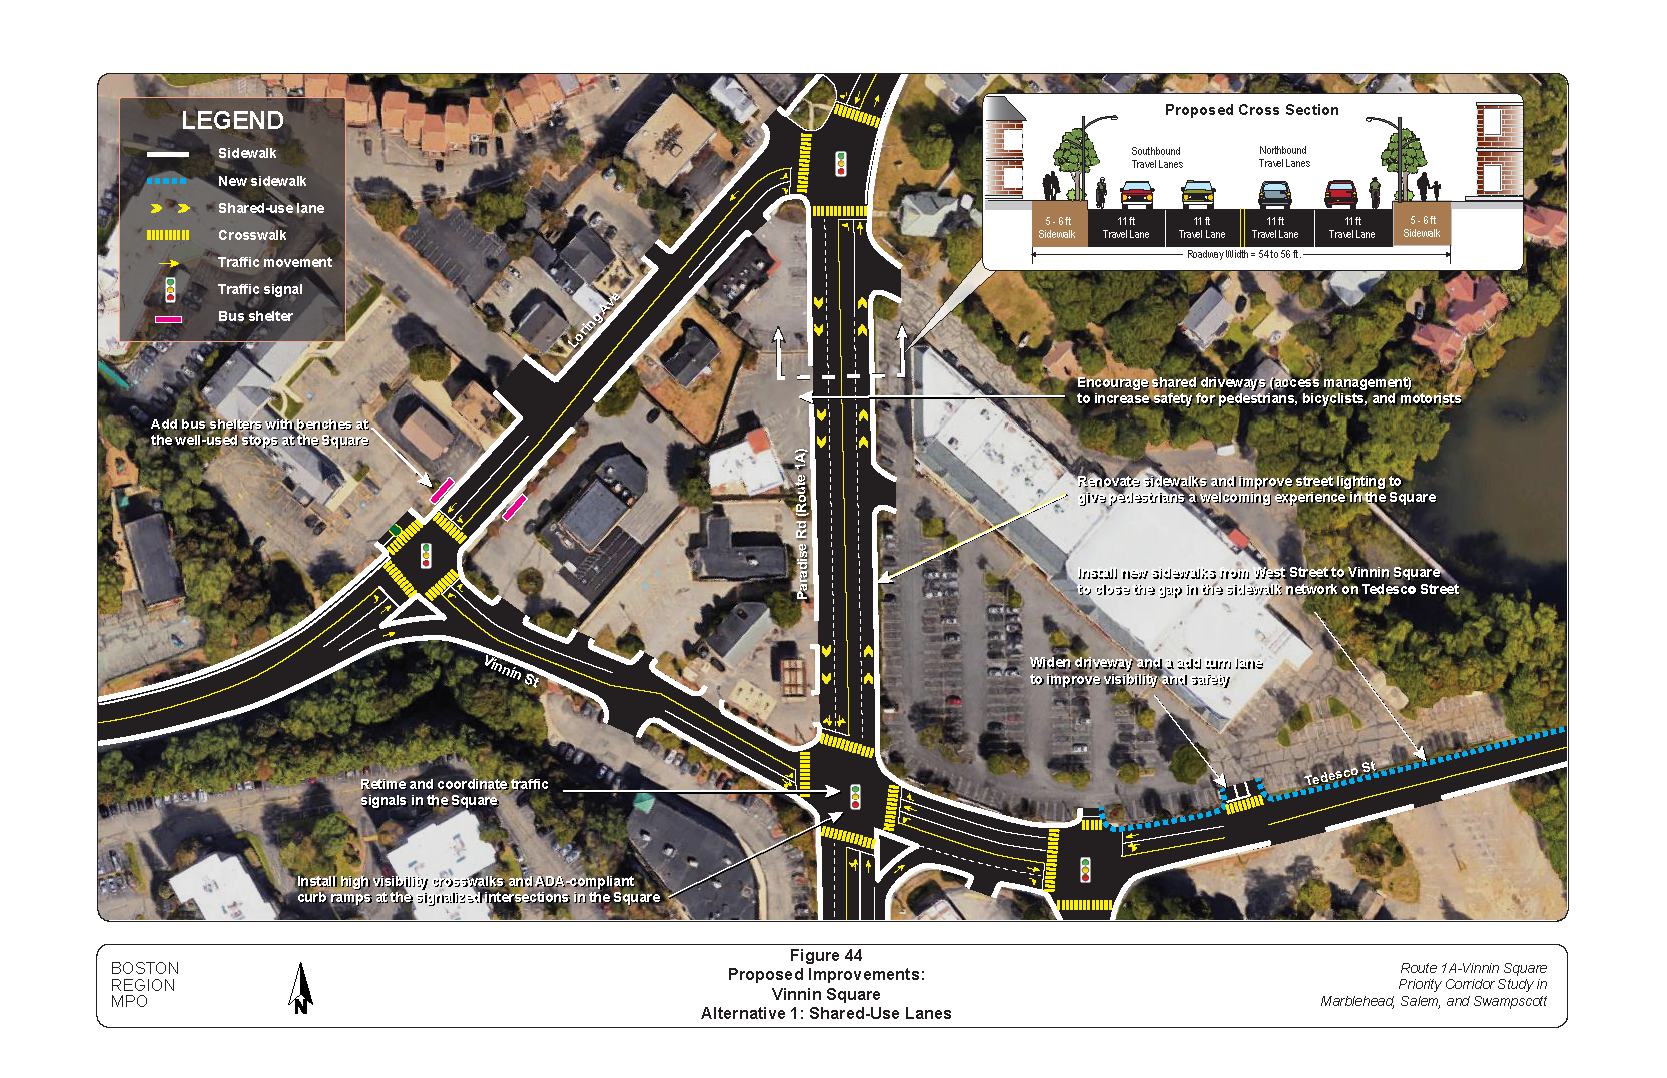
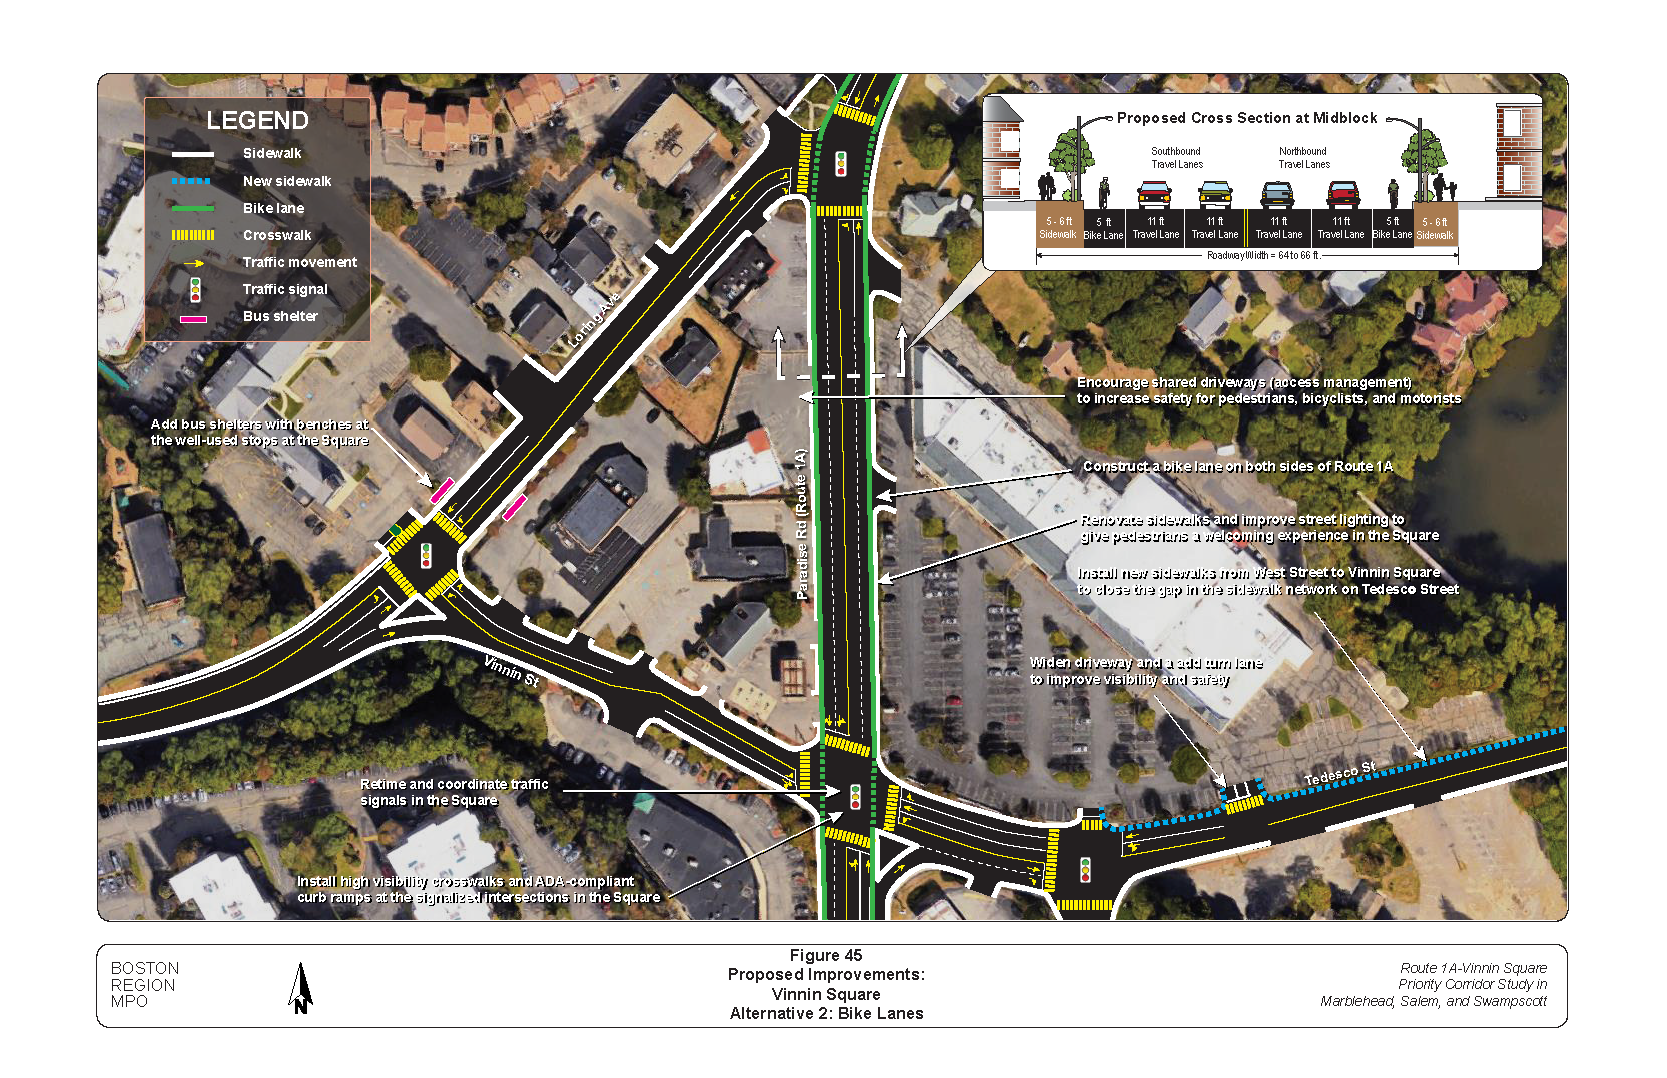
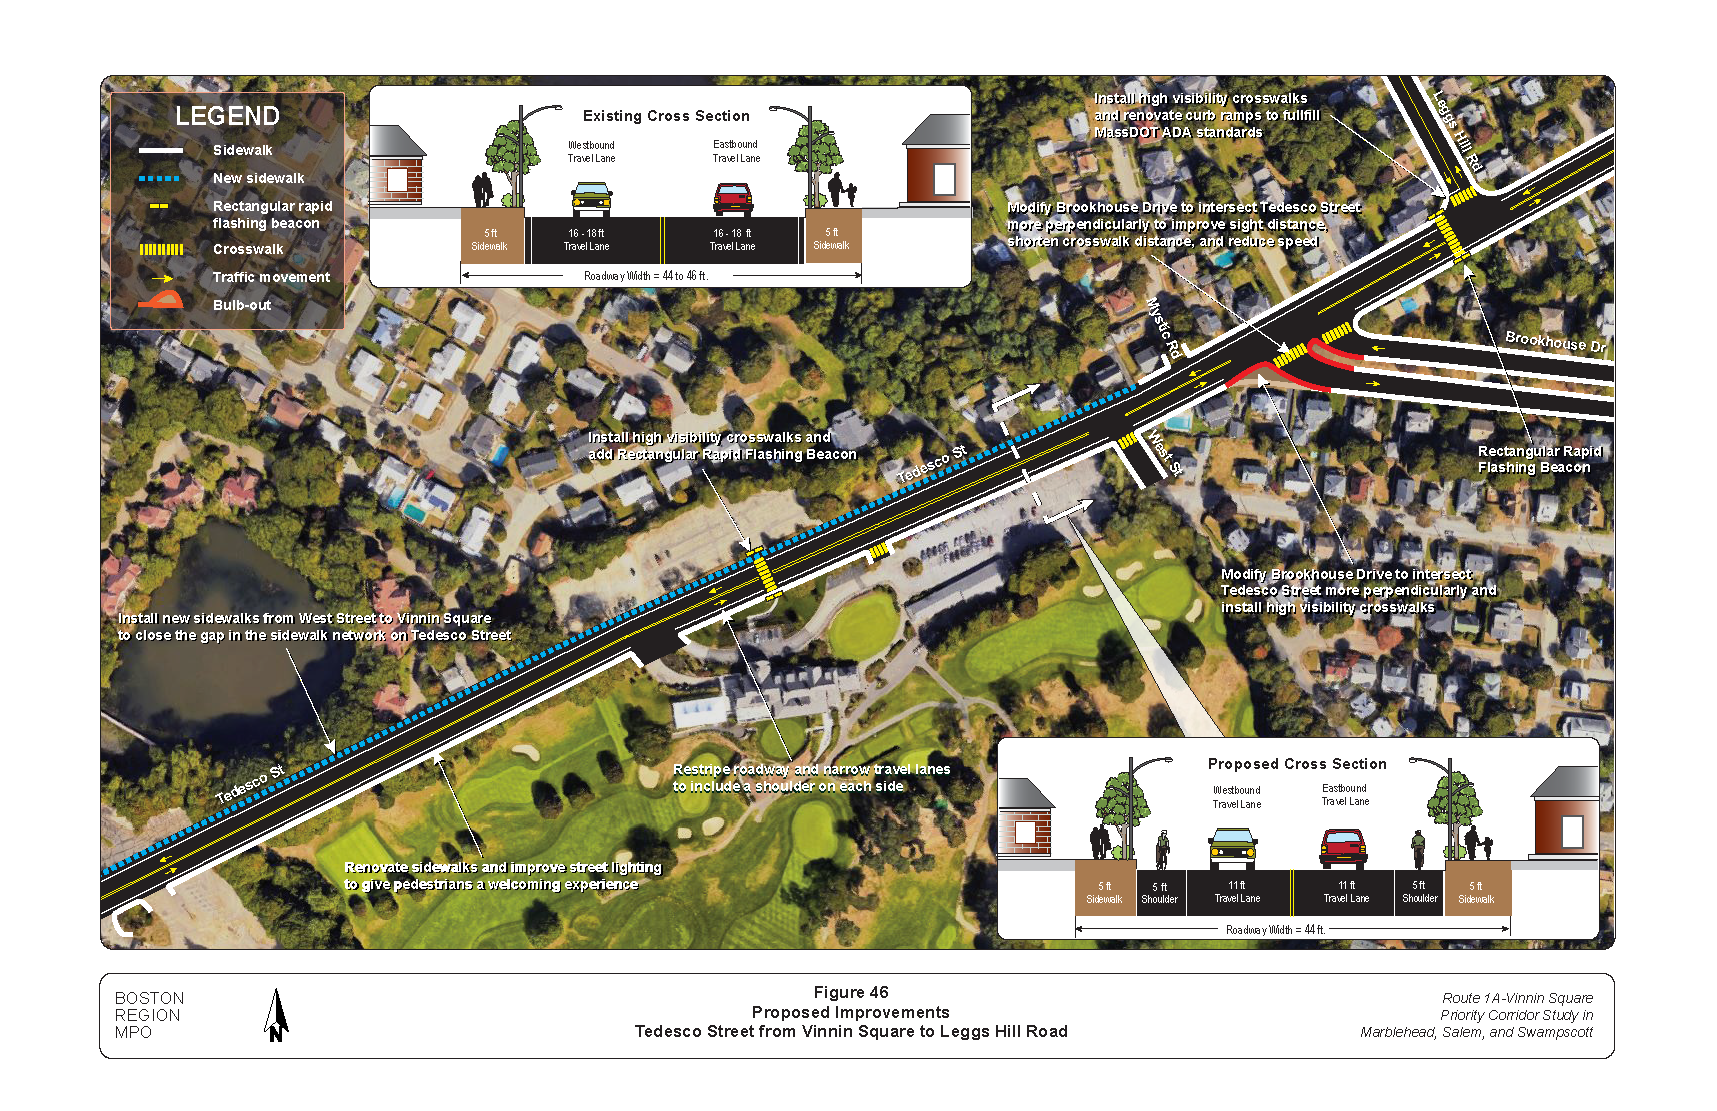
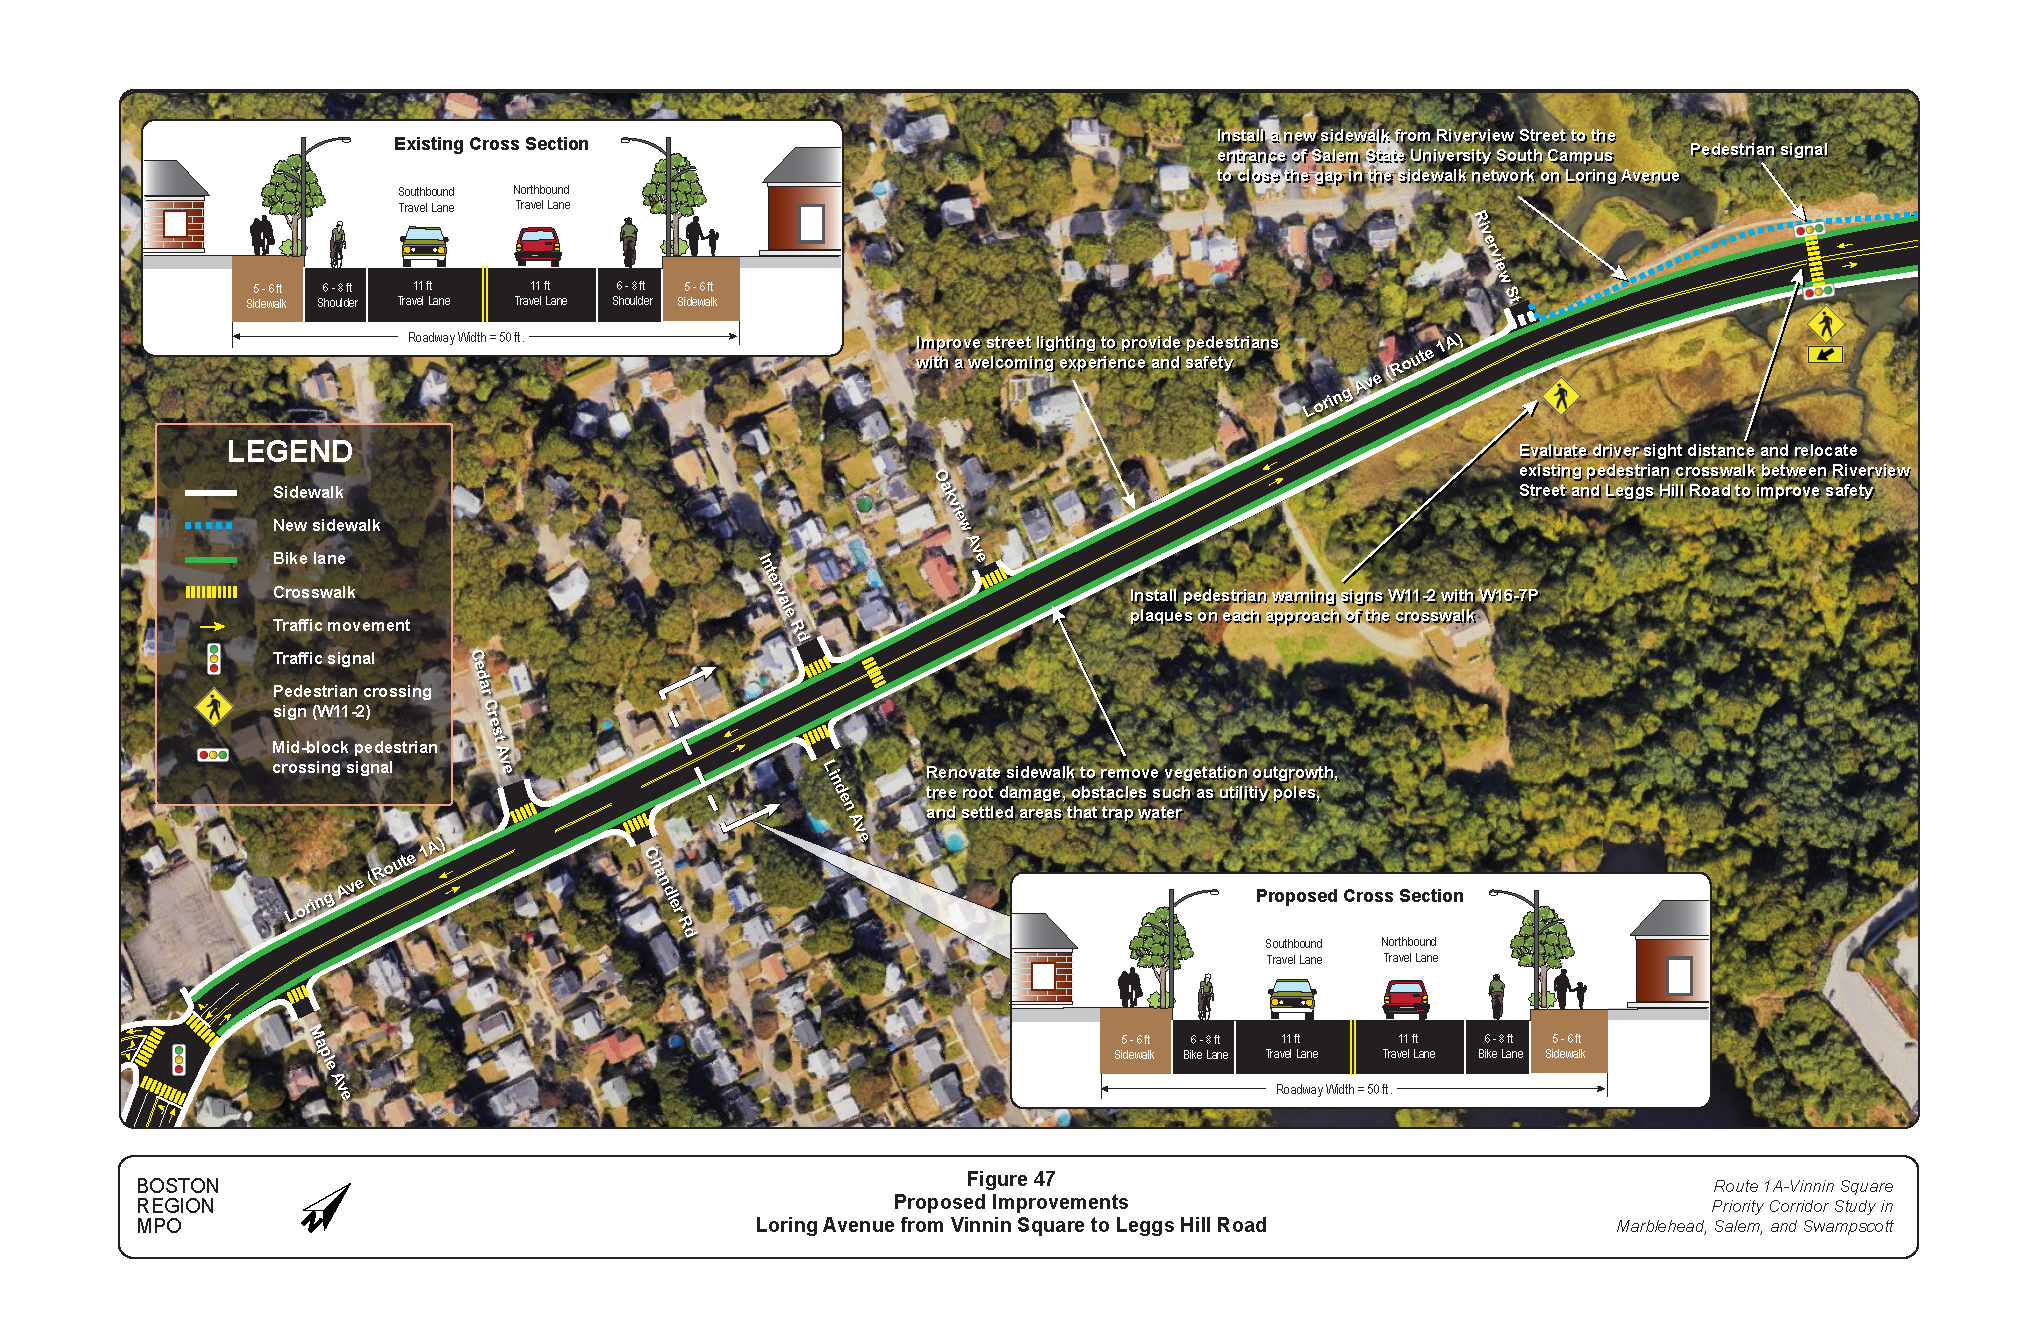
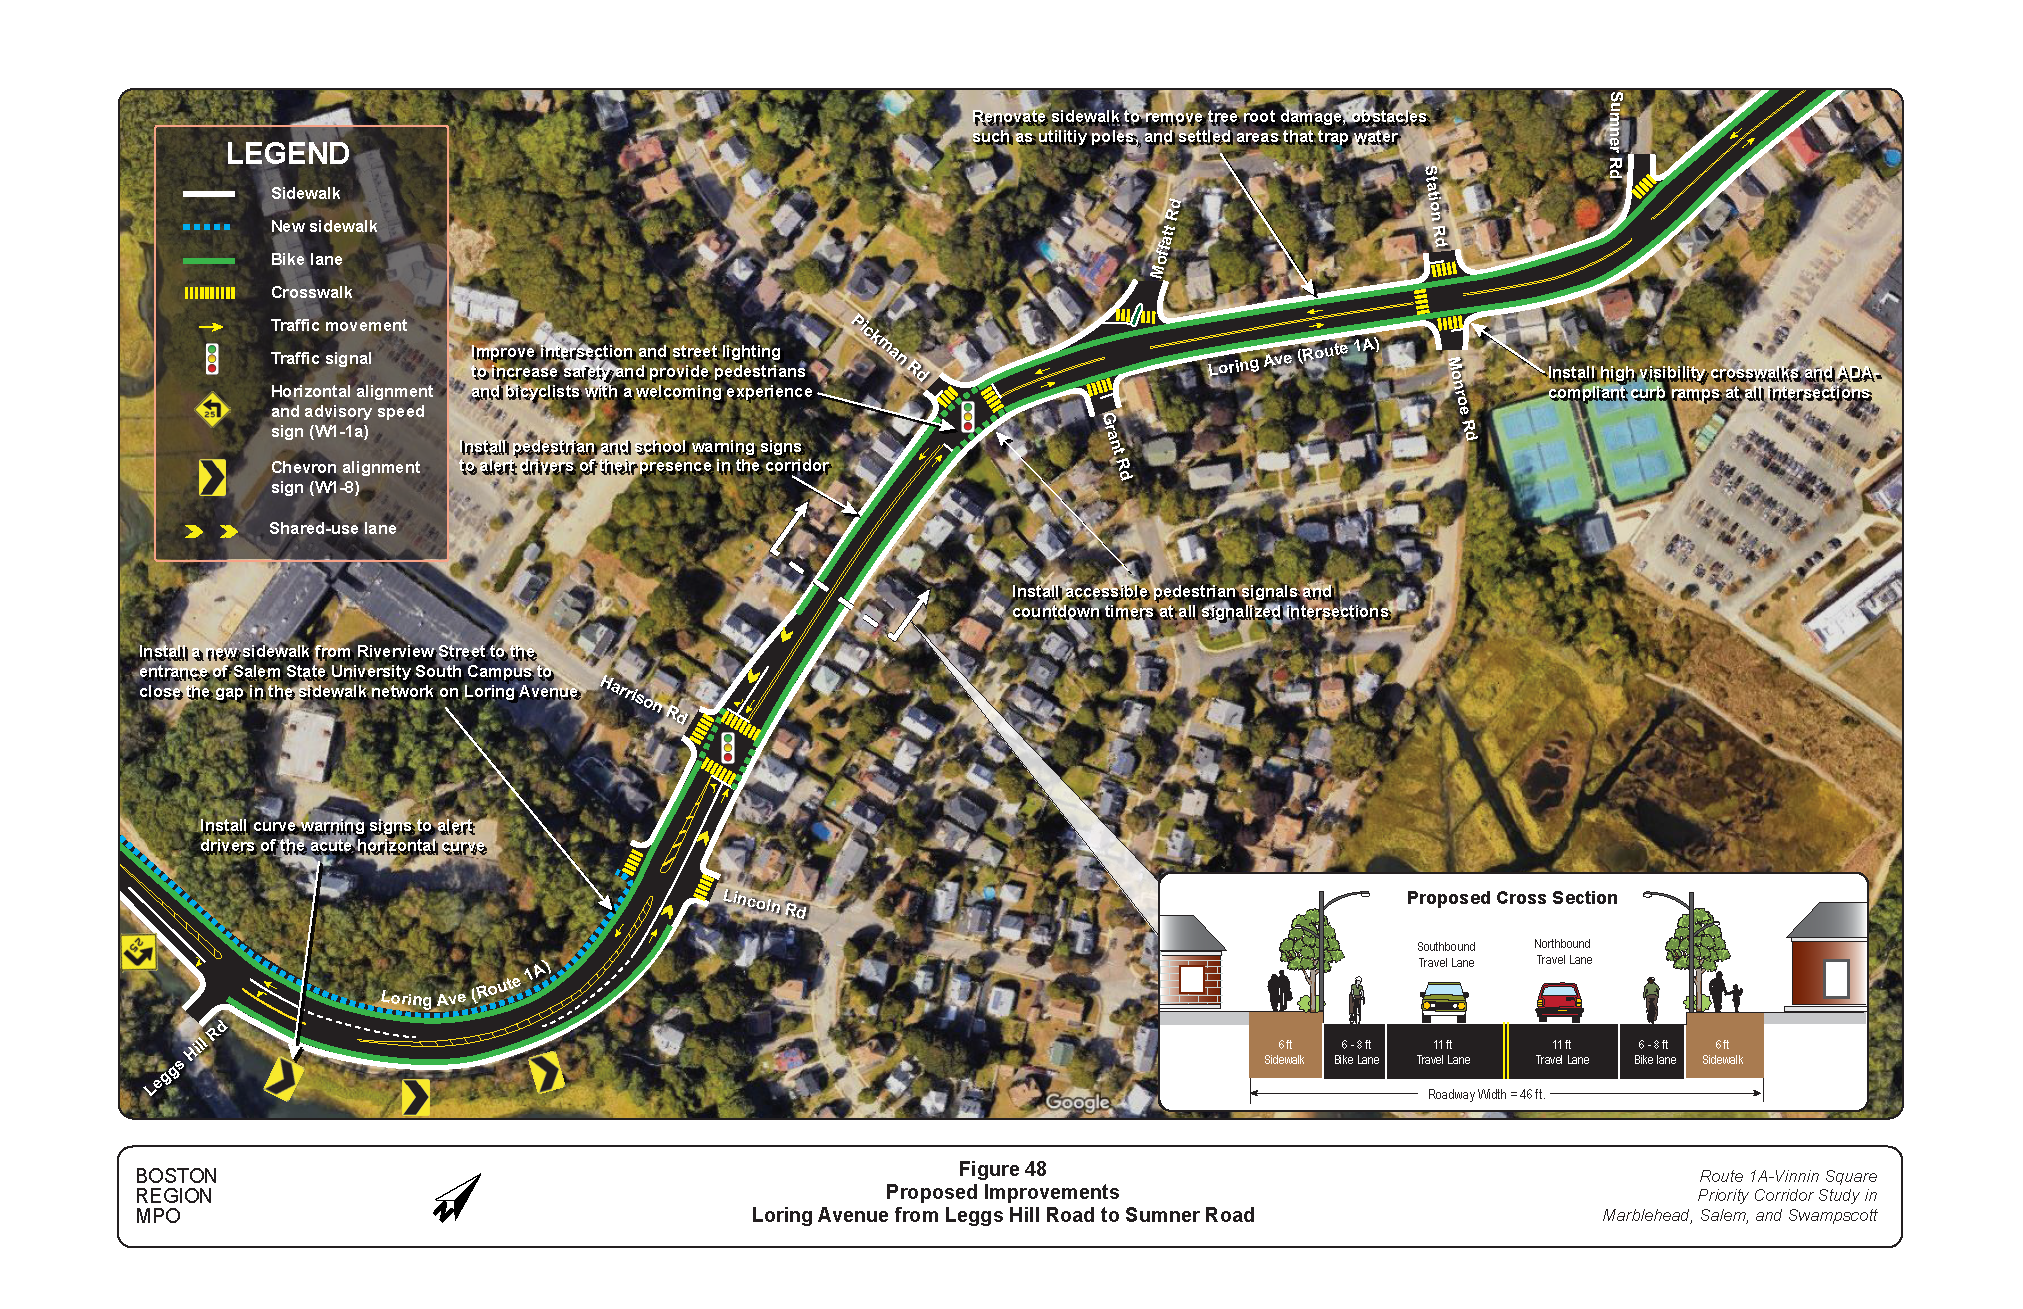
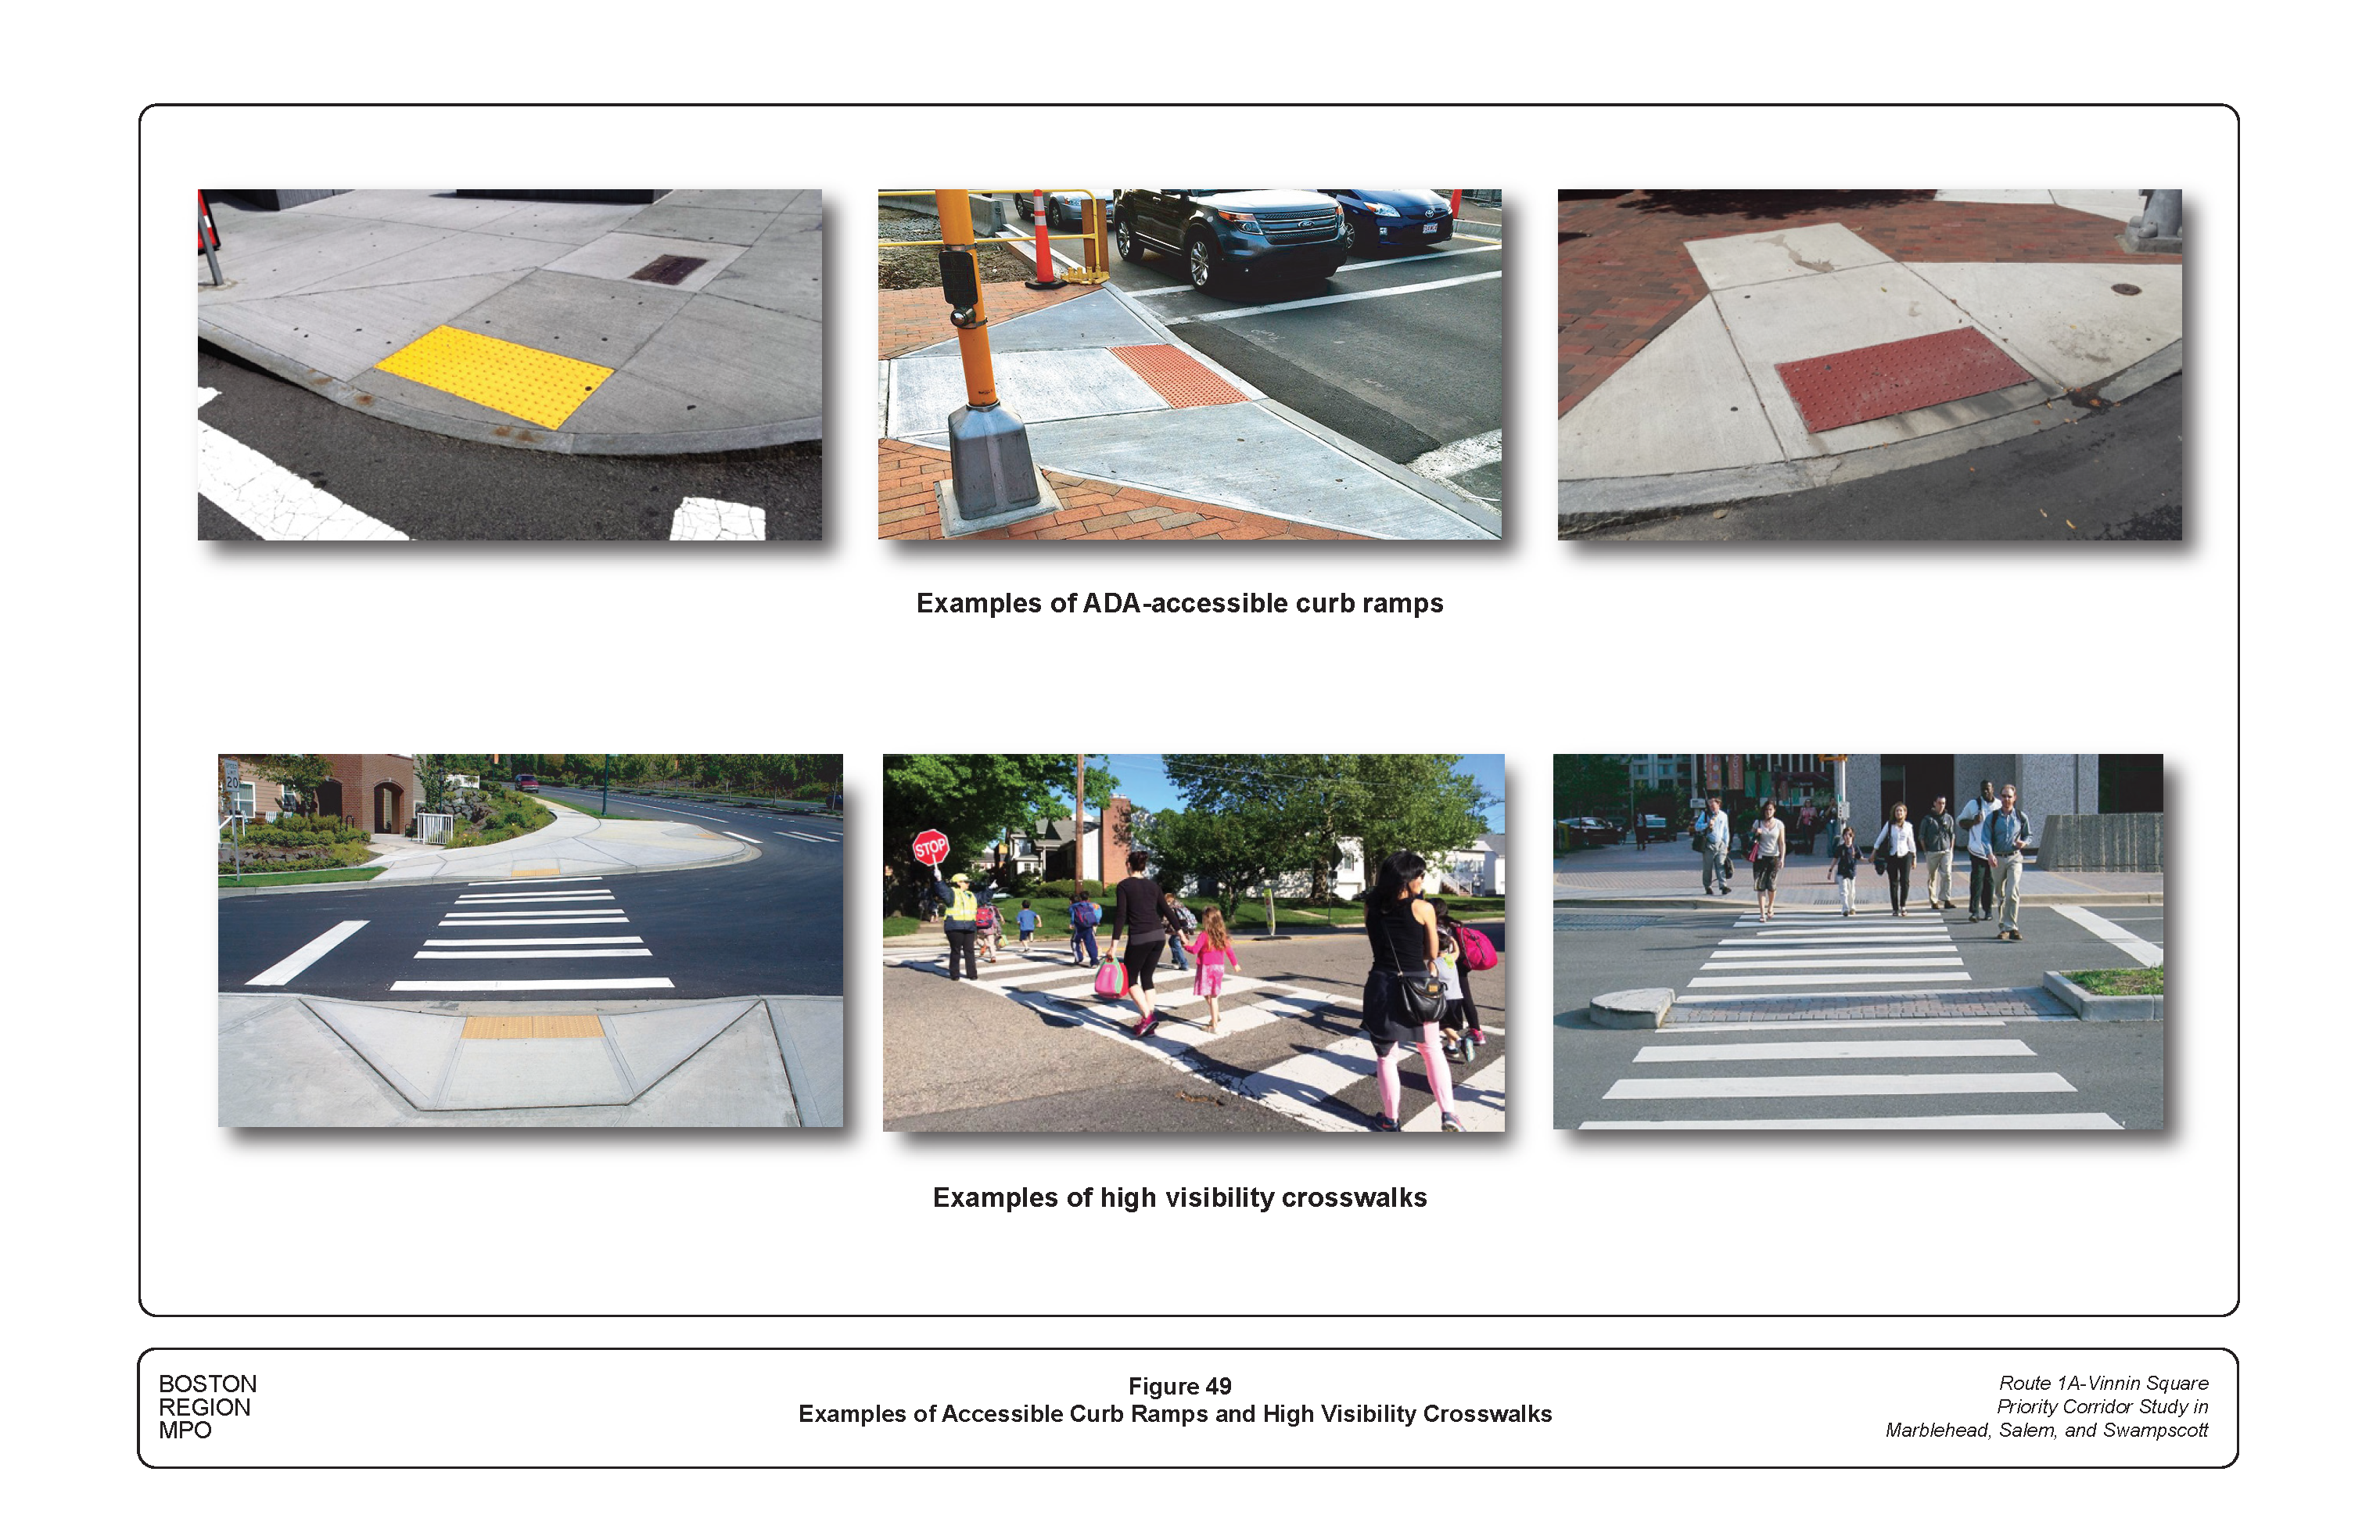
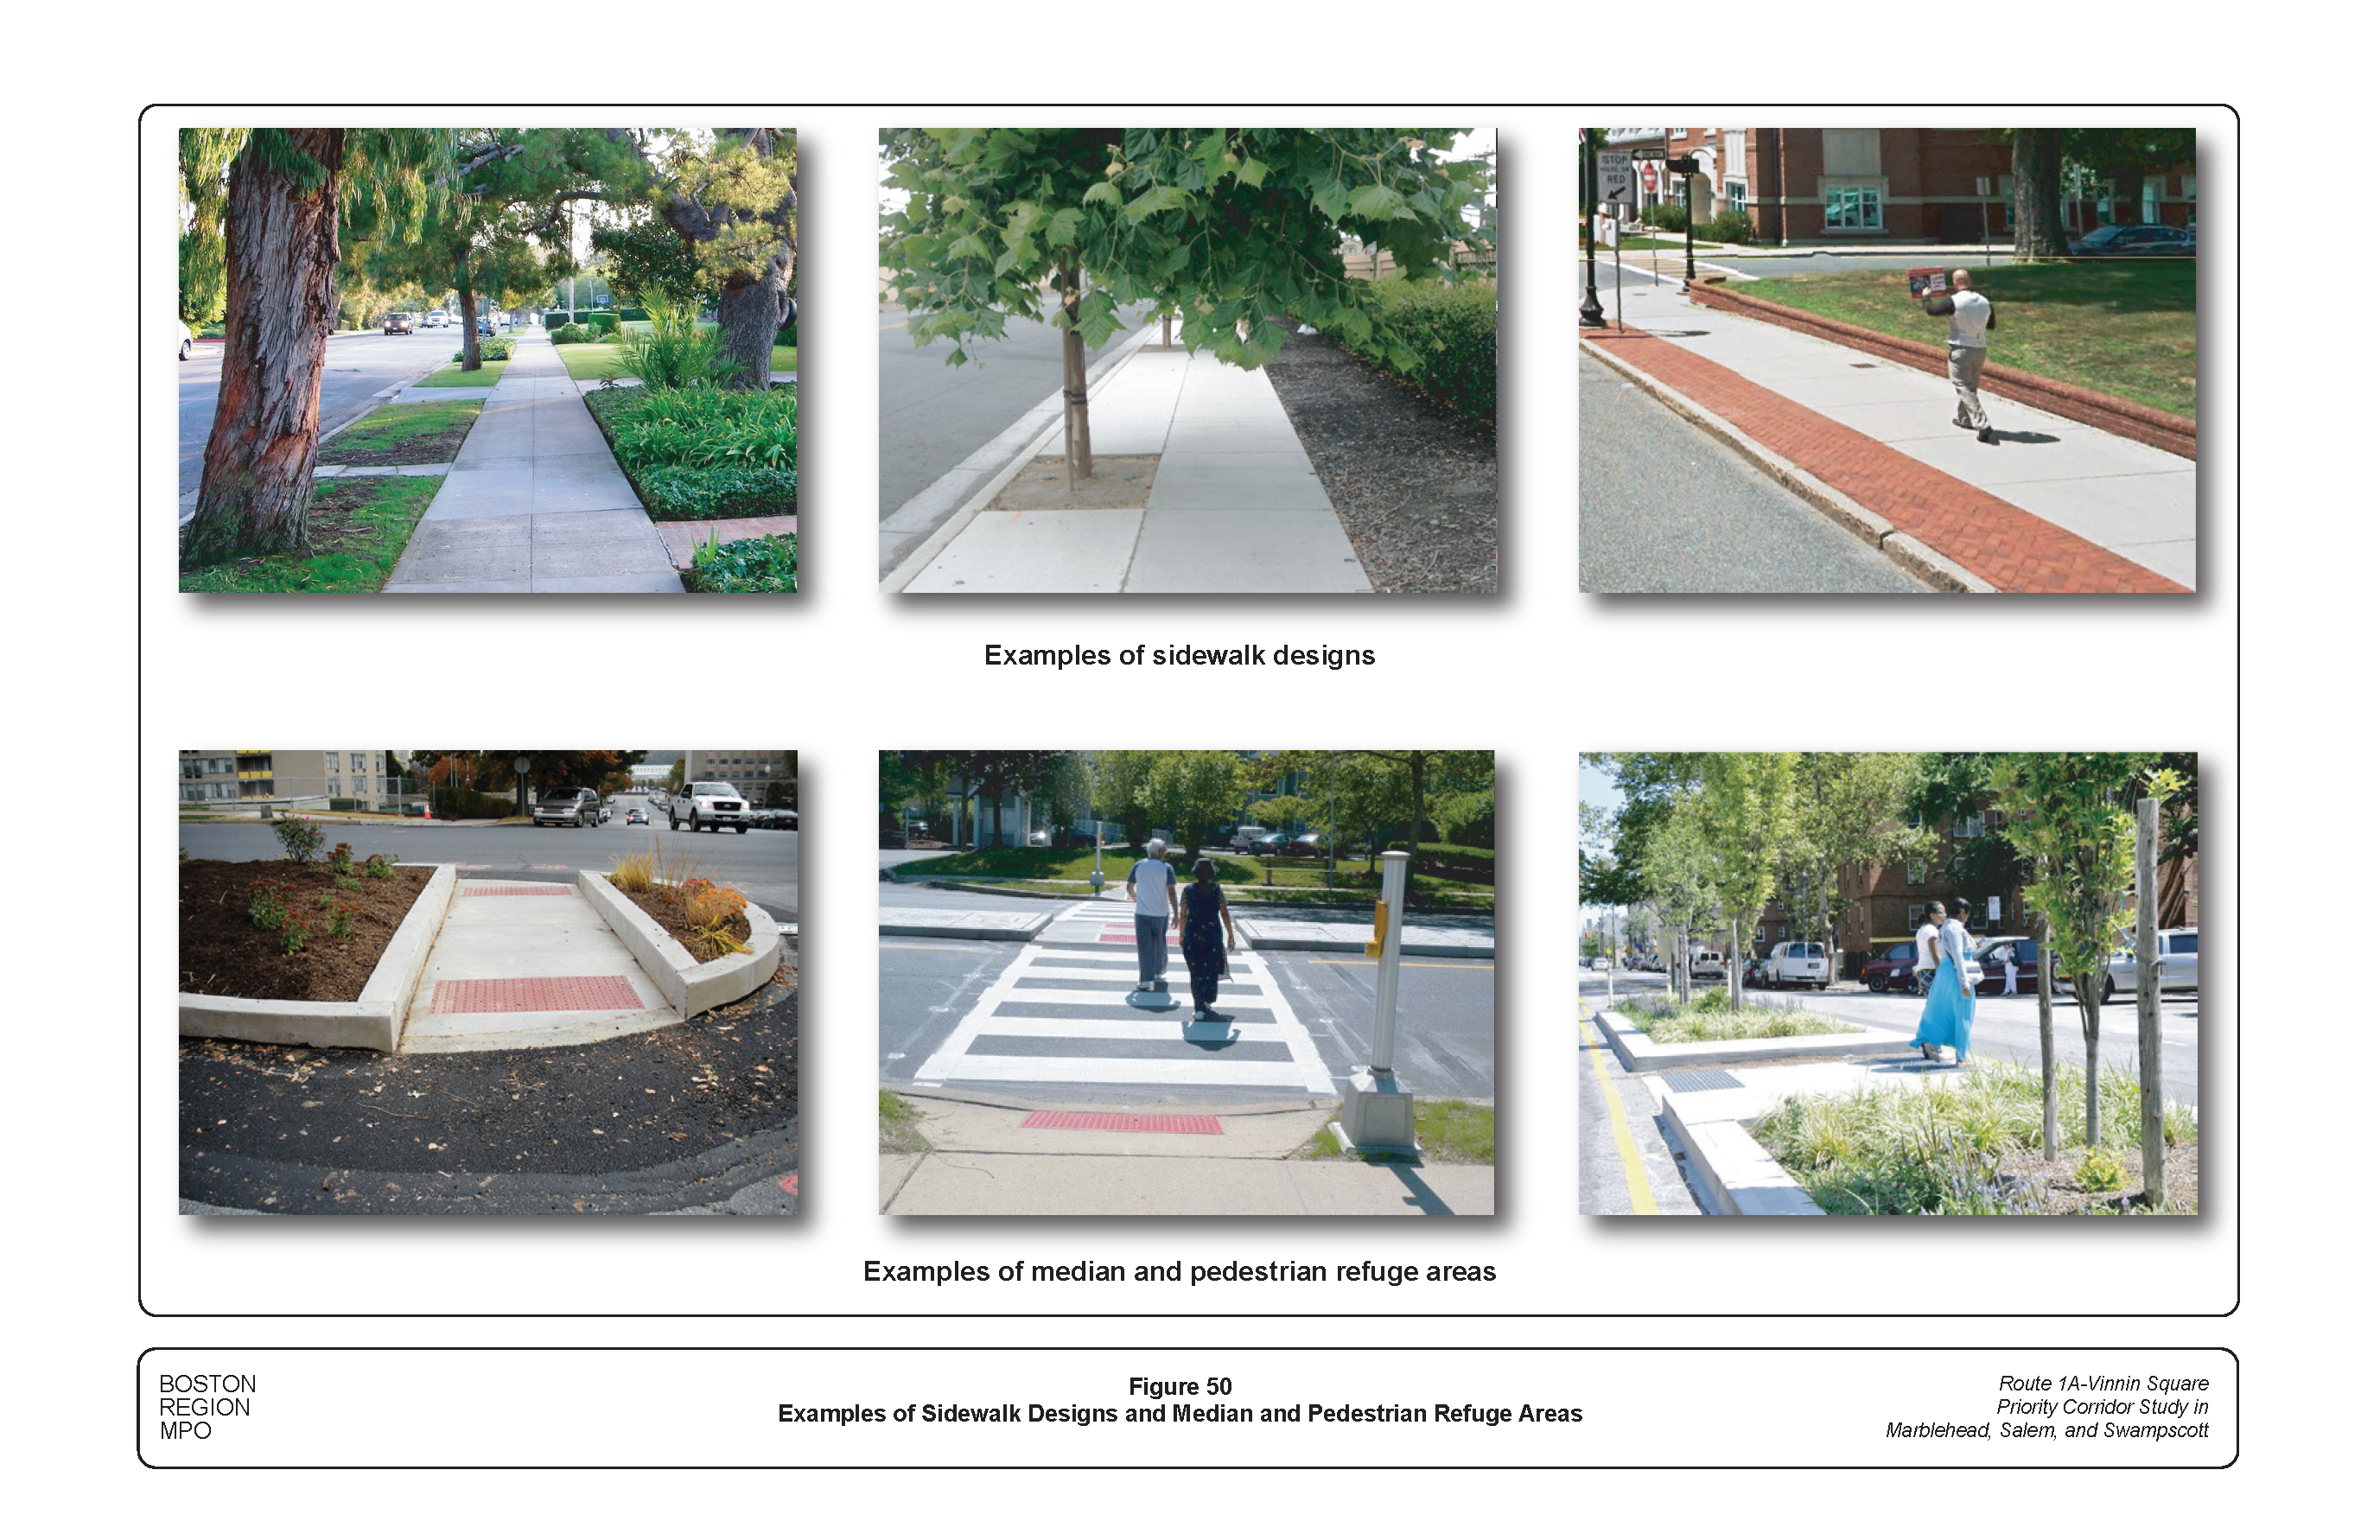
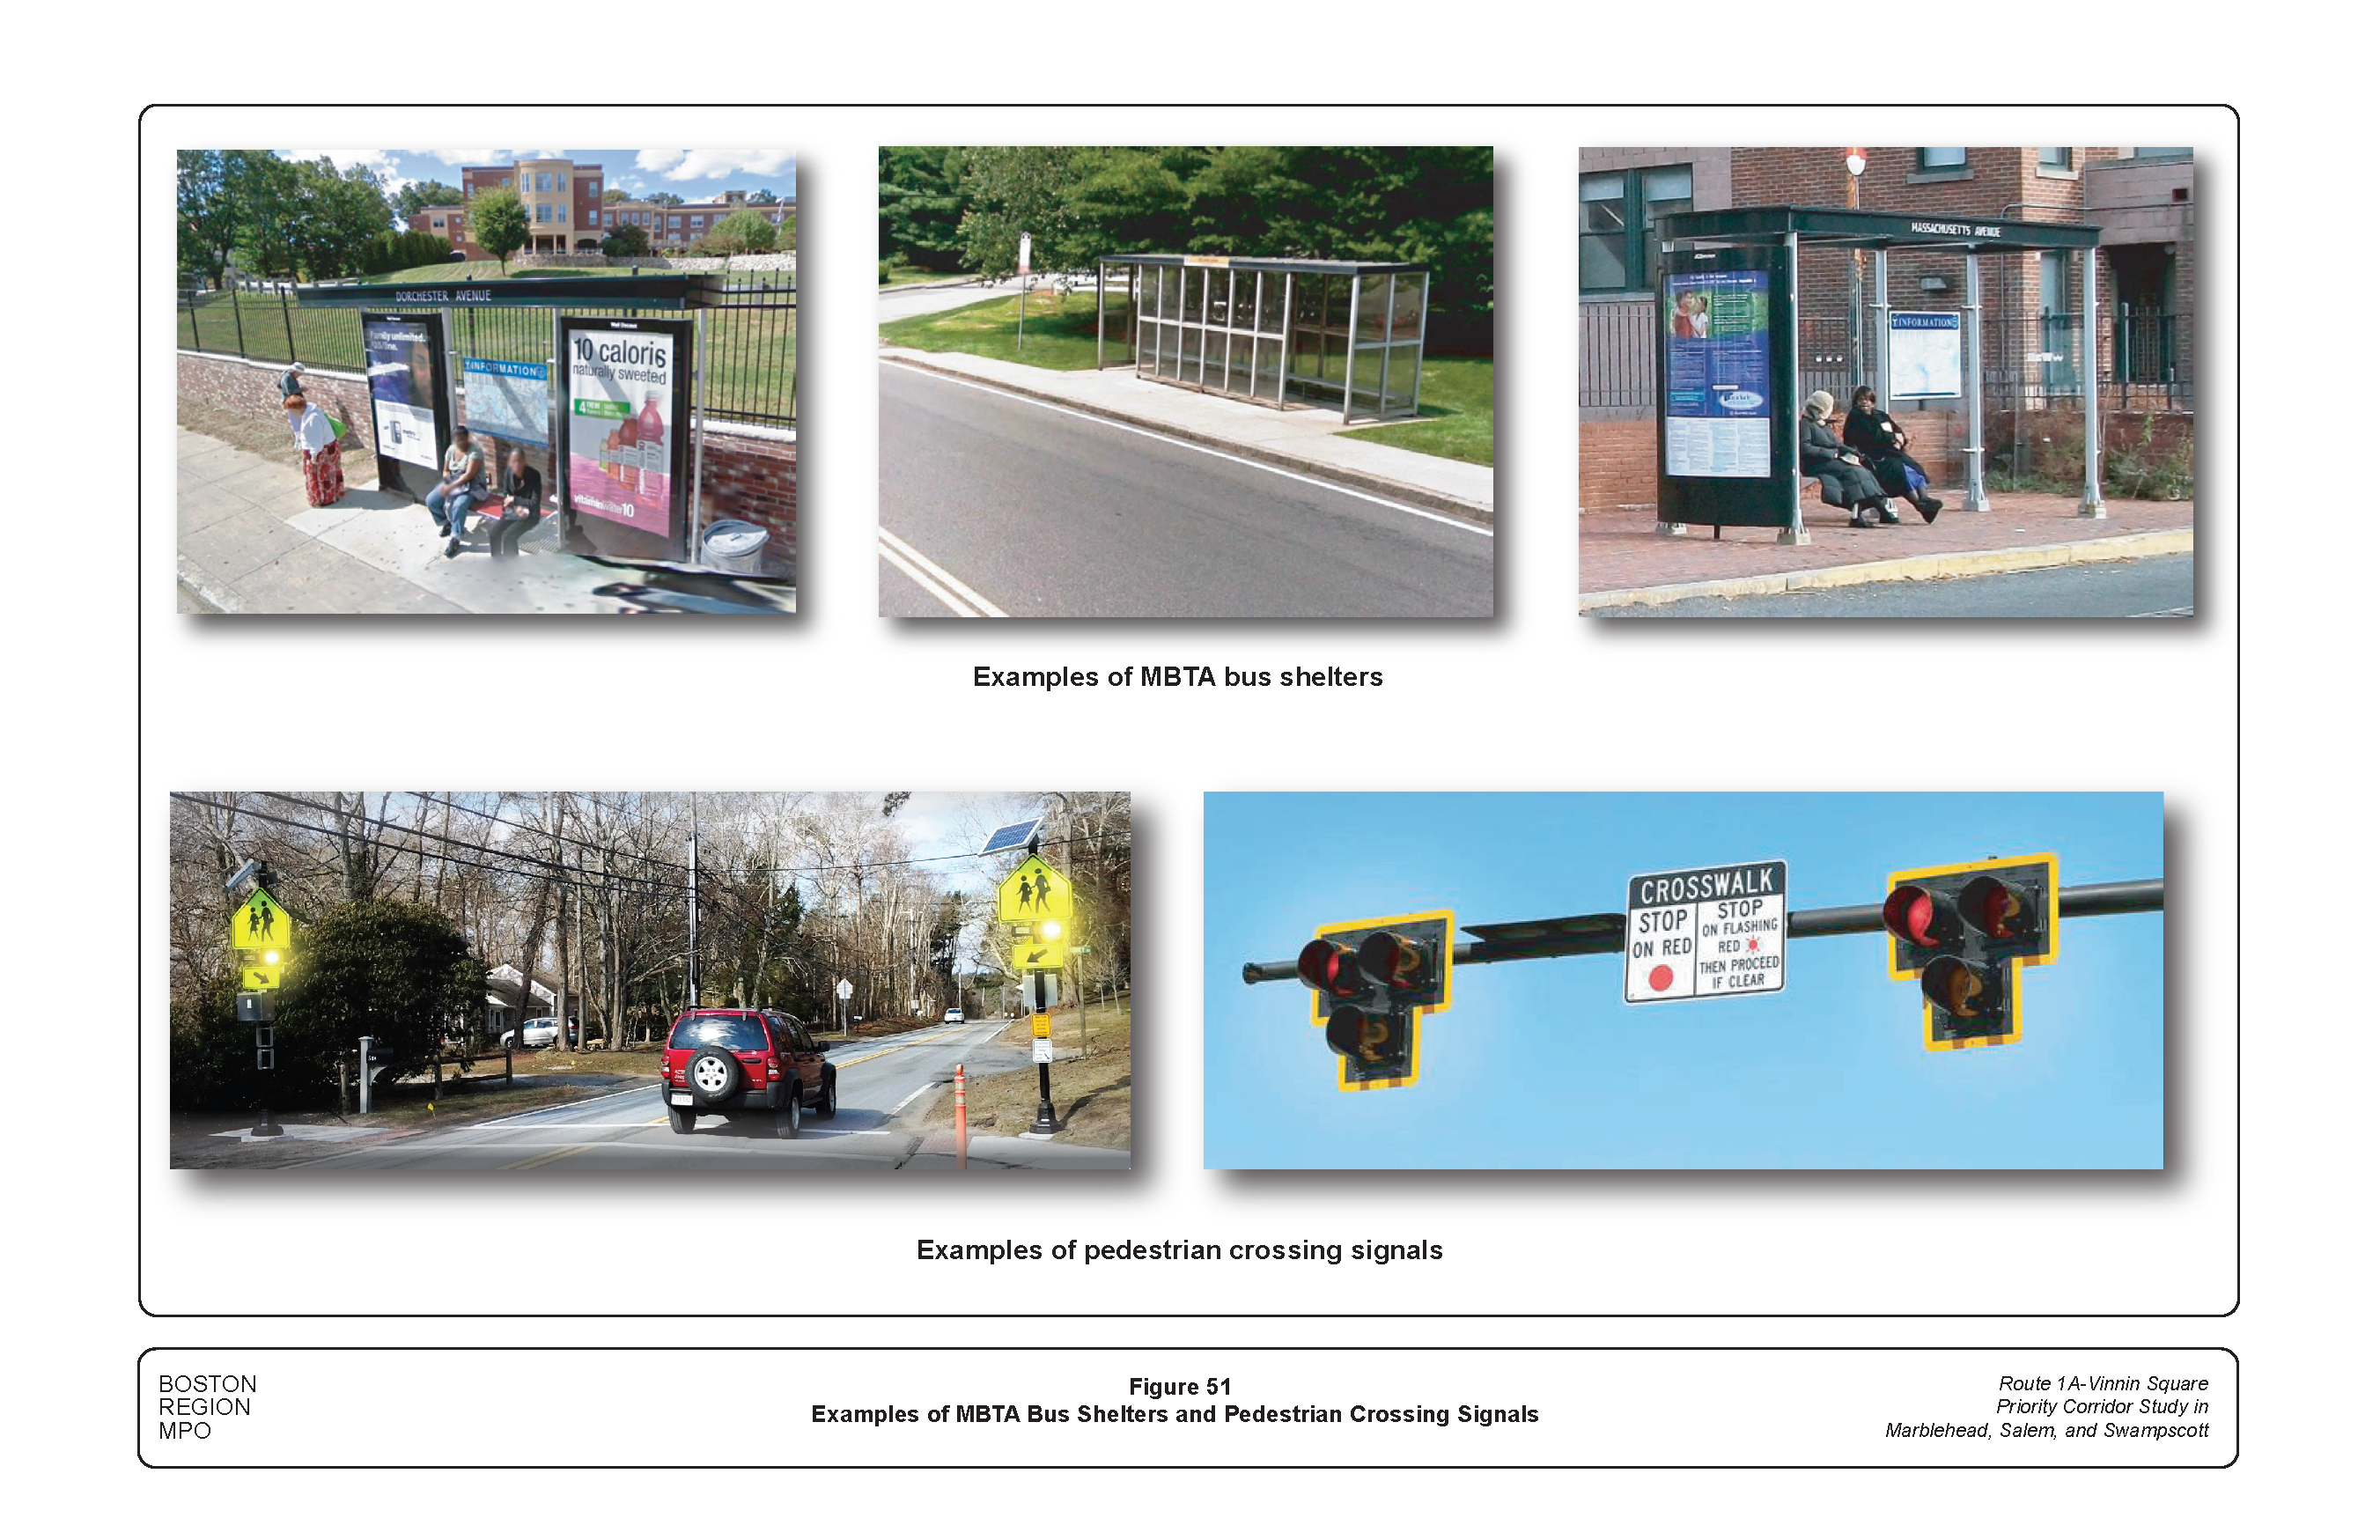
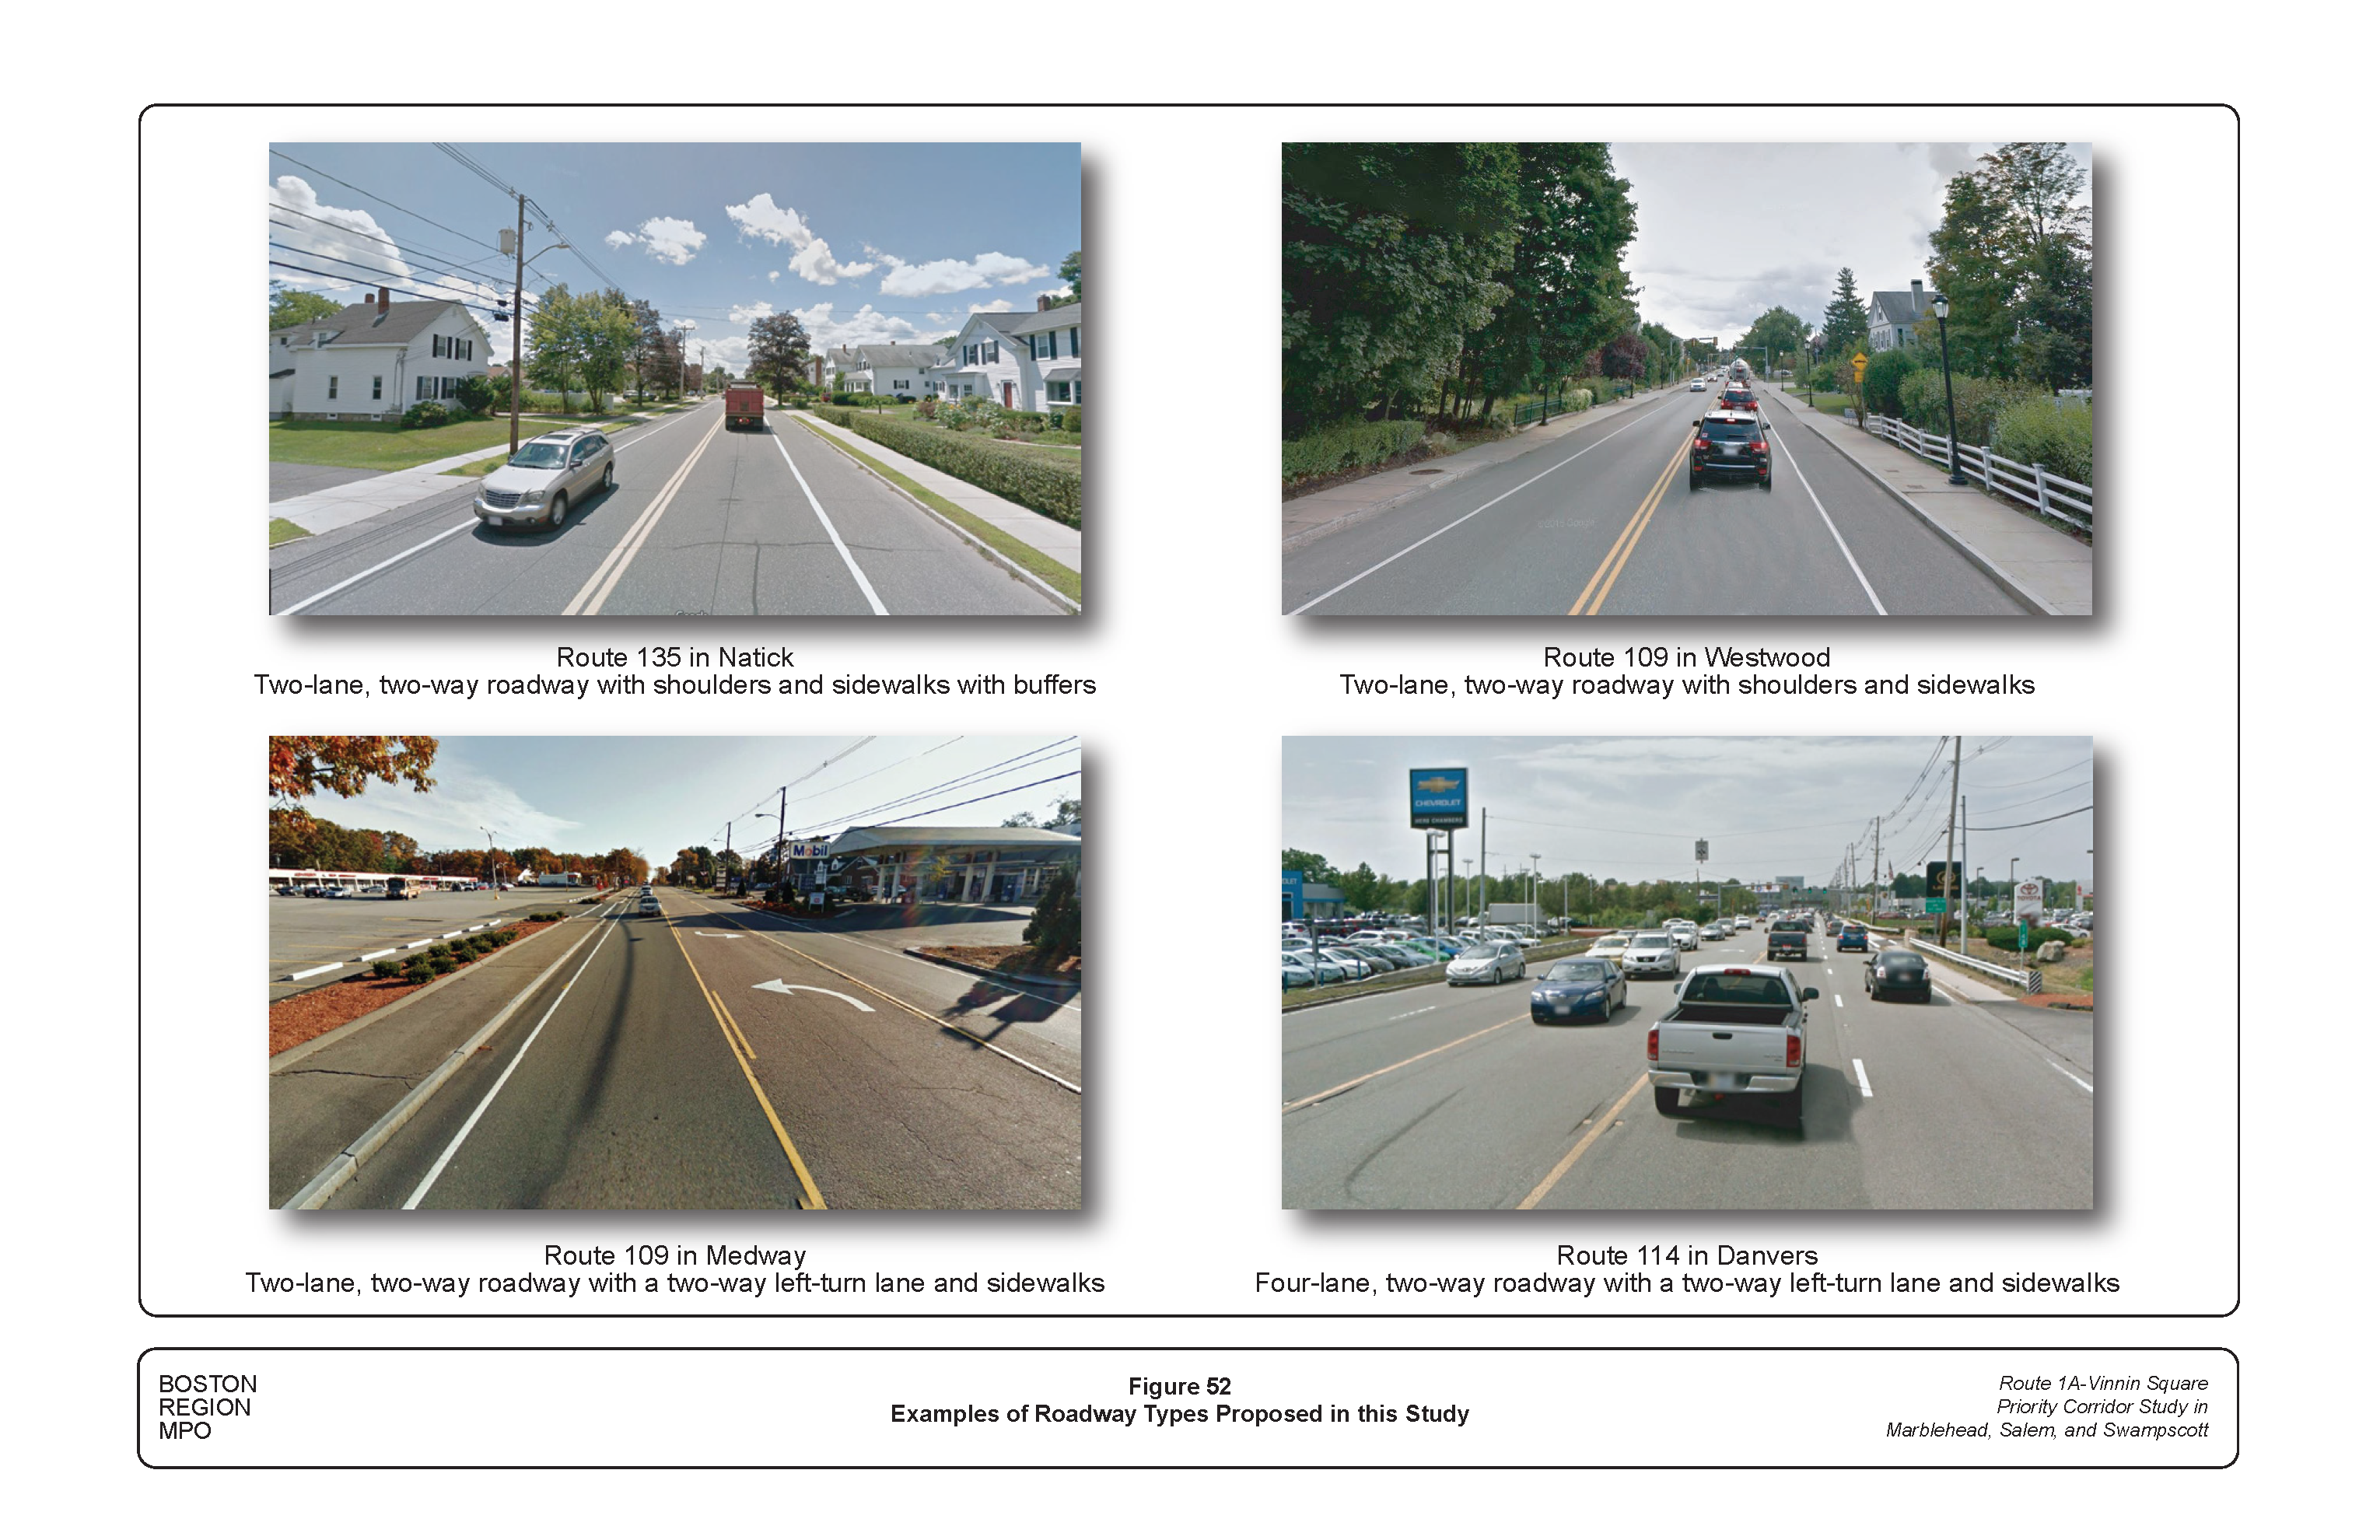
1 Boston Region Metropolitan Planning Organization, Charting Progress to 2040: The New Long-Range Transportation Plan of the Boston Region Metropolitan Planning Organization, endorsed by the Boston Region MPO on July 30, 2015.
2 Boston Region Metropolitan Planning Organization, Unified Planning Work Program, Federal Fiscal Year 2016, endorsed by the Boston Region Metropolitan Planning Organization on July 30, 2015.
3 Safety Conditions: The location has a higher-than-average crash rate for its functional class; contains a crash cluster that makes it eligible for Highway Safety Improvement Program (HSIP) funding; contains a crash location on MassDOT Highway Division’s Top High Crash Locations Report; or has a significant number of pedestrian and bicycle crashes (two or more per mile).
4 Congested Conditions: The travel time index is at least 1.3.
5 Multimodal Significance: The roadway carries one or more bus routes or is adjacent to a transit stop or station; the roadway supports bicycle or pedestrian activities or there is a project planned that will support these activities; there is a need to accommodate pedestrians and bicyclists and improve transit on the roadway; or there is a significant amount of truck traffic on the roadway serving regional commerce.
6 Regional Significance: The roadway is on the National Highway System; carries a significant portion of regional traffic (Average Daily Traffic of 20,000 vehicles or more); lies within 0.5 miles of environmental-justice transportation analysis areas or zones; or is essential for the region’s economic, cultural, or recreational development.
7 Reginal Equity: To ensure that, over time, all subregions in the MPO’s planning area receive UPWP planning studies, during each funding cycle MPO staff select no more than one location per subregion for potential study, and choose a location in a different subregion from the location studied in the preceding cycle.
8 Implementation Potential: The study location is proposed by the jurisdictional agency or agencies for the roadway; proposed or prioritized by a subregional group; or identified as a priority for improvement by other stakeholders.
9 Technical Memorandum, dated April 2, 2015, to the Boston Region Metropolitan Planning Organization, Federal Fiscal Year (FFY) 2016 Priority Corridors for Long-Range Transportation Plan (LRTP) Needs Assessment: Selection of Study Locations.
10 The Healthy Transportation Compact is a key requirement of the landmark transportation reform legislation, signed into law in June 2009, that aims to facilitate transportation decisions that balance the needs of all transportation users, expand mobility, improve public health, support a cleaner environment, and create stronger communities.
11 Right-of-way is defined as the land or interest therein, acquired for or devoted to a highway.
12http://www.salemnews.com/...s/salem-state-unveils-early-vision-for-school-campus-swap/article_9e2cd695-1683-5215-8d77-8d3cde7d9cb8.html
13 MassDOT Highway Division, Project Information Database, based on data queried on November 7, 2016. http://www.massdot.state.ma.us/highway/ProjectInfo.aspx
14 Ibid
15 Road Safety Audit, Loring Avenue, Salem, prepared for Massachusetts Department of Transportation, November 2013.
16 Road Safety Audit, 450 Paradise Road (Route 1A) at Swampscott Mall in Swampscott, Massachusetts, Prepared for Massachusetts Department of Transportation, August 27, 2015.
17 Assisted Living Residential Development, Traffic Impact Study, Swampscott, Massachusetts, January 2015.
18 Published by MassDOT, based on crash information queried on January 8, 2016. Massachusetts Department of Transportation website, crash rates, http://www.massdot.state.ma.us/highway/Departments/TrafficandSafetyEngineering/CrashData/CrashRates.aspx
19 Highway Capacity Manual 2010, Transportation Research Board of the National Academies, Washington, DC, December 2010.
20 Trafficware Inc., Synchro Studio 9.1, Synchro plus SimTraffic, Build 909, Revision 20, Sugar Land, Texas.
21 New York City Department of Transportation, Prospect Park West: Bicycle Path and Traffic Calming Update, http://www.nyc.gov/html/dot/downloads/pdf/2012_ppw_trb2012.pdf
22 J. Parks, P. Ryus., A. Tanaka, C. Monsere, M. McNeil, J. Dill, and W. Schultheiss, District Department of Transportation Bicycle Facility Evaluation, Project No. 11404, (2012),http://ddot.dc.gov/node/477212
23 The MUTCD lists nine traffic signal warrants that justify installing a traffic signal. The warrants are listed in Table 5.